The neutron star transient and millisecond pulsar in M28: from sub-luminous accretion to rotation-powered quiescence
Abstract
The X-ray transient IGR J18245–2452 in the globular cluster M28 contains the first neutron star (NS) seen to switch between rotation-powered and accretion-powered pulsations. We analyse its 2013 March-April 25 d-long outburst as observed by Swift, which had a peak bolometric luminosity of 6% of the Eddington limit (LEdd), and give detailed properties of the thermonuclear burst observed on 2013 April 7. We also present a detailed analysis of new and archival Chandra data, which we use to study quiescent emission from IGR J18245–2452 between 2002 and 2013. Together, these observations cover almost five orders of magnitude in X-ray luminosity (LX, 0.5–10 keV). The Swift spectrum softens during the outburst decay (photon index from 1.3 above LX/LEdd10-2 to 2.5 at LX/LEdd10-4), similar to other NS and black hole (BH) transients. At even lower luminosities, LX/LEdd=[10-4–10-6], deep Chandra observations reveal hard (=1–1.5), purely non-thermal and highly variable X-ray emission in quiescence. We therefore find evidence for a spectral transition at LX/LEdd10-4, where the X-ray spectral softening observed during the outburst decline turns into hardening as the source goes to quiescence. Furthermore, we find a striking variability pattern in the 2008 Chandra light curves: rapid switches between a high-luminosity “active” state (LX3.91033 erg s-1) and a low-luminosity “passive” state (LX5.61032 erg s-1), with no detectable spectral change. We put our results in the context of low luminosity accretion flows around compact objects and X-ray emission from millisecond radio pulsars. Finally, we discuss possible origins for the observed mode switches in quiescence, and explore a scenario where they are caused by fast transitions between the magnetospheric accretion and pulsar wind shock emission regimes.
keywords:
X-rays: bursts — X-rays: individual (IGR J18245–2452) — stars: neutron — X-rays: binaries — globular clusters: individual(M28) — pulsars: individual(PSR J1824–2452I)1 Introduction
Globular clusters have proved to be excellent locations for the study of low-mass X-ray binaries (LMXBs). This is due in part to the dynamical production of LMXBs through stellar interactions, which enhances the number of LMXBs per unit stellar mass by a factor of 100 over the rest of the Galaxy (e.g., Clark 1975), and makes clusters excellent targets to identify and study LMXBs. The knowledge of the companion’s age and metallicity, and the tight constraints on the distance and the absorbing column density () provided by optical observations, also assist in studies of LMXBs in clusters (e.g. Kuulkers et al. 2003).
Eighteen luminous (0.5–10 keV luminosity L erg s-1) LMXBs have been reported to date in 15 Galactic globular clusters (including IGR J18245–2452). In all cases the accreting compact object has been identified as a neutron star (NS), mostly thanks to the detection of thermonuclear bursts (in 16 systems) or accretion-powered pulsations (in 4 systems). About half are transients, detectable in outburst with wide-field X-ray monitors for a few days to months (see Table 5 in Bahramian et al. 2013, and references therein). Most LMXBs in globular clusters are usually in deep quiescence ( erg s-1), undergoing little or no accretion. An estimated total of 200 quiescent LMXBs exist in the Galactic globular cluster system, identified through deep observations with the high-resolution Chandra satellite (Pooley et al. 2003; Heinke, Grindlay & Edmonds 2005). Quiescent NS-LMXBs typically produce blackbody-like thermal emission from their surfaces at erg s-1 (Rutledge et al. 2000), although a substantial subset of quiescent NS-LMXB spectra are dominated by non-thermal emission of unknown origin, perhaps produced by continued low-level accretion or a pulsar wind shock (Campana et al. 1998; Wijnands et al. 2005). The thermal NS surface emission is understood to be due to the release of heat deposited in the deep crust during accretion outbursts (Brown, Bildsten & Rutledge 1998; Rutledge et al. 2002).
The globular cluster M28 (NGC 6626) is home to 12 known millisecond radio pulsars (MRPs, Begin 2006; Bogdanov et al. 2011b). Numerous other faint X-ray sources in the cluster were identified with deep Chandra-ACIS observations in 2002 and 2008, including a relatively bright source (S26) with a soft spectrum indicative of a quiescent NS-LMXB (Becker et al. 2003; Servillat et al. 2012). An unusual, subluminous (0.02 of the Eddington luminosity) X-ray burst was detected from the direction of M28’s core by ASCA, during a time when no LMXB was obviously active in the cluster, suggesting low-level accretion in quiescence (Gotthelf & Kulkarni 1997).
A new X-ray transient was discovered by INTEGRAL on 2013 March 28, from a position consistent with M28, and named IGR J18245–2452 (Eckert et al. 2013). Using Swift-XRT observations, Heinke et al. (2013) confirmed the association of the new transient with the core of M28. Romano et al. (2013) and Barthelmy et al. (2013) reported analyses of the X-ray light curve and spectrum of IGR J18245–2452 near the outburst peak, which triggered the Swift-BAT on three occasions (Romano et al. 2013). A type I (thermonuclear) X-ray burst from IGR J18245–2452 was detected with the Swift-XRT on 2013 April 07 (Papitto et al. 2013a; Linares 2013), identifying the source as a NS-LMXB. Pavan et al. (2013) reported the radio detection and sub-arcsecond position of IGR J18245–2452 in outburst, on 2013 April 05, which is consistent with only one source from Becker et al. (2003): S23. Using the improved radio location a variable likely optical counterpart to IGR J18245–2452 was found in archival HST observations (Pallanca et al. 2013; Cohn et al. 2013). A Chandra observation taken on 2013 April 28 (Homan & Pooley 2013) showed no new bright sources in the core of M28, and S23 at a luminosity higher than that measured in 2002.
Papitto et al. (2013b) discovered 254 Hz X-ray pulsations during two XMM observations taken on 2013 Apr. 3 & 13, and identified the new transient NS-LMXB with a previously known MRP in an 11 hr orbit: PSR J1824–2452I (Begin 2006). MRPs (Backer et al. 1982) have long been thought to be the evolutionary end point of NS-LMXBs (Alpar et al. 1982). The discovery of accretion-powered millisecond pulsars (AMPs; Wijnands & van der Klis 1998) provided strong evidence for such evolutionary link. While other indirect evidence has been presented (Burderi et al. 2003; Archibald et al. 2009), Papitto et al. (2013b) found IGR J18245–2452 to be the first system directly observed to switch between MRP and AMP phases at different times. IGR J18245–2452 was detected again as an MRP after the 2013 outburst (Papitto et al. 2013c). Burst oscillations were found in the April 07 burst observed by Swift, at the 254 Hz spin frequency (Patruno 2013; Papitto et al. 2013b; Riggio et al. 2013).
We present a detailed analysis of the 2013 March-April outburst of IGR J18245–2452 as observed by Swift, as well as the thermonuclear burst that led to its NS-LMXB classification (Sec. 3.1). We also study the quiescent properties of IGR J18245–2452, using deep Chandra observations of M28, and we find that it features a hard, purely non-thermal and highly-variable quiescent spectrum. We find evidence for a spectral transition around 10-4 (Sec. 3.2), and a striking variability pattern in the longest Chandra observations of IGR J18245–2452 in quiescence (Sec. 3.3). We discuss our results in Section 4, in the context of low-luminosity accretion flows, quiescent emission from NS-LMXBs and X-ray emission from MRPs.
2 Data Analysis
We give in this Section a detailed explanation of the data reduction and analysis procedures. All luminosities, radiated energies and radii in this work use 5.5 kpc, the distance reported by Harris (1996, 2010 revision) based on HST photometry of M28/NGC 6626 (Testa et al. 2001). When normalizing luminosities to the Eddington limit, we use =2.5 erg s-1. Unless otherwise noted, uncertainties are quoted at the 1 confidence level and fluxes and luminosities are given in the 0.5–10 keV band. Since hard states emit a sizeable fraction of their total luminosity outside the 0.5–10 keV band covered by the Swift-XRT, a bolometric correction (=3) is applied when estimating mass accretion rates (see, e.g., in’t Zand, Jonker & Markwardt 2007).
2.1 Swift
We analysed all Swift-XRT observations of M28 available in August 2013, totalling 28 observations and about 37 ksec of on-source time, including pre-planned (target numbers 90442, 32785, 32787) and triggered (triggers 2336, 2369, 2370) observations. All products were extracted using FTOOLS (v. 6.12). The only Swift observation taken before the discovery outburst of IGR J18245-2452 (on 2010-06-24) shows a blend of very faint unresolved sources in the core of M28 (Becker et al. 2003, see below), and was not included in the rest of the analysis.
One persistent and one background spectrum were extracted per observation (after running xrtpipeline, v. 0.12.6) using pointed data in windowed timing (WT) or photon counting (PC) mode (taking the longest exposure when both modes were present in the same observation). A circular extraction region with a 30-pixel radius centered on the source position (Romano et al. 2013) was used for most observations; an annular region with 5- and 40-pixel radii was used in the brightest PC mode observations in order to correct for pile-up. The X-ray burst was excluded to obtain the persistent spectrum of the corresponding observation. We created ancilliary response files using xrtmkarf (v. 0.6.0) and an exposure map for each event file using xrtexpomap (v. 0.2.7), thereby correcting for vignetting and the XRT’s point spread function (PSF). After grouping the spectra to a minumum of 15 counts per bin, we fitted them in the 0.5–10 keV band within Xspec (v. 12.7.1; Arnaud 1996) using the latest response matrices from the calibration database (0to12s6_20070901v011 and 0to2s6_20070901v012 for PC and WT mode, respectively) and a simple absorbed power law model.
Swift-XRT cannot resolve the numerous faint ( erg s-1) X-ray sources often present in the center of globular clusters. In the case of M28, twelve sources have been detected with Chandra within the 0.24’ core radius (Becker et al. 2003), which is similar to Swift-XRT’s half-power diameter, 0.3’. The standard background subtraction method, which uses a source free region outside the globular cluster’s core, does not take into account the contribution from nearby faint X-ray sources in the center of M28, which we refer to as “unresolved faint-source background” (UFB). We investigated whether or not this additional background component affects the flux and spectral parameters from IGR J18245–2452 measured with the XRT, as follows. We extracted a spectrum from the 2002 and 2008 Chandra-ACIS observations of M28 (Sec. 2.2) using the same (1.2’ radius) region used for Swift-XRT extraction but excluding our source of interest, IGR J18245–2452. The resulting UFB spectrum does not change between the 2002 and 2008 observations and can be fitted with an absorbed power law model with photon index 1.960.06 (90% c.l.; cm-2), which yields a 0.5–10 keV luminosity of erg s-1 and an XRT count rate of 1.8 c s-1.
We then repeated the XRT spectral fits of the persistent emission, adding a second power-law component to the model with parameters frozen at the values found for the UFB spectrum (and a multiplicative constant fixed at 0.926 to take into account the absolute flux calibration difference between ACIS-S3 and the XRT, Tsujimoto et al. 2011). Thus the final model used was phabs*(powerlaw + constant*powerlaw), where the second term is kept fixed and accounts for the UFB. We thereby fit only excess emission above the UFB, i.e., from our source of interest (the only known variable source within the extraction region).
For luminosities above erg s-1 we find spectral parameters fully consistent with those found with the standard background subtraction method. When IGR J18245–2452’s luminosity drops below erg s-1, however, its flux becomes comparable to that of the UFB and its spectrum cannot be well constrained with Swift-XRT. We therefore excluded those observations taken between Apr 19 and May 06, when IGR J18245–2452 was too faint to be disentangled from the UFB. We also fitted together three observations taken on consecutive days (Apr 15-17) in order to improve the spectral constraints on IGR J18245–2452 at the faintest luminosities accessible to Swift ( erg s-1). Finally, we verified that fixing to the values found with Chandra yields consistent results ( cm-2 gives photon indices lower by 10%, and a similar softening with decreasing , although the fits with this model are worse than those using our preferred free NH model; Sec. 3).
| Epoch | Observation | Date | Exp. | Luminosity111Luminosity in the 0.5-10 keV band. Flux in the 0.5-10 keV band, absorbed/observed. | Fluxa | 222Power law photon index (photon flux E-Γ). | NH333Absorbing column density; frozen values are noted with a “” symbol. | /dof |
|---|---|---|---|---|---|---|---|---|
| IDs | (dd/m) | (ksec) | (erg s-1) | (erg s-1 cm-2) | (1021 cm-2) | |||
| 2002 | 268-4,5,3 | 04/7,04/8,11/9 | 41 | [2.50.8] | [6.62.0] | 0.80.3 | 2.6 | 4.0/3 |
| 2002444Fit to the same 2002 spectrum using Cash’s C-statistic. | 268-4,5,3 | 04/7,04/8,11/9 | 41 | [2.20.4] | [5.41.0] | 1.20.2 | 2.6 | 294.2/647 |
| 2008 | 9132(Average) | 07/8 | 144 | [3.00.1] | [7.20.3] | 1.440.05 | 2.60.2 | 257.3/249 |
| 2008-A | 9132(Active) | 07/8 | 97 | [3.90.1] | [9.20.4] | 1.510.04 | 2.90.2 | 33.3/27 |
| 2008-P | 9132(Passive) | 07/8 | 47 | [5.61.0] | [1.30.2] | 1.450.15 | 2.60.8 | 29.7/29 |
| 2013 | 14616 | 28/4 | 15 | [3.80.7] | [8.91.6] | 1.60.2 | 2.6 | 9.5/15 |
For the burst time-resolved spectroscopy, we extracted contiguous spectra in 2s steps (4s in the last stages of the burst tail) and used a 100s-long interval as background, therefore assuming that the persistent emission remains constant during the burst. As the burst peak count rate was higher than 300 c/s, above the nominal pile-up limit for WT mode, we used an annular extraction region with radii of 1 and 20 pixels centered on the XRT position (Romano et al. 2013). We fitted the resulting spectra as above, but using this time an absorbed black body model with fixed at 4.41021 cm-2, the value reported from XRT spectroscopy of IGR J18245–2452’s persistent emission (Romano et al. 2013; Heinke et al. 2013, we also checked that leaving free gives consistent results).
2.2 Chandra
We analysed all publicly available Chandra-ACIS-S observations of M28, totalling 41 ksec in 2002 (July-August; obs. IDs 2684, 2685 and 2683; see Becker et al. 2003) and 199 ksec in 2008 (August; obs. IDs 9132 and 9133; see Bogdanov et al. 2011b). Following the discovery of the new transient IGR J18245–2452 (Eckert et al. 2013, Sec. 1), we obtained a 15 ksec Chandra ToO observation of M28 on 2013-04-28 (obs. ID 14616, Homan & Pooley 2013), which we also analyse herein. Table 1 shows a summary of the Chandra-ACIS observations and spectra. We also analysed the two publicly available Chandra-HRC-S observations of M28, taken in 2002 (November, obs. 2797) and 2006 (May, obs. 6769). Even though no spectral information is available in the HRC data, we extracted background-corrected count rates from IGR J18245–2452 using a 1.6”-radius circular region, in order to constrain the source quiescent luminosity at all possible times. All products were extracted using tools and scripts from the latest available CIAO555Chandra Interactive Analysis of Observations, available at http://cxc.harvard.edu/ciao/ package (v. 4.5; Fruscione et al. 2006).
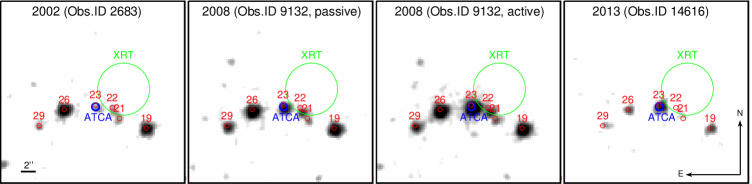
Figure 1 shows four smoothed Chandra-ACIS-S images of M28’s core taken in 2002, 2008 during the passive state, 2008 during the active state and 2013 after the outburst of IGR J18245–2452 (see Table 1 for observation IDs and exposure times). See Sections 3.3 and 4.3, respectively, for a definition and discussion of active/passive states. Superposed are the initial Swift-XRT location of IGR J18245–2452 (Romano et al. 2013, green circle), the position of the ATCA radio counterpart found during its 2013 outburst (Pavan et al. 2013, blue circle) and the nearby faint X-ray sources studied by Becker et al. (2003, red circles). Only source 23 from Becker et al. (2003) is consistent with the ATCA position (as noted by Pavan et al. 2013; Papitto et al. 2013b), which is also consistent with the Chandra-HRC location reported by Papitto et al. (2013b), and marginally consistent with the Swift-XRT location (Romano et al. 2013, which was not “enhanced” with UVOT attitude correction). Hence we confirm the association of the new transient source IGR J18245–2452 with source 23 of Becker et al. (2003).
Source spectra were extracted from primary event files using circular regions of 2–4 pixel radii and the script specextract (v. 10), which creates the corresponding ancilliary response files corrected for Chandra’s PSF. We grouped the resulting spectra to a minimum of 15 counts per energy bin, and extracted the background spectrum from a 10-pixel circular source-free region. In order to increase the signal-to-noise ratio (S/N) in the 2002 spectrum of IGR J18245–2452’s quiescent counterpart, we summed the spectra and event files from all three observations using the CIAO scripts combine_spectra and reproject_obs, respectively.
3 Results
3.1 Outburst evolution and thermonuclear burst
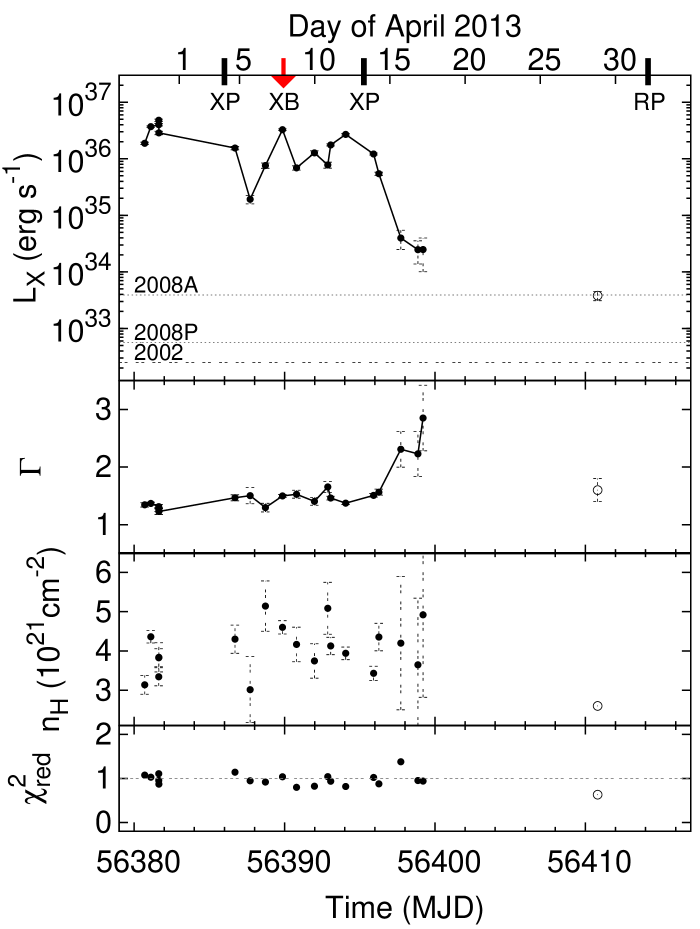
Figure 2 shows an overview of the 2013 outburst from IGR J18245–2452 including the evolution of the luminosity, photon index, and the reported detection dates of the thermonuclear burst (Papitto et al. 2013a; Linares 2013), X-ray pulsations (Papitto et al. 2013b) and reappearance of radio pulsations (Papitto et al. 2013c). A simple absorbed power law model provides a good fit to the persistent (accretion-powered) Swift-XRT spectra, and yields photon indices in the range 1.2–2.8. We find a maximum 0.5–10 keV outburst luminosity of (4.80.2) 1036 erg s-1 (6% of assuming a bolometric correction factor =3) on 2013 March 30, and a power law (photon) index of 1.260.03 on the same date. These luminosities and photon indices, as well as the burst behaviour (see below) and the presence of millisecond X-ray pulsations (Papitto et al. 2013b), are all consistent with the properties of the so-called atoll sources (a sub-class of low-luminosity NS-LMXBs, Hasinger & van der Klis 1989) in the hard state (Linares 2009).

We present the main properties and spectral evolution of the thermonuclear burst detected with Swift-XRT in Table 2 and Figure 3, respectively. The burst spectra are well fitted with a simple absorbed blackbody model and show the unequivocal temperature drop (“cooling tail”) along the flux decay, which is consistent with a simple exponential decay with an e-folding time of 26.61.8 s. The count rate light curve shows a 10 s-long plateau near its maximum with a possible double-peak structure, both commonly seen in type I X-ray burst profiles. We do not find spectral evidence of photospheric radius expansion around the burst peak (e.g., Kuulkers et al. 2003), and the bolometric luminosity does not exceed 21038 erg s-1. The blackbody radii that we measure during the burst (without color/redshift corrections) are in the [5–10] km range, also typical of thermonuclear bursts from NSs.
| Peak time (of max. net rate) (UTC) | 22:15:42 |
| Rise time (25% to 90% of peak rate) (s) | 6.51.0 |
| Duration (until 10% of peak rate) (s) | 82.51.0 |
| Bolometric peak luminosity ( erg s-1) | 2.00.5 |
| Bolometric radiated energy ( erg) | 3.90.2 |
| Persistent LX (0.5–10 keV; erg s-1) | 3.30.1 |
The burst was detected about 10 d after the beginning of the outburst (Papitto et al. 2013a; Linares 2013), when the luminosity and inferred mass accretion rate () were a few percent of the Eddington limit (4% from the measured 0.5–10 keV luminosity of 3.3 erg s-1 and using =3). At this , close to the boundary between the pure He and mixed H/He ignition regimes, H is expected to burn stably and thus He ignition triggers the bursts (Bildsten 1998). The long decay timescale, together with the lack of radius expansion, suggest that the burst ignites in a mix of H and He (e.g., Galloway et al. 2008). The total radiated bolometric burst energy that we measure, 3.91039 erg, corresponds to an ignition depth of 9.6107 g cm-2 (assuming solar-abundance homogeneousy-distributed fuel releasing 4.4 MeV nucleon-1; e.g., Galloway et al. 2008), which can be reached when accreting at 4% of the Eddington rate in only 0.3 d. This crude estimate of the expected burst recurrence time suggests that more thermonuclear bursts occurred during the 2013 25d-long outburst, but given that Swift-XRT observed IGR J18245–2452 for a total accumulated exposure of 0.4d, it is not surprising that it only detected one thermonuclear burst.
3.2 Between outburst and quiescence
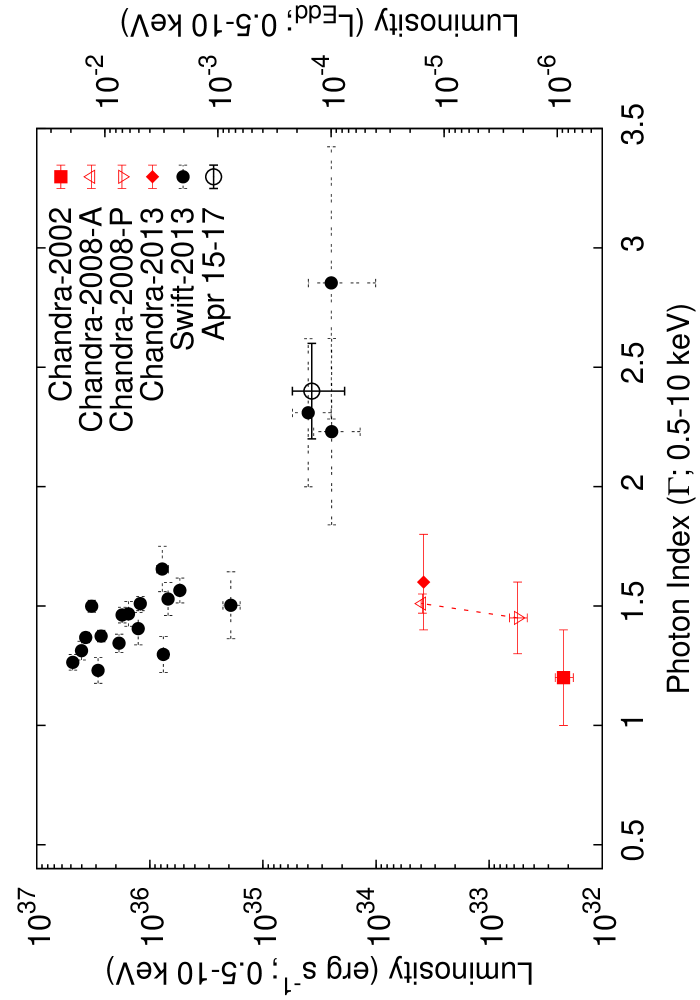
We find an anticorrelation between the persistent luminosity, LX, and the photon index, , measured by Swift during the outburst peak and decay when LX/LEdd decreased from 10-2 to 10-4. increases from 1.3 above LX/LEdd10-2 to 2.5 at LX/LEdd10-4. This softening during the decay to quiescence (already noticeable in Fig. 2, top two panels) can be clearly seen in Figure 4, where we plot LX vs. over five orders of magnitude in LX (note that special care was taken to avoid background contamination in the Swift spectra; Sec. 2.1). In order to test the significance of this anticorrelation, we calculate Spearman’s rank-order coefficient () using all (19) values of [LX, ] measured with Swift and find , which deviates from 0 at the 4.1 confidence level (the same test using only the brightest Swift-XRT data at LX1035 erg s-1 gives and a 2.8 significance). Such softening of the X-ray spectrum from (hard state) outburst to quiescence has been previously seen in both NS and BH transients (Wu & Gu 2008; Armas Padilla et al. 2011; Plotkin, Gallo & Jonker 2013, see discussion in Sec. 4.1).
The absorbing column densities during the 2013 outburst (NH=[3–5] cm-2 at LX1034erg s-1) are higher than those measured in quiescence by Chandra (Sec. 3.3, Table 1). This can be seen from our fits to the Swift persistent spectra (Figure 2), which yield an average NH=[4.00.1] cm-2, higher than the value of [2.60.2] cm-2 measured in the 2008 observations when the luminosity was LX=[0.6–4]1033 erg s-1. Fixing NH to the value found with Swift during outburst does not yield acceptable spectral fits to the Chandra 2008 quiescent spectrum (reduced increases from 1.0 to 1.3 for 248 dof). This result suggests that intrinsic changes in the absorbing material take place between outburst and quiescence, perhaps linked to the increased mass accretion rate during outburst, and cautions against the blind use of NH values measured in outburst for quiescent studies.
3.3 Variable quiescence
All Chandra spectra are well fitted with a simple absorbed power law model. We present in Table 1 the results of the spectral fits to the Chandra-ACIS quiescent spectra at different epochs, between 2002 and 2013. We show the resulting LX– relation in Figure 4, which covers the LX/LEdd[10-6–10-4] range, together with the Swift data at higher luminosities, LX/LEdd[10-4–10-2].
Our Chandra analysis shows that IGR J18245–2452 is a hard, purely non-thermal X-ray source in quiescence, with a 0.5–10 keV luminosity that varies by more than one order of magnitude, 2.51032 erg s-1 in 2002 and up to 3.81033 erg s-1 in 2008, while the photon index remained between 1 and 1.5. Soon after its 2013 outburst, during a Chandra observation taken on 2013-04-28 (Homan & Pooley 2013), we detected IGR J18245–2452 with the same luminosity (3.91033 erg s-1) and spectral index (1.5) as those measured in 2008 (during its active state, see below).
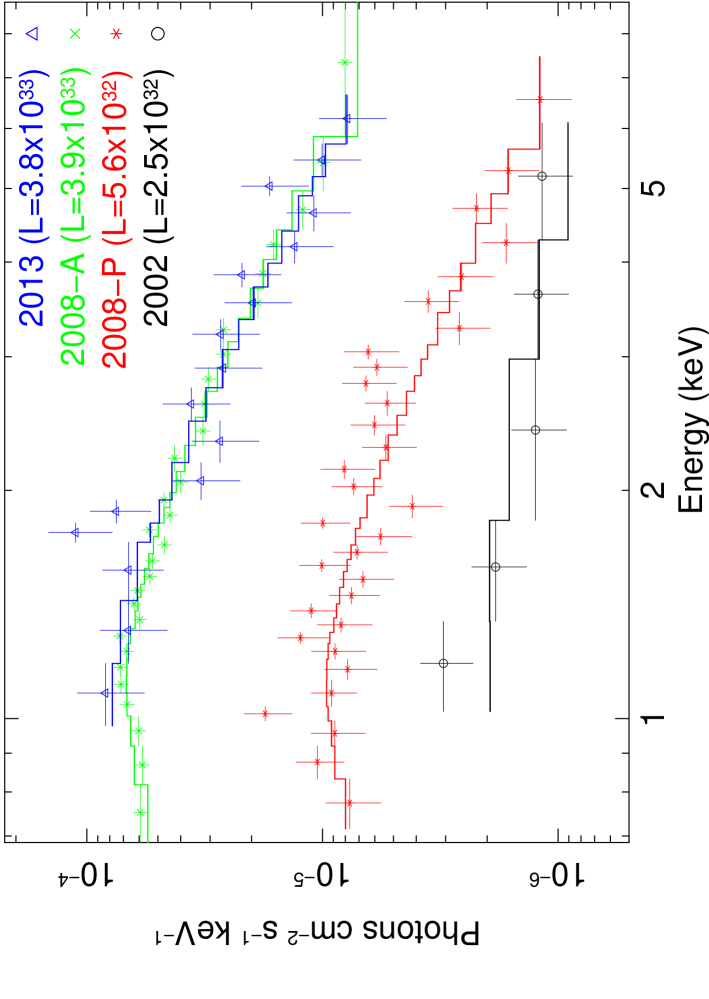
We show in Figure 5 a comparison between the unfolded quiescent spectra from IGR J18245–2452 at different epochs, to illustrate the large luminosity changes that take place with little or no change in the spectral shape. Given that all the spectra taken at luminosities below 1034 erg s-1 (LX/LEdd10-4), are harder than those measured by Swift in the latest stages of the outburst decay, we define quiescence as LX/LEdd10-4 (Figure 4). With this definition, and extrapolating the latest flux decay seen by Swift, we estimate that the outburst finished around 2013-04-22 (with an uncertainty of about 4 d) and lasted for 25 d, which implies that both 2013 Chandra observations (Homan & Pooley 2013; Papitto et al. 2013b) were taken when IGR J18245–2452 was in quiescence.
The most stringent limits on the thermal NS component come from the observations where IGR J18245–2452 is the faintest, taken in 2002. We extracted a spectrum from IGR J18245–2452 from the three 2002 ACIS-S observations combined (Sec. 2.2). The spectrum is well fitted with a simple absorbed power-law model, which yields a 0.5–10 keV luminosity of [2.50.8] erg s-1 (Table 1). In order to get upper limits on the NS temperature and luminosity in quiescence, we added a NS atmosphere component to the spectral model (NSATMOS, Heinke et al. 2006, assuming a 1.4 M⊙, 10 km NS with normalization fixed at 1 and a distance of 5.5 kpc). We then fitted the spectrum using chi-squared statistics (binning to 15 counts/bin, which left us with 6 bins) and using unbinned data and the C-statistic. We obtain consistent constraints from the two methods. We find upper limits (at 90% confidence) on the 0.1–10 keV (gravitationally redshifted) thermal quiescent luminosity erg s-1 and on the corresponding (intrinsic, redshift-corrected) NS surface effective temperature K.
The two public Chandra HRC-S observations (Sec. 2.2) show IGR J18245–2452 at slightly fainter levels than the 2002 ACIS observations. We find net source count rates of (7.50.9)10-4 c s-1 and (7.11.0)10-4 c s-1 in the November 2002 and May 2006 observations, respectively. Although these data provide no spectral information, we can estimate the quiescent luminosity assuming that the spectral shape is similar to that measured in the Chandra-ACIS observations. For NH=2.61021 cm-2 and in the range 1.0–1.5 we obtain LX=[1.1–2.1] erg s-1 during the 2002 and 2006 HRC observations.
Interestingly, comparing our Chandra and Swift results shows that the spectrum does not continue to soften at luminosities LX/LEdd10-4, but it hardens instead (Fig. 4). All four Chandra spectra (taken in 2002, 2008 and 2013) are consistent with 1.5 (a fit to a constant gives =2.7 for 3 d.o.f. and a Spearman rank test yields no significant correlation, although the sample is obviously small and fractional errors on are large). However, including the three lowest-LX Swift measurements (at LX/LEdd10-4) yields and a positive correlation with a 3 significance. This strongly suggests that the X-ray spectrum hardens while reaching deep quiescence (LX/LEdd=10-410-6), after softening in the hard state during the outburst decay (LX/LEdd=10-210-4, see Sec. 3.2). More frequent and sensitive observations of the decay to quiescence may allow a better measurement of this spectral transition between outburst and quiescence. We tentatively place the luminosity at which this transition occurs at LX/LEdd10-4 (see Figure 4).
The 2008 quiescent Chandra-ACIS light curves show striking variability on several time scales (see Figure 6). We find two clearly distinguishable states or “modes” in the light curve, at two distinct average count rates, and rapid changes between them (within less than 500 s). We identify a low luminosity passive state and a high luminosity active state during quiescence, below and above a Chandra-ACIS 0.5–8 keV count rate of 0.03 c s, respectively (dashed purple line in Figure 6). These are most clearly visible in the 144 ksec-long observation taken on 2008-08-07 (observation 9132; Fig. 6, left), but also three days later in the 55 ksec-long observation taken on 2008-08-10 (observation 9133; Fig. 6, right). Even though it was taken when LX was similar to the 2008 active state (Table 1), the 2013 Chandra light curve does not show rapid intensity changes. However, we cannot rule out the presence of mode switching during that observation, as the exposure time was shorter (15 ksec) and the count rate was lower (1.20.410-2 c s-1) than those in the 2008 observation.
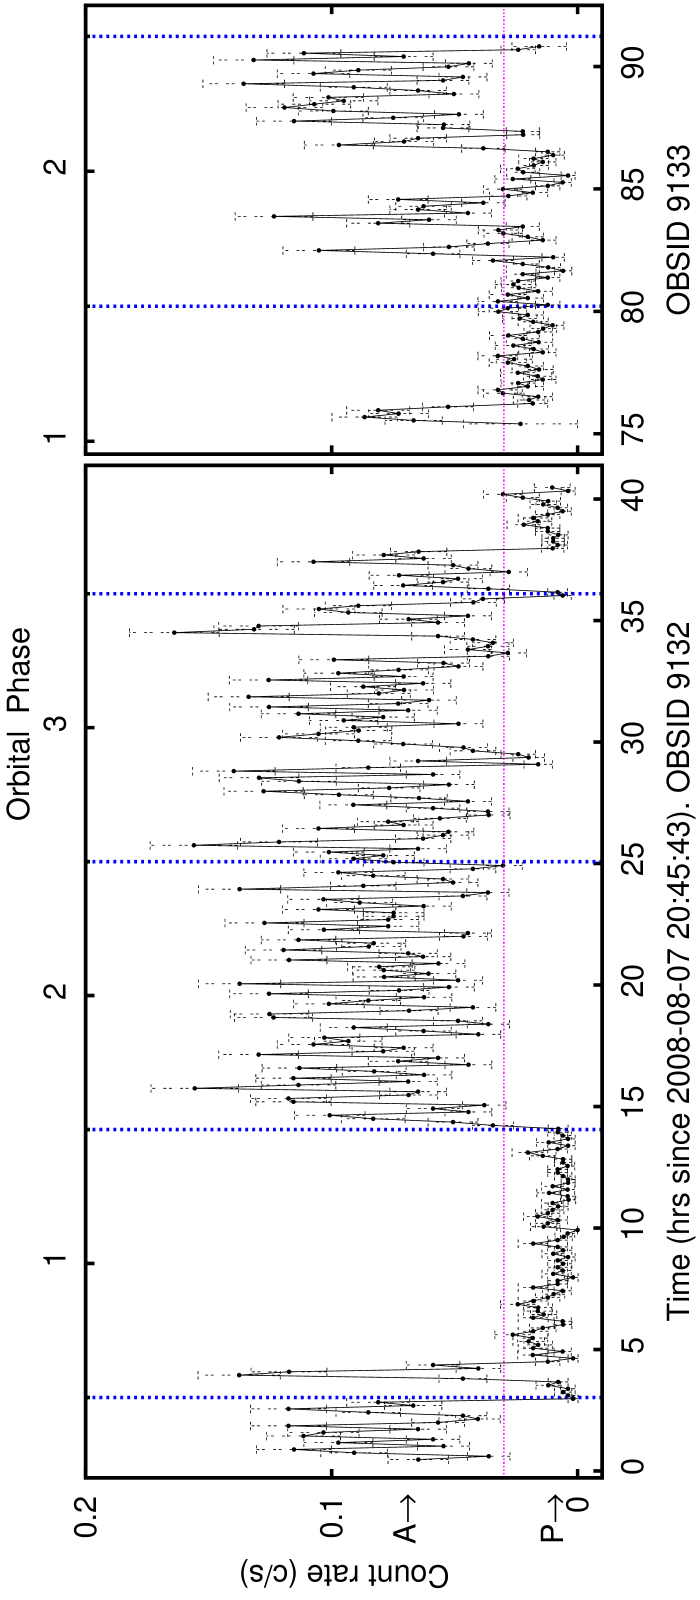
After 9 ksec in the active state since the beginning of observation 9132, the source switched to the passive state for about 3 ksec and after a short (2.5 ksec) re-flare to the active state, it stayed in the passive state for another 35 ksec (Fig. 6, top). Then IGR J18245–2452 switched back to the active state for 85 ksec, with a few short (1 ksec) drops in count rate suggestive of short excursions to the passive state. For the last 9.5 ksec the source stayed in the passive state. Three days later, observation 9133 starts with a 2.5 ksec flare to the active state, then after 38 ksec of passive state with two more short (about 2 and 4 ksec-long) flares the source switches back to the active state for about 27 skec, and switches back to the passive state at the end of the observation. We also find rapid (500–1000 s) and less pronounced (factor 2–3 changes in count rate) variability in the light curves of both the active and passive states.
The hardness ratio (defined as the ratio of counts in the 2–8 keV and 0.5–2 keV bands, and calculated in 2 ksec bins) is consistent with being constant during both 2008 observations. We extracted spectra of the active and passive states, using the above definition and the same procedures explained in Sec. 2.2. Both are well-fit with an absorbed power-law model, and the best-fit and in the active and passive states are fully consistent (see Table 1). In order to search for small spectral variations, we repeated the fits to the active and passive state spectra keeping linked or fixed to its average value, and again found values consistent within the reduced (1–5%) fractional errors. We measure a 0.5–10 keV luminosity of 3.9 erg s-1 and 5.6 erg s-1 for the active and passive state, respectively. Thus when the source switches between active and passive quiescent states the luminosity changes by a factor of 7 with no detectable change in the spectrum. Figure 5 shows the active and passive state spectra, as well as the other quiescent spectra of IGR J18245–2452 measured with Chandra in 2002 and 2013.
It is perhaps worth noting that the first passive state begins and ends at orbital phase 0.5 (first two vertical lines in Fig. 6, from orbital ephemerids reported by Papitto et al. 2013b), i.e., when the NS is at the descending node (approaching most rapidly). Even though one of the short dips later in that observation also occurs at orbital phase 0.5, the variability pattern does not recurr and in general the source switches between active and passive states at different orbital phases.
4 Discussion
4.1 Underluminous accretion flows and softening to quiescence
We found that when IGR J18245–2452’s luminosity decayed from LX/LEdd10-2 to LX/LEdd10-4 the Swift-XRT (0.5–10 keV) spectrum could be described by a simple power-law, and the photon index increased from 1.3 at the highest luminosities to 2.5 at the lowest luminosities (Section 3.2). Similar softening has been seen before in other systems, both NS (Armas Padilla et al. 2011; Degenaar, Wijnands & Miller 2013) and BH (Wu & Gu 2008; Sobolewska et al. 2011; Plotkin, Gallo & Jonker 2013) transients, and it appears to be a general observable of LMXBs in the hard state when they transit to quiescence. In the context of advection dominated (radiatively inefficient) accretion flows (ADAFs; Narayan & Yi 1995), this behavior can be explained by a change in the optical depth for Compton up-scattering: as decreases, the optical depth of the ADAF and the fraction of hard/up-scattered photons decrease, causing a softening of the X-ray spectrum (Esin, McClintock & Narayan 1997, predict a change in of 1.5 2.2 due to this effect). Other physical jet-based interpretations for this softening towards quiescence exist, which assume that X-ray emission from the jet dominates in quiescence (see, e.g., discussion in Sec. 4.2 of Plotkin, Gallo & Jonker 2013, and references therein).
In the case of accreting NSs the interpretation of the observed X-ray spectra at low luminosities should also consider potential thermal surface emission, coming from either low-level accretion onto the NS or from the crust heated up during outburst. Indeed, a thermal component has been found in X-ray spectra of NS-LMXBs at a luminosity of a few times 1034 erg s-1, in both transient (Degenaar, Wijnands & Miller 2013) and persistent accretors (Armas Padilla, Degenaar & Wijnands 2013). It is unclear at which luminosity and in which systems this component becomes important, and therefore we cannot assess whether or not it contributes to the softening of NS-LMXBs when they decay from LX/LEdd10-2 to LX/LEdd10-4. The lowest luminosity Swift-XRT spectra of IGR J18245–2452, at LX41034 erg s-1, do not show evidence of a thermal component and allow only weak constraints on the presence of such component. We derive a 90% upper limit on the thermal fraction of 24% (defined as the fractional contribution of a blackbody component to the 0.5–10 keV luminosity). This upper limit is derived assuming a temperature of 0.3 keV, like that measured by Armas Padilla, Degenaar & Wijnands (2013) at similar LX, and is compatible with the range of values found by the same authors in other NS-LMXBs (8–53%).
The deep Chandra observations allow us to place stringent constraints on the presence of a thermal component at lower luminosities, which correspond to a thermal fraction lower than 3% at LX2.51032 erg s-1 (Secs. 3.3 & 4.2). We thus conclude that if an undetected thermal component is responsible for the spectral softening in the decay to quiescence observed with Swift (Sec. 3.2), then this component should virtually disappear when the luminosity drops below 1034 erg s-1. This in turn suggests that such thermal component would be accretion-powered rather than crustal-heat-powered, and that the accretion flow is able to reach the NS surface and produce thermal emission down to LX/LEdd10-4 (see also Armas Padilla, Degenaar & Wijnands 2013). We note, however, that for dipole magnetic fields of 108 G accretion onto the NS surface at such low luminosities may be halted by the propeller mechanism (Illarionov & Sunyaev 1975; Campana et al. 1998).
4.2 Active and non-thermal quiescence
We have shown that in quiescence, which we define as LX/LEdd10-4 (Sec. 3.3), the new NS X-ray transient in M28 IGR J18245–2452 is fully dominated by a hard power-law spectral component, with a photon index of 1–1.5. By comparing Chandra-ACIS observations of M28 taken years apart (between 2002 and 2013), we have also shown that the quiescent 0.5–10 keV luminosity varies by more than an order of magnitude (between 2.51032 erg s-1 in 2002 and 3.81033 erg s-1 in 2008 and 2013). All these properties resemble the quiescent behavior of the NS X-ray transient EXO 1745-248 in the globular cluster Terzan 5 in great detail (Wijnands et al. 2005; Degenaar & Wijnands 2012). The reason for such large fluctuations in quiescence is not clear (see, e.g., Degenaar & Wijnands 2012, for an in-depth discussion). A possible explanation is that continued low-level accretion is occurring in the system, although if that were to reach the NS surface one would expect detectable thermal emission (e.g., Zampieri et al. 1995; Soria et al. 2011) instead of a purely non-thermal quiescent spectrum.
On the other hand, the similarities between the X-ray emission of some quiescent NS-LMXBs and MRPs (Bogdanov, Grindlay & van den Berg 2005) also apply to IGR J18245–2452. Namely, non-thermal and variable X-ray emission has also been seen in the NS-LMXBs Cen X-4 (Rutledge et al. 2001), Aql X-1 (Campana & Stella 2003), SAX J1808.4–3658 (Campana et al. 2002) and in the MRPs 47 Tuc W (Bogdanov, Grindlay & van den Berg 2005) and PSR J1023+0038 (Archibald et al. 2010).
We can compare the quiescent X-ray properties of IGR J18245–2452 and PSR J1023+0038 with some more detail, since these are the only two MRPs that have shown evidence for accretion. They share low-luminosity and remarkably hard quiescent spectra, with LX2.51032 erg s-1, 1.2 and LX9.41031 erg s-1, 1.26 for IGR J18245–2452 and PSR J1023+0038, respectively. Archibald et al. (2010) reported a marginal detection of a thermal component in PSR J1023+0038, contributing with 6% of LX. Our upper limit on a blackbody component at the lowest LX (3%, Sec. 3.3) rules out the presence of a similar component in IGR J18245–2452. The same authors found modulations of the X-ray flux from PSR J1023+0038 at the orbital (4.8 hr) and spin (1.7 ms) periods. The data presented herein do not allow a search for ms X-ray pulsations at low LX, due to insufficient time resolution. The long-term variability that we find during the 2008 observations is more rich than that found in PSR J1023+0038, and it does not seem to be related with the binary orbit (Secs. 3.3 & 4.3).
No thermal component is detected at the lowest luminosities (Sec. 3.3), corresponding to an upper limit on the bolometric intrinsic thermal luminosity of 1.3 erg s-1 (for a gravitational redshift of 1.3). We can compare this to estimates of the incandescent thermal emission produced by deep crustal heating (Haensel & Zdunik 1990, 2008; Brown, Bildsten & Rutledge 1998; Degenaar, Wijnands & Miller 2013), which should yield a luminosity , where we take 2 MeV as the total heat deposited per accreted nucleon, is the long-term average mass accretion rate onto the NS, and the atomic mass unit. We estimate an average g s-1 in the 2013 outburst from our measured Swift-XRT luminosities (Sec. 3.1; using =3 and assuming accretion onto a 1.4M⊙-mass 10 km-radius NS). For a 25 d outburst duration, this implies an outburst recurrence time longer than 20 yr in order to produce a luminosity lower than our upper limit. Alternatively, enhanced neutrino cooling may be acting to reduce the NS core temperature in IGR J18245–2452 down to the observed levels ( K, Sec. 3.3), as reported in other NS transients (see, e.g., Heinke et al. 2007; Wijnands, Degenaar & Page 2013). Given that IGR J18245–2452 is active as a rotation-powered pulsar when it is not accreting (as the MRP PSR J1824–2452I; Papitto et al. 2013b), we can compare the upper limit on its thermal luminosity with the typical thermal emission from other MRPs. According to most pulsar models, the polar caps can be heated up by relativistic particles generated when the radio pulsar is on, producing thermal pulsed X-ray emission (e.g., Zavlin 2007). Thermal luminosities measured in MRPs are typically in the range 1030–1031 erg s-1, which is compatible with our upper limit of 7 erg s-1.
When the non-thermal power-law spectral component in quiescent NS-LMXBs is detected and well constrained, the photon index is similarly low, between 1 and 1.5 (we note that the error bars are relatively large). Our results for IGR J18245–2452 are consistent with these typical NS values, which seem to show harder quiescent spectra than black hole (BH) systems, most of which have a photon index of 2 in quiescence (Corbel, Tomsick & Kaaret 2006; Plotkin, Gallo & Jonker 2013). Thus, while we find evidence for a spectral hardening below LX/LEdd10-4 (with the photon index reaching 1–1.5; Sec. 3.3), in BH transients seems to saturate below LX/LEdd10-5 at a value close to 2 (Plotkin, Gallo & Jonker 2013). This suggests that different processes cause the quiescent power-law component in NS and BH X-ray binaries. For BHs this emission is likely due to some form of radiatively inefficient accretion flow but it is possible that in the case of NSs another process is at work. Two emission mechanisms have been proposed for the non-thermal X-rays from NS-LMXBs in quiescence, in order of increasing luminosity: i) an intrabinary shock between the pulsar wind and the flow of mass transferred/outflowing from the companion star (originally proposed for MRPs, Arons & Tavani 1993; Campana et al. 1998); and ii) accretion onto the NS magnetosphere, or magnetospheric accretion (Campana et al. 1998).
4.3 At the boundary between accretion- and rotation-powered X-rays?
We found striking variability in the 2008 Chandra observations of IGR J18245–2452 (Sec. 3.3): sharp transitions between two distinct (active and passive) modes, namely, recurrent, large (factor 7) and rapid (500 s) changes in LX, in the [0.6–3.9] erg s-1 range. The detected emission was purely non-thermal and the spectra of the active and passive states were consistent within the errors (photon index 1.5 and no detectable change in absorption; Table 1). Campana, Stella & Kennea (2008) found that the AMP SAX J1808.4–3658 seems to switch between two states when approaching quiescence. Those states were apparent only in the long-term (100 d long) Swift light curve, they showed clear spectral variability and a smaller change in luminosity (LX=[1.5–5] erg s-1 and =[1.7–2.7]). It seems therefore unlikely that they have the same origin as the active and passive states that we report herein. The mode switching that we observe in IGR J18245–2452, on the other hand, might be reminiscent of the correlated X-ray/radio mode switches recently found by Hermsen et al. (2013) in the old isolated pulsar PSR B0943+10. The latter pulsar is obviously not accreting, and the onset of accretion in IGR J18245–2452, confirmed at least at high X-ray luminosities, suggests that the accretion flow plays a role in the state changes presented in this work, and thus that the physical mechanisms responsible for mode switches in these two pulsars are different.
Three of the transitions coincide with orbital phase 0.5 (NS at descending node) but this is not always the case, and in general mode switching occurs at different orbital phases. Changes in absorption due to matter in different regions of the binary system crossing the line of sight would leave an imprint in the spectrum which we do not observe, and hence cannot explain the mode changes. Intrabinary shock emission is expected (Arons & Tavani 1993) and possibly observed in MRPs (Stappers et al. 2003; Bogdanov, Grindlay & van den Berg 2005) to be modulated at the orbital period. Mildly relativistic speeds in the shocked region can lead to Doppler boosted emission and to orbital modulation of the measured non-thermal X-rays. In the case of IGR J18245–2452, however, the large amplitude and aperiodic nature of the observed variability do not support a scenario where the mode switching is due to Doppler boosting in the line of sight changing along the orbit.
The available data thus suggest that stochastic changes between two different non-thermal emission processes (which produce very similar spectra) are taking place. One possible explanation is that the observed variability reflects rapid transitions between magnetospheric accretion at high luminosities (3.9 erg s-1) and intrabinary shock emission at low luminosities (5.6 erg s-1). In this scenario, the magnetospheric radius rm during the 2008 Chandra observations would be close to the light cylinder radius (rlc186 km for the 254 Hz spin frequency; Papitto et al. 2013b), and fluctuations in the mass accretion rate would produce the observed transitions. A small drop in would cause rm to expand beyond rlc, which would turn on the radio pulsar and create an intrabinary shock responsible for the emission in the passive state. An increase in could bring rm back inside the light cylinder, turning off the radio pulsar and allowing for magnetospheric accretion to take over in the active state. We stress that this scenario involves a balance between the pulsar wind and the inner accretion flow, likely in the form of a hot optically thin flow given the extremely low LX, and that an optically thick accretion disk may still be present at much larger radii (rrlc) (see, e.g., Wang et al. 2009).
The active and passive states of IGR J18245–2452 correspond to bolometric luminosities (Lbol) 1.21034 erg s-1 and 1.71033 erg s-1, respectively (using again =3; Sec. 2). Assuming a typical neutron star mass of 1.4 and radius of 10 km, the magnetospheric radius for spherically symmetric accretion can be expressed as (Lamb, Pethick & Pines 1973; Patruno et al. 2009):
| (1) |
Thus for a value of the magnetic field of G (typical of all AMPs with a measured B field; see, e.g., Table 4 in Patruno & Watts 2012), the magnetospheric radius will move from about 130 km during the active state up to about 230 km during the passive state. Given that the light cylinder radius km, the magnetosphere will become devoid of material up to the light cylinder as the accretion rate drops from the active to the passive state. This in turn might activate the radio pulsar mechanism and turn on the radio pulsar during the passive states. A higher value of the B field, above G, would instead give for the observed luminosities during the active state. This therefore suggests that, if this interpretation of the active/passive states is correct, the B field of IGR J18245–2452 is similar to that of other AMPs.
A clear prediction of this simple picture is that the radio pulsar should be on during the passive state and off during the active state. Simultaneous high-time-resolution X-ray and radio observations in quiescence are thus highly desirable, in order to test this prediction and shed more light onto IGR J18245–2452’s unique properties. Measurements of the magnetic field and spin-down rate of PSR J1824–2452I will constrain the pulsar wind energy and may allow a quantitave estimate of the intrabinary shock properties (e.g., Bogdanov, Grindlay & van den Berg 2005).
Our proposed scenario implies that non-thermal magnetospheric emission can be quickly (within less than eight minutes) and repeatedly (more than ten times in three days) quenched and reactivated, and that the intrabinary shock may form on similar timescales. Based on the morphology of the X-ray light curves from the MRP PSR J1023+0038, Bogdanov et al. (2011a) concluded that the intrabinary shock is localized near or at the surface of the companion star, close to the inner Lagrangian point. For IGR J18245-2452, the intra-binary shock during the passive state is probably much closer to the pulsar, where the pulsar wind runs into the inner boundary of the accretion disk (given the remarkably short time scales of switching between the passive and active states, it is unlikely that the wind blows most of the disk away and then irradiates the companion). Eventually, the pulsar wind might sweep the disk away leaving the system in a long-term “deep quiescence” state that resembles the other so-called “redback” radio MSP binaries. This is probably the state IGR J18245-2452 was in during the 2002 and 2006 Chandra observations.
Acknowledgments:
ML thanks M. Kachelrieß and the Norwegian U. of Science and Technology for their hospitality while part of this work was completed, and J. Casares and M. Roberts for stimulating discussions. RW is supported by an European Research Council starting grant. AP aknowledges support from the Netherlands Organization for Scientific Research(NWO) Vidi fellowship DA acknowledges support from the Royal Society. JH and DP acknowledge support by the National Aeronautics and Space Administration through Chandra Award Number GO3-14032B issued by the Chandra X-ray Observatory Center, which is operated by the Smithsonian Astrophysical Observatory for and on behalf of the National Aeronautics Space Administration under contract NAS8-03060. This research has made use of data and software provided by the High Energy Astrophysics Science Archive Research Center (HEASARC). The scientific results reported in this article are based in part on observations made by the Chandra X-ray Observatory and data obtained from the Chandra Data Archive. This work used Swift Gamma-ray Burst Explorer target-of-opportunity observations (PIs Ferrigno, Romano).
References
- Alpar et al. (1982) Alpar M. A., Cheng A. F., Ruderman M. A., Shaham J., 1982, Nature, 300, 728
- Archibald et al. (2010) Archibald A. M., Kaspi V. M., Bogdanov S., Hessels J. W. T., Stairs I. H., Ransom S. M., McLaughlin M. A., 2010, ApJ, 722, 88
- Archibald et al. (2009) Archibald A. M. et al., 2009, Science, 324, 1411
- Armas Padilla et al. (2011) Armas Padilla M., Degenaar N., Patruno A., Russell D. M., Linares M., Maccarone T. J., Homan J., Wijnands R., 2011, MNRAS, 417, 659
- Armas Padilla, Degenaar & Wijnands (2013) Armas Padilla M., Degenaar N., Wijnands R., 2013, MNRAS
- Arnaud (1996) Arnaud K. A., 1996, in Astronomical Society of the Pacific Conference Series, Vol. 101, Astronomical Data Analysis Software and Systems V, Jacoby G. H., Barnes J., eds., pp. 17–+
- Arons & Tavani (1993) Arons J., Tavani M., 1993, ApJ, 403, 249
- Backer et al. (1982) Backer D. C., Kulkarni S. R., Heiles C., Davis M. M., Goss W. M., 1982, Nature, 300, 615
- Bahramian et al. (2013) Bahramian et al., 2013, Submitted to ApJ
- Barthelmy et al. (2013) Barthelmy S. D., Burrows D. N., D’Elia V., Holland S. T., Kennea J. A., Markwardt C. B., Marshall F. E., Palmer D. M., 2013, GRB Coordinates Network, 14355, 1
- Becker et al. (2003) Becker W. et al., 2003, ApJ, 594, 798
- Begin (2006) Begin S., 2006, Master’s thesis, Faculty of Physics, UBC
- Bildsten (1998) Bildsten L., 1998, in NATO ASIC Proc. 515: The Many Faces of Neutron Stars., R. Buccheri, J. van Paradijs, & A. Alpar, ed., pp. 419–+
- Bogdanov et al. (2011a) Bogdanov S., Archibald A. M., Hessels J. W. T., Kaspi V. M., Lorimer D., McLaughlin M. A., Ransom S. M., Stairs I. H., 2011a, ApJ, 742, 97
- Bogdanov, Grindlay & van den Berg (2005) Bogdanov S., Grindlay J. E., van den Berg M., 2005, ApJ, 630, 1029
- Bogdanov et al. (2011b) Bogdanov S. et al., 2011b, ApJ, 730, 81
- Brown, Bildsten & Rutledge (1998) Brown E. F., Bildsten L., Rutledge R. E., 1998, ApJL, 504, L95
- Burderi et al. (2003) Burderi L., Di Salvo T., D’Antona F., Robba N. R., Testa V., 2003, A&A, 404, L43
- Campana et al. (1998) Campana S., Colpi M., Mereghetti S., Stella L., Tavani M., 1998, A&ARv, 8, 279
- Campana & Stella (2003) Campana S., Stella L., 2003, ApJ, 597, 474
- Campana et al. (2002) Campana S. et al., 2002, ApJL, 575, L15
- Campana, Stella & Kennea (2008) Campana S., Stella L., Kennea J. A., 2008, ApJL, 684, L99
- Clark (1975) Clark G. W., 1975, ApJL, 199, L143
- Cohn et al. (2013) Cohn H. N., Lugger P. M., Bogdanov S., Heinke C. O., Van Den Berg M., Sivakoff G., 2013, The Astronomer’s Telegram, 5031, 1
- Corbel, Tomsick & Kaaret (2006) Corbel S., Tomsick J. A., Kaaret P., 2006, ApJ, 636, 971
- Degenaar & Wijnands (2012) Degenaar N., Wijnands R., 2012, MNRAS, 422, 581
- Degenaar, Wijnands & Miller (2013) Degenaar N., Wijnands R., Miller J. M., 2013, ApJL, 767, L31
- Eckert et al. (2013) Eckert D. et al., 2013, The Astronomer’s Telegram, 4925, 1
- Esin, McClintock & Narayan (1997) Esin A. A., McClintock J. E., Narayan R., 1997, ApJ, 489, 865
- Fruscione et al. (2006) Fruscione A. et al., 2006, in Society of Photo-Optical Instrumentation Engineers (SPIE) Conference Series, Vol. 6270, Society of Photo-Optical Instrumentation Engineers (SPIE) Conference Series
- Galloway et al. (2008) Galloway D. K., Muno M. P., Hartman J. M., Psaltis D., Chakrabarty D., 2008, ApJS, 179, 360
- Gotthelf & Kulkarni (1997) Gotthelf E. V., Kulkarni S. R., 1997, ApJL, 490, L161
- Haensel & Zdunik (1990) Haensel P., Zdunik J. L., 1990, A&A, 227, 431
- Haensel & Zdunik (2008) Haensel P., Zdunik J. L., 2008, A&A, 480, 459
- Harris (1996) Harris W. E., 1996, AJ, 112, 1487
- Hasinger & van der Klis (1989) Hasinger G., van der Klis M., 1989, A&A, 225, 79
- Heinke et al. (2013) Heinke C. O., Bahramian A., Wijnands R., Altamirano D., 2013, The Astronomer’s Telegram, 4927, 1
- Heinke, Grindlay & Edmonds (2005) Heinke C. O., Grindlay J. E., Edmonds P. D., 2005, ApJ, 622, 556
- Heinke et al. (2007) Heinke C. O., Jonker P. G., Wijnands R., Taam R. E., 2007, ApJ, 660, 1424
- Heinke et al. (2006) Heinke C. O., Wijnands R., Cohn H. N., Lugger P. M., Grindlay J. E., Pooley D., Lewin W. H. G., 2006, ApJ, 651, 1098
- Hermsen et al. (2013) Hermsen W. et al., 2013, Science, 339, 436
- Homan & Pooley (2013) Homan J., Pooley D., 2013, The Astronomer’s Telegram, 5086, 1
- Illarionov & Sunyaev (1975) Illarionov A. F., Sunyaev R. A., 1975, A&A, 39, 185
- in’t Zand, Jonker & Markwardt (2007) in’t Zand J. J. M., Jonker P. G., Markwardt C. B., 2007, A&A, 465, 953
- Kuulkers et al. (2003) Kuulkers E., den Hartog P. R., in’t Zand J. J. M., Verbunt F. W. M., Harris W. E., Cocchi M., 2003, A&A, 399, 663
- Lamb, Pethick & Pines (1973) Lamb F. K., Pethick C. J., Pines D., 1973, ApJ, 184, 271
- Linares (2009) Linares M., 2009, PhD thesis, Sterrenkundig Instituut ”Anton Pannekoek - University of Amsterdam
- Linares (2013) Linares M., 2013, The Astronomer’s Telegram, 4960, 1
- Narayan & Yi (1995) Narayan R., Yi I., 1995, ApJ, 452, 710
- Pallanca et al. (2013) Pallanca C., Dalessandro E., Ferraro R. F., Lanzoni B., Beccari G., 2013, The Astronomer’s Telegram, 5003, 1
- Papitto et al. (2013a) Papitto A., Bozzo E., Ferrigno C., Pavan L., Romano P., Campana S., 2013a, The Astronomer’s Telegram, 4959, 1
- Papitto et al. (2013b) Papitto A. et al., 2013b, Nature, 501, 517
- Papitto et al. (2013c) Papitto A. et al., 2013c, The Astronomer’s Telegram, 5069, 1
- Patruno (2013) Patruno A., 2013, The Astronomer’s Telegram, 5068, 1
- Patruno & Watts (2012) Patruno A., Watts A. L., 2012, ArXiv e-prints 1206.2727
- Patruno et al. (2009) Patruno A., Watts A. L., Klein-Wolt M., Wijnands R., van der Klis M., 2009, ApJ, submitted; ArXiv 0904.0560
- Pavan et al. (2013) Pavan L. et al., 2013, The Astronomer’s Telegram, 4981, 1
- Plotkin, Gallo & Jonker (2013) Plotkin R. M., Gallo E., Jonker P. G., 2013, ArXiv e-prints
- Pooley et al. (2003) Pooley D. et al., 2003, ApJL, 591, L131
- Riggio et al. (2013) Riggio A. et al., 2013, The Astronomer’s Telegram, 5086, 1
- Romano et al. (2013) Romano P. et al., 2013, The Astronomer’s Telegram, 4929, 1
- Rutledge et al. (2000) Rutledge R. E., Bildsten L., Brown E. F., Pavlov G. G., Zavlin V. E., 2000, ApJ, 529, 985
- Rutledge et al. (2001) Rutledge R. E., Bildsten L., Brown E. F., Pavlov G. G., Zavlin V. E., 2001, ApJ, 551, 921
- Rutledge et al. (2002) Rutledge R. E., Bildsten L., Brown E. F., Pavlov G. G., Zavlin V. E., Ushomirsky G., 2002, ApJ, 580, 413
- Servillat et al. (2012) Servillat M., Heinke C. O., Ho W. C. G., Grindlay J. E., Hong J., van den Berg M., Bogdanov S., 2012, MNRAS, 423, 1556
- Sobolewska et al. (2011) Sobolewska M. A., Papadakis I. E., Done C., Malzac J., 2011, MNRAS, 417, 280
- Soria et al. (2011) Soria R., Zampieri L., Zane S., Wu K., 2011, MNRAS, 410, 1886
- Stappers et al. (2003) Stappers B. W., Gaensler B. M., Kaspi V. M., van der Klis M., Lewin W. H. G., 2003, Science, 299, 1372
- Testa et al. (2001) Testa V., Corsi C. E., Andreuzzi G., Iannicola G., Marconi G., Piersimoni A. M., Buonanno R., 2001, AJ, 121, 916
- Tsujimoto et al. (2011) Tsujimoto M. et al., 2011, A&A, 525, A25
- Wang et al. (2009) Wang Z., Archibald A. M., Thorstensen J. R., Kaspi V. M., Lorimer D. R., Stairs I., Ransom S. M., 2009, ApJ, 703, 2017
- Wijnands, Degenaar & Page (2013) Wijnands R., Degenaar N., Page D., 2013, MNRAS, 432, 2366
- Wijnands et al. (2005) Wijnands R., Heinke C. O., Pooley D., Edmonds P. D., Lewin W. H. G., Grindlay J. E., Jonker P. G., Miller J. M., 2005, ApJ, 618, 883
- Wijnands & van der Klis (1998) Wijnands R., van der Klis M., 1998, Nature, 394, 344
- Wu & Gu (2008) Wu Q., Gu M., 2008, ApJ, 682, 212
- Zampieri et al. (1995) Zampieri L., Turolla R., Zane S., Treves A., 1995, ApJ, 439, 849
- Zavlin (2007) Zavlin V. E., 2007, ApSS, 308, 297