SMALL-SCALE LOCAL PHENOMENA RELATED TO THE MAGNETIC RECONNECTION AND TURBULENCE IN THE PROXIMITY OF THE HELIOPAUSE
Abstract
We study processes related to magnetic reconnection and plasma turbulence occurring in the presence of the heliopause (HP) and the heliospheric current sheet. It is shown that the interaction of plasmoids initiated by magnetic reconnection may provide connections between the inner and outer heliosheath and lead to an exchange of particles between the interstellar medium and the solar wind plasma shocked at the heliospheric termination shock. The magnetic reconnection may also cause plasma density and magnetic field compressions in the proximity of the HP. We argue that these phenomena could possibly be detected by the Voyager spacecraft approaching and crossing the HP. These results could clarify the concepts of the ”magnetic highway” and the ”heliosheath depletion region” recently proposed to explain recent Voyager 1 observations.
Subject headings:
interplanetary medium – magnetic reconnection – solar wind – Sun: heliosphere – turbulence1. Introduction
The interaction of the solar wind (SW) and the local interstellar medium (LISM) leads to the formation of a cavity in the ambient interstellar medium called the heliosphere. These two interacting plasma flows are separated by the heliopause (HP), located between a termination shock (TS) in the SW and possibly a bow shock (BS) in the LISM. The region between the TS and HP is called the inner heliosheath (IHS), whereas the outer heliosheath (OHS) is a region, where a significant modification of the LISM flow occurs (if the BS exists the OHS is defined as being located between the HP and BS).
The Voyager 1 and Voyager 2 spacecrafts (V1 and V2 hereafter) crossed the TS in 2004 December at 94 AU and 2007 August at 84 AU from the Sun, respectively (Stone et al., 2005; Burlaga et al., 2005; Stone et al., 2008; Burlaga et al., 2008). Both spacecrafts provided magnetic field measurements, but velocity components of the bulk flow, density and temperature measurements are available from the plasma experiment for V2 only. For V1 the plasma experiment has not been in operation since 1981, but the flow velocity components can be estimated indirectly from convective anisotropies of angular distributions of low-energy ions in the heliosheath (Decker et al., 2005, 2007). Recent measurements by V1 suggest that, at a distance of 113.5 AU from the Sun the spacecraft entered a region, where the radial component of the plasma velocity is negative on average and no mean meridional flow is observed; the region was identified as a “transition layer” (Krimigis et al., 2011; Decker et al., 2012). Magnetic field measurements from V1 are generally consistent with the velocity estimations, but the zone was called a “stagnation region” as it is part of the IHS rather than the transition layer related to the HP (Burlaga & Ness, 2012). Very recently, the V1 spacecraft observed two partial depletions in anomalous cosmic ray (ACR) fluxes, which then decreased to instrumental background at 122 AU from the Sun (Krimigis et al., 2013). Hereafter, we will refer to the two partial depletions in ACRs (days 210–214 and 226–233 of 2012) as the “precursors” and the subsequent decrease (day 238 of 2012) as the “ACR boundary”. The variations in ACRs were anticorrelated with changes in the galactic cosmic rays (GCR) fluxes that significantly increased at this time (Webber & McDonald, 2013; Krimigis et al., 2013; Stone et al., 2013). The ACR boundary and its precursors were also associated with sudden increases in the magnetic pressure (Burlaga et al., 2013). To interpret the recent V1 measurements, the concepts of the ”magnetic highway” and the ”heliosheath depletion region” were proposed to describe regions of depletion of particles of heliospheric origin associated with excess of GCRs and magnetic pressure enhancements (Burlaga et al., 2013; Stone et al., 2013). In view of the recent V1 observations, detailed understanding of the dynamics of the plasma and the energetic particles in the vicinity of the HP has become a very timely problem.
One may expect that magnetic topology changes caused by the magnetic reconnection at the HP could be responsible for providing magnetic connections between the IHS and OHS (Fahr et al., 1986; Swisdak et al., 2010). In this Letter we test this hypothesis by numerical simulations of local phenomena in the vicinity of the HP, additionally including in the model physical features that are known to likely appear in the IHS: plasma turbulence and possible occurrence of the heliospheric current sheet (HCS). Most of the simulations of the reconnection phenomena close to the HP were based on the particle-in-cell (PIC) approach and described regions of very small spatial size of the order of hundreds of AU, where is the ion inertial length (Drake et al., 2010; Swisdak et al., 2010, 2013). We calculate the time evolution of the plasma parameters and the magnetic field in much larger areas (of linear size 2–20 AU), which implies a magnetohydrodynamical (MHD) approach. No scaling procedure (similar to that for PIC simulations) is required to interpret our results, but obviously our approach provides no insight into small-scale structures on ion inertial length scales. Our discussion is focused on typical phenomena that could be observed by the Voyager spacecraft.
2. Model
The numerical code solves MHD equations in two-dimensional geometry. Resistive and viscous effects are not included explicitly but result from small numerical diffusion of the applied high-resolution MUSCL scheme (Kurganov & Tadmor, 2000). To ensure a divergence-free magnetic field a flux constrained (staggered mesh) approach was implemented (Balsara & Spicer, 1999). Neutral particles background is not included in our model since phenomena related to the interaction of plasma and neutrals are typically associated with much larger spatial scales. A schematic view of the initial setup for the simulations is shown in Figure 1.

Open boundary conditions are applied in both the - and -directions. The resolution of the simulation grid is 5120512 points, AU and AU. Density and magnetic field in the simulation are normalized to their averages in the IHS, and . Velocity is normalized to the Alfvén speed in the IHS. Since the length unit is interpreted as AU, the time unit is AU/. Estimations discussed below indicate a rather large value of the Alfvén speed 100 km s-1 in the IHS, which gives the simulation time unit 17.5 days.
Using typical recent estimations of plasma parameters in the OHS (consistently with, e.g. McComas et al. (2012)): plasma density cm-3, magnetic field strength nT, plasma temperature K, we can compute the ratio of the kinetic and magnetic energy density, which gives . As reported by Burlaga et al. (2013), V1 observed a relative increase of the magnetic field strength by a factor of 2 across the ACR boundary and its precursors. Assuming a magnetic jump at the HP, the total (thermal+magnetic) pressure equilibrium condition gives used in the initial condition in our simulations. One should note that is consistent with values considered by Swisdak et al. (2010) as resulting from global modeling of the heliosphere. Recent measurements of plasma density in the IHS by V2 give cm-3 (Richardson & Wang, 2012), thus the density jump was applied at the simulated HP located at =1.5 AU in the simulation box (1.5 AU in the initial condition corresponds to the IHS region).
The IHS presumably contains regions of uniform polarity separated by regions, where the HCS foldings are closely stacked and magnetic polarity reversals occur frequently (Czechowski et al., 2010). The most recent Voyager 1 measurements obtained deep in the IHS show well separated crossings of the HCS rather than regions of frequently changing polarity (Burlaga & Ness, 2012; Burlaga et al., 2013). As reported by Burlaga et al. (2013), the V1 spacecraft observed a magnetic field reversal (similar to those identified previously as the HCS crossings) that occurred about 30 days before the ACR boundary. This time interval corresponds to AU, provided that the observed configuration was time stationary. To model possible HCS encounters, a Harris-sheet structure is introduced at AU and AU to simulate magnetic field reversals. Magnetic field reversal is also initially arranged at the HP, thus the magnetic reconnection sites are expected to appear at both the HP and HCS. Antiparallel configuration of the magnetic field is set up at both the HP and HCS.
Our simulations are of two types. In the first type of simulation (S1 hereafter) we locally impose small-amplitude random perturbations on plasma pressure in a confined region of the simulation box. A locally increased level of noise is supposed to accelerate the growth of the tearing instability and the development of reconnection sites in a limited area. In the second type of simulation (S2), a turbulent flow is initiated by randomized large-amplitude () fluctuations of the velocity vector components. These fluctuations are injected in the initial condition in a confined region of the simulation box. The wavenumbers of the velocity perturbations correspond to the largest possible spatial scales in the simulation (from 0.5 to 2 AU). The dynamics of the system are then responsible for the development of the magnetic field fluctuations and the transfer of energy to smaller scales through the turbulent cascade mechanism. This type of simulation is motivated by observations of the IHS by the Voyager spacecraft that indicate a significant level of plasma turbulence (Burlaga & Ness, 2012). For both noise- and large-eddies-initiated simulations of magnetic reconnection the initial perturbations are applied in the region AU and AU and are initially separated from the simulated HP and boundaries of the simulation box. Note that the presence of turbulence in the IHS and the much smaller intensity of fluctuations behind the ACR boundary is consistent with recent V1 observations (Burlaga et al., 2013). The localized character of perturbations considered in our study corresponds to the local enhancements of turbulence intensity in the IHS. Moreover in the case of HP, effects related to large-scale curvature of magnetic field lines can make the shear angle to approach 180∘, but only in a confined region, while suppressing reconnection at other locations (characterized by a smaller shear angle) due to diamagnetic drifts of the x-line (Swisdak et al., 2010). Except for the randomized fluctuations described above, no other mean flow in the simulation box is imposed.
3. Development of reconnection sites and plasmoids
Figure 2 shows the power spectrum of the fluctuations of

the magnetic field component for averaged over the region of initial injection of large eddies (S2 simulation case). One can see that a turbulent cascade develops quickly and that magnetic fluctuations are excited. The spectrum obtained in the inertial range is of Iroshnikov–Kraichnan type (Biskamp, 2003).


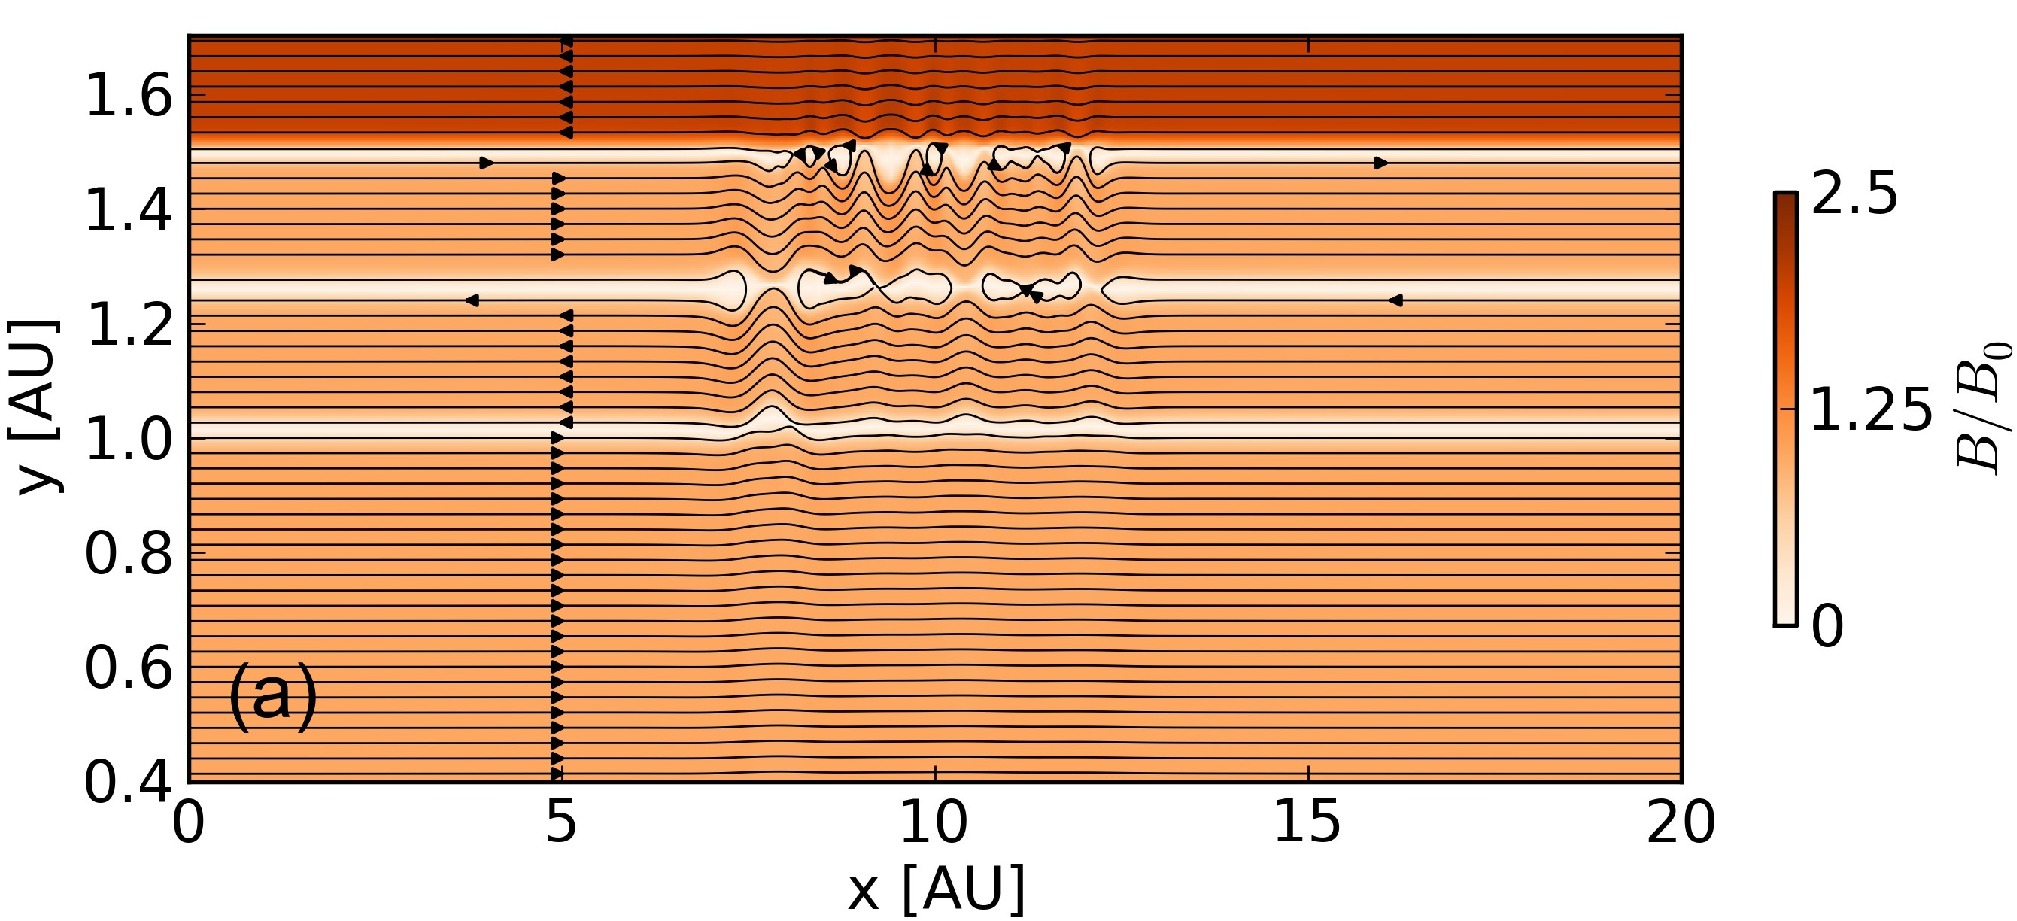
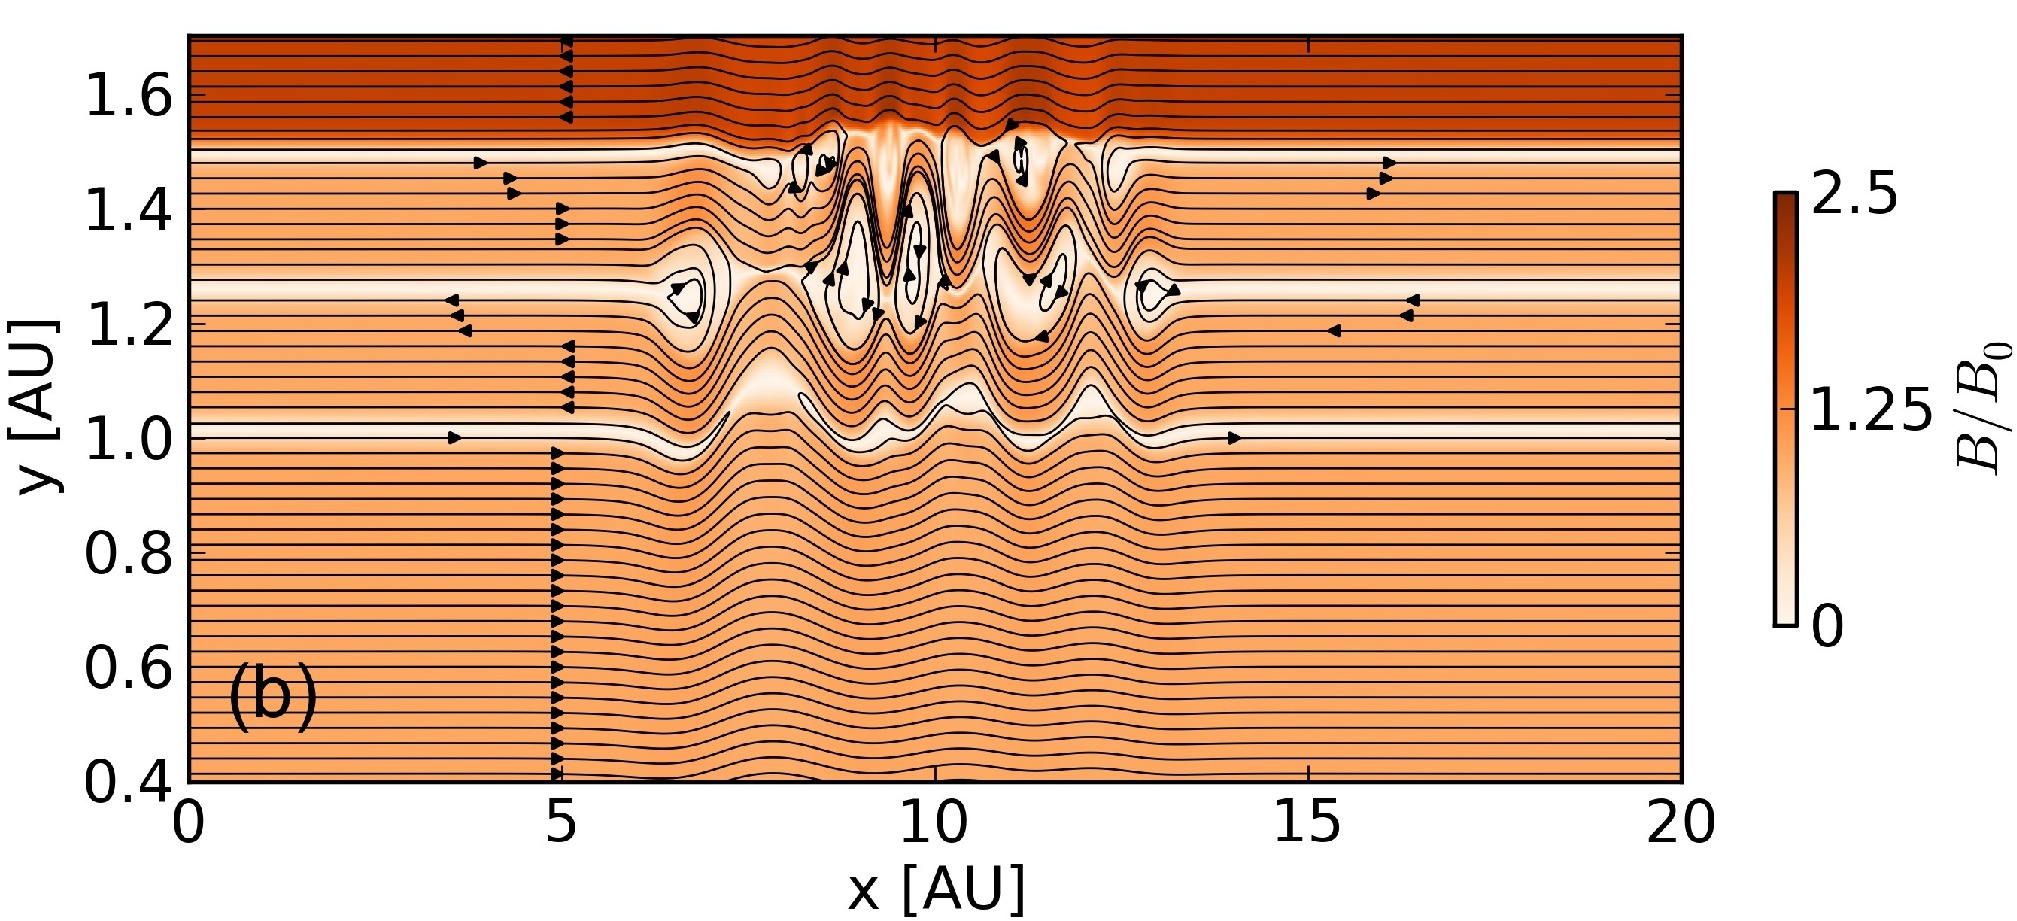
Figure 3 shows the early stage of the time evolution of the magnetic field strength and the magnetic field lines in the S1 simulation. For (see Figure 3(a)), reconnection sites appeared due to the tearing instability mainly at the HP ( AU) and one of the HCS ( AU) located closer to the HP. Topological changes result in closed magnetic field lines that indicate the emergence of plasmoids that have just begun to grow. Later, for (see Figure 3(b)), expanded plasmoids initiated at different discontinuities are large enough to start to interact, which results in magnetic compressions in the regions between interacting plasmoids. Note that the aspect ratio of Figure 3 was altered (elongated in the direction) to emphasize the details. Besides the effects in the neighborhood of the reconnection sites, the solution at the moments of time illustrated in Figure 3 remains laminar, similar to the initial state. Besides the closed magnetic field lines mentioned above, the reconnection leads to the appearance of lines that originate and end at the same boundary in the -direction. In the case of the HP these lines connect the laminar regions in the IHS with those of the OHS, providing a possibility of effective transport of higher energy particles between the two regions.
4. Magnetic connectivity between IHS and OHS
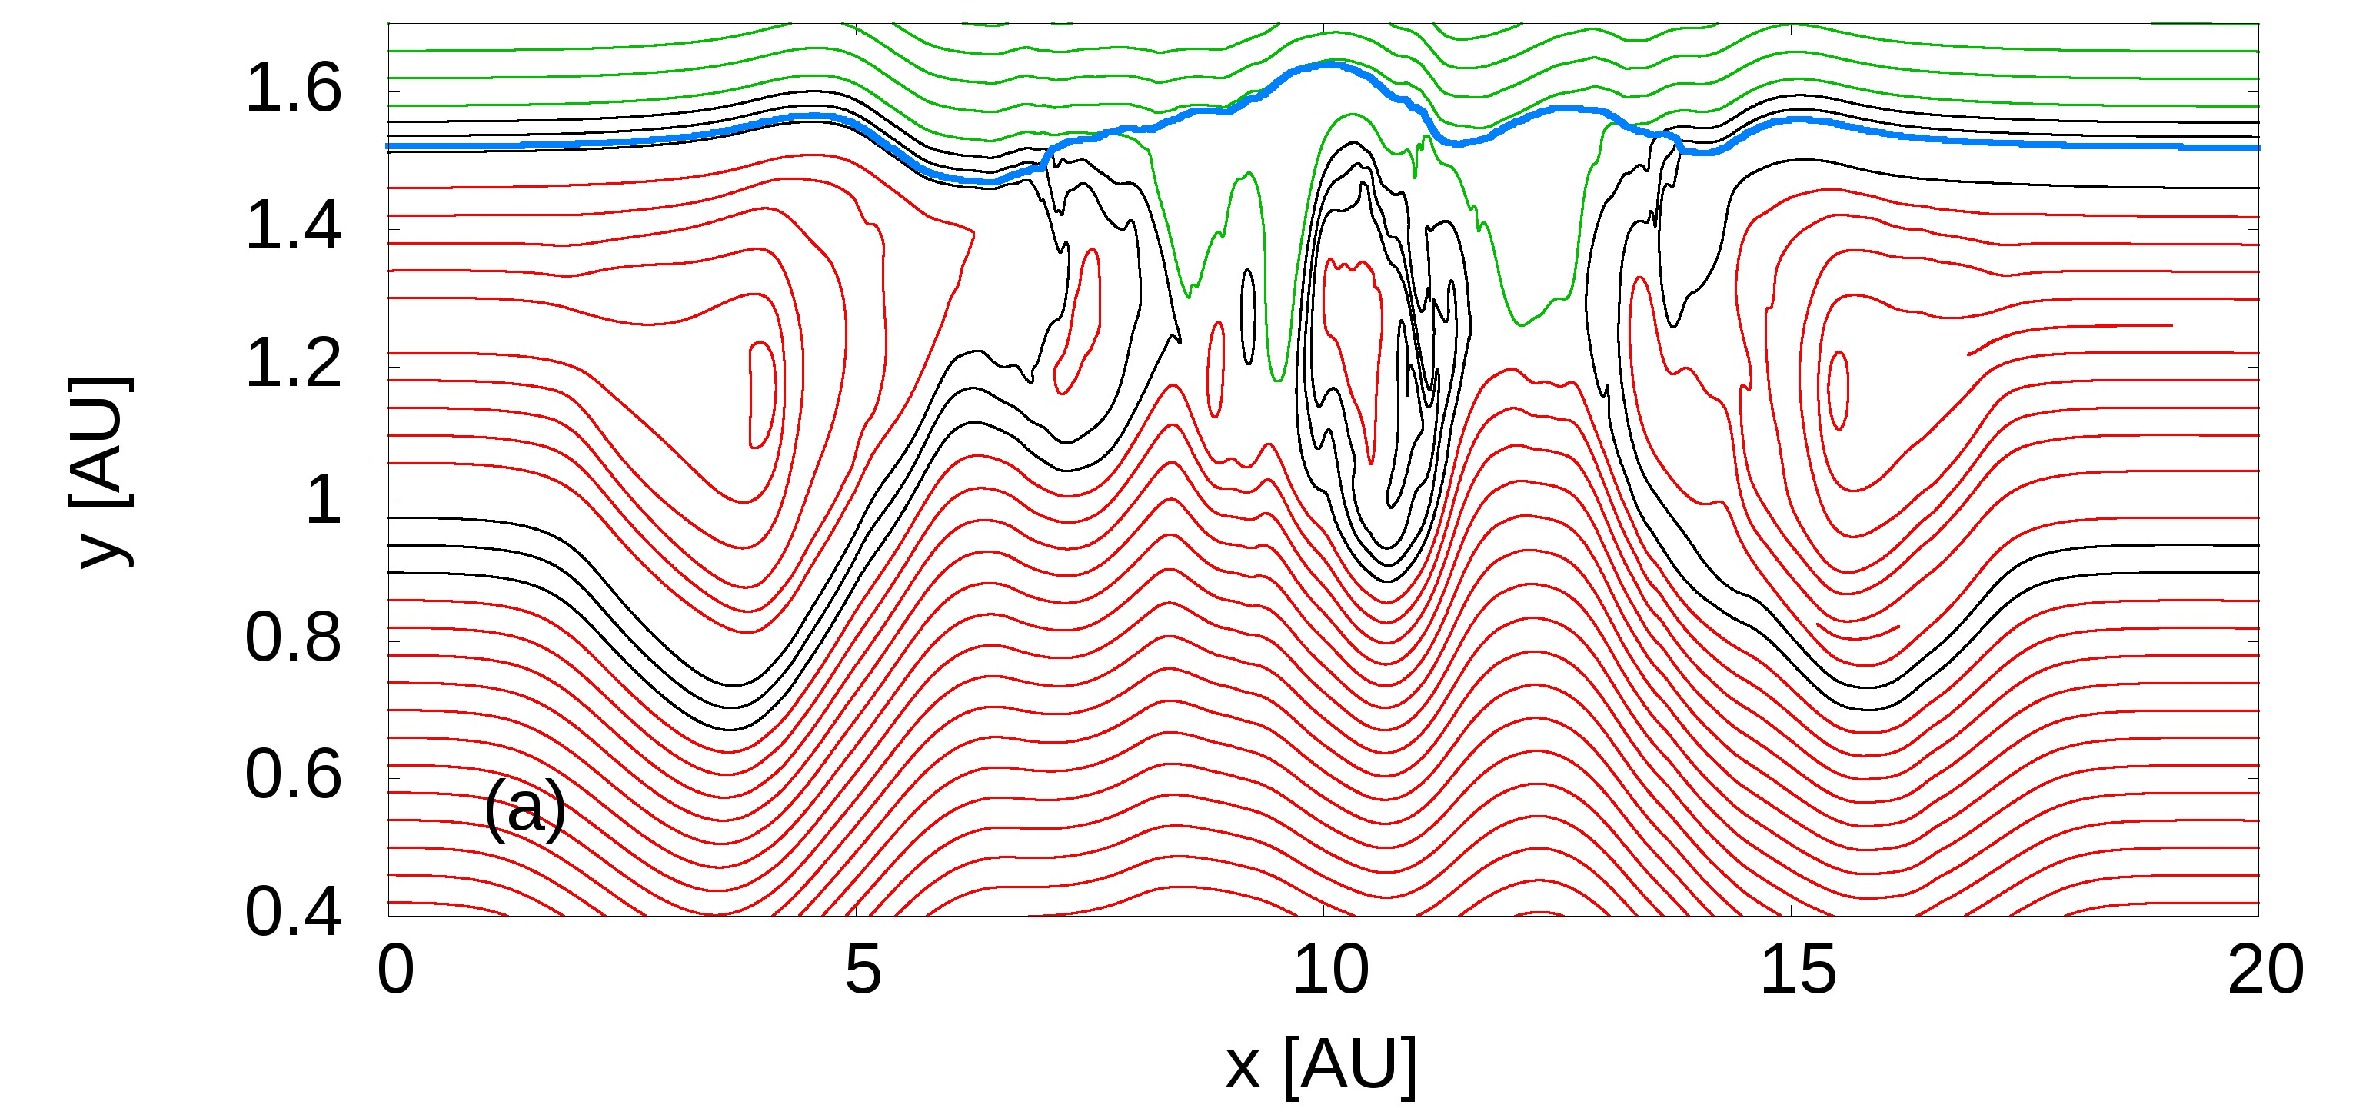
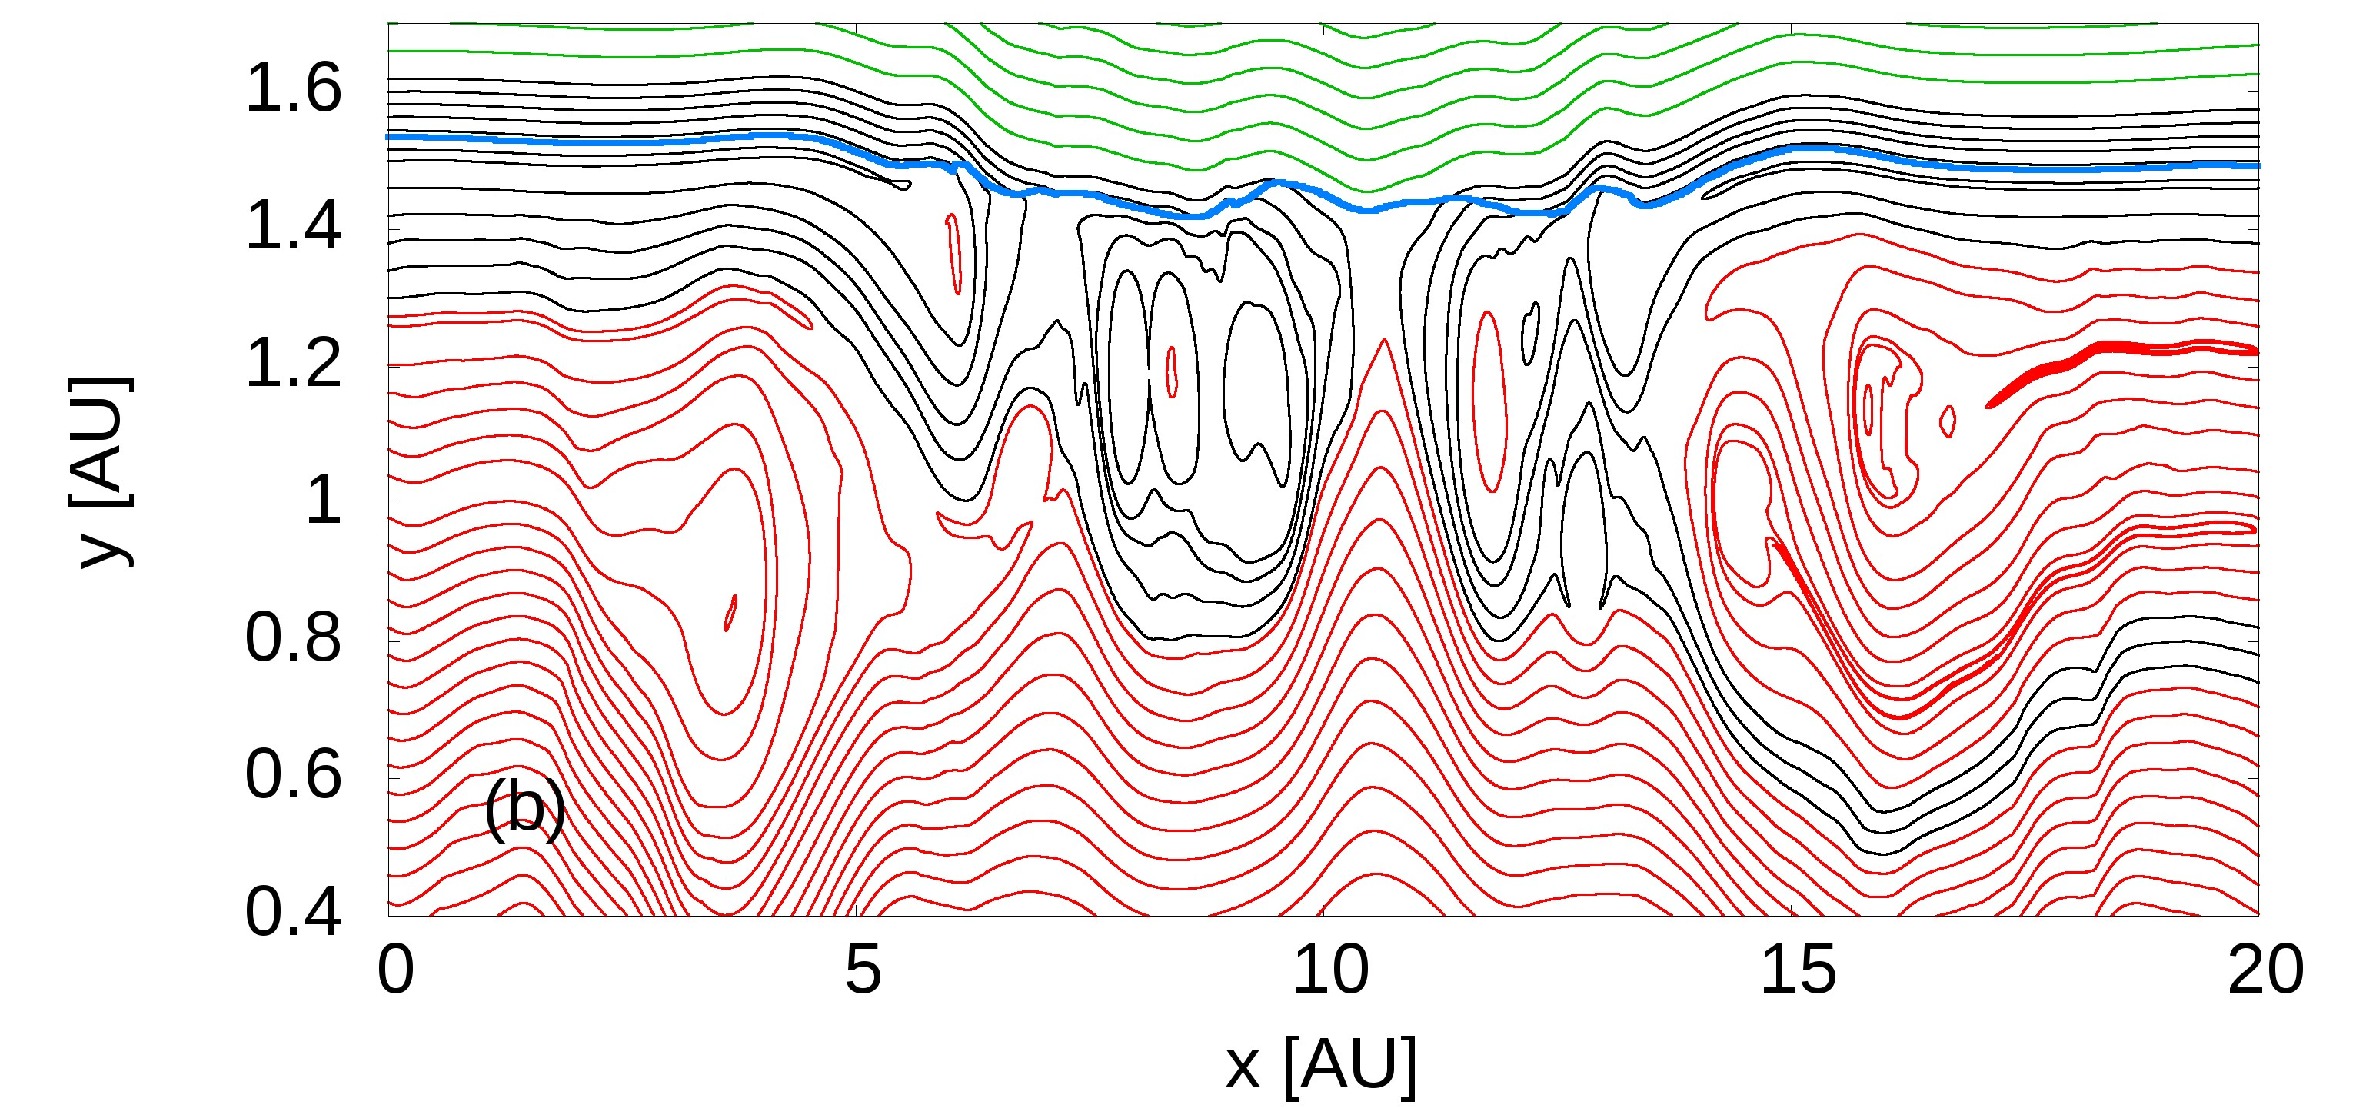
The emergence of magnetic connections between the IHS and OHS is a novel feature revealed by our simulations that could be important in the context of recent observations of the V1 spacecraft. Figure 4 shows the magnetic field lines classified according to their connectivity properties.


Different colors are used depending on whether a given line belongs to the IHS, OHS or connects the two regions. For the magnetic field lines that originate and end at the boundaries, the classification is based on the density value at the boundaries. For closed loops, the plasma density values along the line are used for classification. The results for the S1 type of simulation for a later moment in time are shown in Figure 4(a). One can see that the laminar regions in the right and left part of the simulation box shrank significantly in comparison with Figure 3. If we regard the jump in the magnetic field intensity (shown by the blue line in Figure 4) as indicating the HP position in the non-laminar flow, the black lines in Figure 4 can be seen to link the IHS with the OHS. The black lines form bunches that can penetrate quite deeply into the IHS. Particles streaming along the magnetic field lines are therefore free to move between the IHS and OHS. A probe moving through the IHS would therefore likely observe the regions of increased fluxes of external-origin energetic particles associated with decreased fluxes of heliospheric-origin energetic particles. These regions would be embedded in normal IHS medium and could be observed in the IHS quite far from the location of the HP. Regions filled by a given class of magnetic field lines shown in Figure 4 are often intertwined with regions filled by other classes. The probe may therefore observe a series of precursors along its trajectory from the IHS to OHS. The bunches of black lines in Figure 4 have typical size of AU in the IHS, which is similar to the size of two precursors observed by the V1 spacecraft (Webber & McDonald, 2013; Burlaga et al., 2013; Krimigis et al., 2013; Stone et al., 2013). The results of S2 simulation (large-eddies initiated) shown in Figure 4(b) are qualitatively consistent with the results of the S1 simulation (small-amplitude noise initially) shown in Figure 4(a). This shows the robustness and presumably universal character of the scenario observed in the simulations, since in the S2 case reconnection sites have grown in the presence of turbulence, which is indeed observed in the IHS.
In Figure 5 we show profiles of the magnetic field strength, density and angle along the line AU for obtained in S1 simulation. The angle describes here the orientation of the magnetic field vector with respect to the -axis of the simulation frame, similar to the angle used conventionally in presenting Voyager spacecraft measurements, where the angle describes deviation of the magnetic field vector from the radial (R) direction in the radial-tangential (RT) plane of the RTN frame (see e.g. Burlaga & Ness (2012) and references therein). The second angle describing the deviation of the magnetic field vector from the RT plane (or – plane in calculations) is zero in our simulations due to a purely two-dimensional configuration assumed in the initial condition.

One can see significant compressions of the density and changes in the magnetic field strength. The values of the angle remain in the proximity of 90∘ or 270∘, except for the region where a single reversal of magnetic polarity occurs. It is worth noting that only one magnetic reversal occurs here, whereas three magnetic reversals were set up in the initial condition for the simulation. This suggests that the initial configuration of current sheets may change greatly over time, and the profiles observed by the spacecraft may be misleading when used to infer about the underlying dynamical processes. Note that the magnetic field reversal in Figure 5 is shifted with respect to the jump in the magnetic field strength, similar to recent V1 observations (Burlaga et al., 2013).
5. Conclusions
Our simulations clearly show that the concept of the HP as a well defined boundary separating the IHS and OHS is rather inadequate when the magnetic reconnection is likely to occur. Magnetic connections resulting from topological changes related to the magnetic reconnection may provide the possibility of transporting higher energy charged particles between the IHS and OHS. On the IHS side the bunches of magnetic field lines connected to the OHS could be met far ahead of the jump of the magnetic field strength that naively could be considered to be an indicator of the HP crossing. The size of the bunches obtained in our simulations is similar to the size of precursors of the ACR boundary observed by the V1 spacecraft. We expect that the simulation results presented in this Letter can be helpful in clarifying the concepts of the ”magnetic highway” and the ”heliosheath depletion region” recently proposed in the context of recent observations of the V1 spacecraft.
The results of our calculations are consistent with PIC simulations of the magnetic reconnection in the vicinity of the HP, where scaling arguments were used to link the simulations to V1 observations (Swisdak et al., 2013). Our calculations support the interpretation of the precursors and possibly also the ACR boundary in terms of crossing of a HP-associated non-laminar structure resulting from magnetic reconnection. Note that possible parallel (or antiparallel) configuration of the directions of the magnetic field in the IHS and OHS was considered in the context of interchanging instability causing the flux tubes from the OHS to penetrate the IHS region (Krimigis et al., 2013). Also, some results of the global modeling of the heliosphere suggest that this quasi-parallel configuration is likely to occur along the V1 trajectory (Swisdak et al., 2010, 2013).
Our simulations indicate that fluctuations related to the turbulent flow in the IHS region significantly hasten the magnetic reconnection at the HCS and HP. The simulation starting from small-amplitude noise (S1) takes 1.7 times longer to reach a developed state in comparison with the large-eddies-initiated simulation (S2). This effect is presumably related to local thinning of the HCS caused by turbulent fluctuations and can be important for the IHS region where turbulence is observed.
References
- Burlaga et al. (2008) Burlaga, L. F., Ness, N. F., Acuna, M. H., Lepping, R. P., Connerney, J. E. P., & Richardson, J. D. 2008, Nature, 454, 75
- Burlaga et al. (2005) Burlaga, L. F., Ness, N. F., Acuna, M. H., Lepping, R. P., Connerney, J. E. P., Stone, E. C., & McDonald, F. B. 2005, Science, 309, 2027
- Balsara & Spicer (1999) Balsara, D. S., & Spicer, D. S. 1999, J. Comp. Phys., 149, 270
- Biskamp (2003) Biskamp, D. 2003, Magnetohydrodynamic Turbulence (Cambridge: University Press, 2003)
- Burlaga & Ness (2012) Burlaga, L. F., & Ness, N. F. 2012, Astrophys. J., 749, 13
- Burlaga et al. (2013) Burlaga, L. F., Ness, N. F., & Stone, E. C. 2013, Science, 341, 147
- Czechowski et al. (2010) Czechowski, A., Strumik, M., Grygorczuk, J., Grzedzielski, S., Ratkiewicz, R., & Scherer, K. 2010, Astron. Astrophys., 516, A17+
- Decker et al. (2007) Decker, R. B., Krimigis, S. M., Roelof, E. C., & Hill, M. E. 2007, in American Institute of Physics Conference Series, Vol. 932, Turbulence and Nonlinear Processes in Astrophysical Plasmas, ed. D. Shaikh & G. P. Zank, 197–202
- Decker et al. (2012) Decker, R. B., Krimigis, S. M., Roelof, E. C., & Hill, M. E. 2012, Nature, 489, 124
- Decker et al. (2005) Decker, R. B., Krimigis, S. M., Roelof, E. C., Hill, M. E., Armstrong, T. P., Gloeckler, G., Hamilton, D. C., & Lanzerotti, L. J. 2005, Science, 309, 2020
- Drake et al. (2010) Drake, J. F., Opher, M., Swisdak, M., & Chamoun, J. N. 2010, Astrophys. J., 709, 963
- Fahr et al. (1986) Fahr, H. J., Neutsch, W., Grzedzielski, S., Macek, W., & Ratkiewicz-Landowska, R. 1986, Space Sci. Rev., 43, 329
- Krimigis et al. (2013) Krimigis, S. M., Decker, R. B., Roelof, E. C., Hill, M. E., Armstrong, T. P., Gloeckler, G., Hamilton, D. C., & Lanzerotti, L. J. 2013, Science, 341, 144
- Krimigis et al. (2011) Krimigis, S. M., Roelof, E. C., Decker, R. B., & Hill, M. E. 2011, Nature, 474, 359
- Kurganov & Tadmor (2000) Kurganov, A., & Tadmor, E. 2000, J. Comp. Phys., 160, 241
- McComas et al. (2012) McComas, D. J., et al. 2012, Science, 336, 1291
- Richardson & Wang (2012) Richardson, J. D., & Wang, C. 2012, Astrophys. J. Lett., 759, L19
- Stone et al. (2005) Stone, E. C., Cummings, A. C., McDonald, F. B., Heikkila, B. C., Lal, N., & Webber, W. R. 2005, Science, 309, 2017
- Stone et al. (2008) —. 2008, Nature, 454, 71
- Stone et al. (2013) Stone, E. C., Cummings, A. C., McDonald, F. B., Heikkila, B. C., Lal, N., & Webber, W. R. 2013, Science, 341, 150
- Swisdak et al. (2013) Swisdak, M., Drake, J. F., & Opher, M. 2013, ArXiv e-prints 1307.0850
- Swisdak et al. (2010) Swisdak, M., Opher, M., Drake, J. F., & Alouani Bibi, F. 2010, Astrophys. J., 710, 1769
- Webber & McDonald (2013) Webber, W. R., & McDonald, F. B. 2013, Geophys. Res. Lett., 40, 1665