NuSTAR and INTEGRAL observations of a low/hard state of 1E1740.7-2942
Abstract
The microquasar 1E1740.7-2942 (catalog ), also known as the “Great Annihilator”, was observed by NuSTAR in the Summer of 2012. We have analyzed in detail two observations taken weeks apart, for which we measure hard and smooth spectra typical of the low/hard state. A few weeks later the source flux declined significantly. Nearly simultaneous coverage by INTEGRAL is available from its Galactic Center monitoring campaign lasting months. These data probe the hard state spectrum from 1E1740.7-2942 (catalog ) before the flux decline. We find good agreement between the spectra taken with IBIS/ISGRI and NuSTAR, with the measurements being compatible with a change in flux with no spectral variability. We present a detailed analysis of the NuSTAR spectral and timing data and upper limits for reflection of the high energy emission. We show that the high energy spectrum of this X-ray binary is well described by thermal Comptonization.
Subject headings:
accretion, accretion disks — black hole physics — X-rays: binaries — X-rays: individual (1E 1740.7-2942)1. Introduction
The astrophysical source 1E1740.7-2942 (catalog ) is a known microquasar located near the Galactic Center (GC), at an angular distance of 50′ from SgrA∗. First discovered by Einstein/IPC (Hertz & Grindlay, 1984) in the soft X-rays, it is the most luminous persistent source above keV in the region (Sunyaev et al., 1991), and has extended radio lobes reaching distances of up to a few parsecs () from its core (Mirabel et al., 1992). The core radio emission is found to be variable, with radio flux and spectral slope changes that are correlated with the X-ray flux, as observed by GRANAT/SIGMA in the early 1990’s (Paul et al., 1991). SIGMA reported a burst of emission in soft -rays characterized by a broad hump in the keV band (Bouchet et al., 1991) and a further, more marginal episode of enhanced -ray emission (Churazov et al., 1993). It was then speculated that such transient events could be generated by the deceleration and interaction of positrons injected by the source into a molecular cloud (Bally & Leventhal, 1991; Mirabel et al., 1993). However, nearly simultaneous observations by CGRO, namely by OSSE (Jung et al., 1995) and BATSE (Smith et al., 1996), did not detect any transient emission and also, the high energy observations by INTEGRAL (Bouchet et al., 2009) and other satellites could not confirm the high energy feature reported by SIGMA.
Many aspects about the nature of 1E1740.7-2942 (catalog ) remain a mystery. A clear optical/IR counterpart for the companion star has not been detected so far, probably due to the source environment chacterized by a high concentration of dust and a large hydrogen column density ( cm-2). Therefore, its nature as a high mass or low mass object is not known, nor its distance and inclination. However, the high amount of absorption and its position near the GC favors a distance of kpc, and the presence of bipolar jets disfavors a face-on geometry for the accretion disk. Recently, Martì et al. (2010) reported a candidate companion consisting of a single near-infrared source with an apparent non-stellar morphology, localized at a position coincident with the source radio core.
Despite its brightness, so far there is no evidence for strong reprocessing from 1E1740.7-2942 (catalog ). The Suzaku data established the absence (or evidence of weakness) of a reflection component in the hard X-ray spectra and the weakness of the iron line (Reynolds & Miller, 2010; Nakashima et al., 2010).
There are remarkable similarities between the spectral and timing characteristics of 1E1740.7-2942 (catalog ) and those of black hole candidates (BHC) like Cyg X-1 (catalog ). For both sources, Kuznetsov et al. (1997) found a positive correlation between spectral hardness and hard X-ray luminosity for erg/s. Similarly, the 14 year-long RXTE monitoring observed a hysteresis effect relative to the hard state indicating an anticorrelation of the power law (PL) index with the derivative of the photon flux (i.e., the spectrum softens for decreasing flux). Smith et al. (2002) also reported that in a single RXTE pointing, the spectral index hardened dramatically while the total flux of photons remained unchanged. The RXTE monitoring data was also used to search for periodicities of 1E1740.7-2942 (catalog ) after filtering out the long-term variations. This resulted in the detection of a narrow signal at 12.7 days in the Lomb-Scargle periodogram. If this is the orbital period and if the binary system accretes by Roche-lobe overflow, the companion should be a red giant. A much longer periodicity of days has also been reported, possibly related to cyclic transitions between a flat and warped disk as observed in other luminous binaries like Cyg X-1 (catalog ) and LMC X-3 (catalog ) (Ogilvie & Dubus, 2001).
| Obs.id | Epoch | Revolution | Satellite | Start (UTC) | End (UTC) | Exposure Time (s) |
|---|---|---|---|---|---|---|
| 10002021001 | 1 | - | NuSTAR | 2012-07-19 23:36:07 | 2012-07-20 02:11:07 | 2172 |
| 10002023003 | 2 | - | NuSTAR | 2012-08-03 22:16:07 | 2012-08-04 01:06:07 | 6125 |
| 09200250033 | 3 | 1199 | INTEGRAL | 2012-08-08 10:16:45 | 2012-08-08 19:08:37 | 15861 |
| 09200010015 | 3 | 1200 | INTEGRAL | 2012-08-13 08:45:09 | 2012-08-13 12:56:12 | 9615 |
| 09200250007 | 3 | 1201 | INTEGRAL | 2012-08-14 03:00:31 | 2012-08-14 14:48:53 | 22472 |
| 09200010016 | 3 | 1202 | INTEGRAL | 2012-08-19 08:16:17 | 2012-08-19 12:31:43 | 10030 |
| 09200250003 | 3 | 1203 | INTEGRAL | 2012-08-21 21:33:04 | 2012-08-22 09:49:30 | 21614 |
| 09200010017 | 3 | 1204 | INTEGRAL | 2012-08-22 23:19:34 | 2012-08-23 03:15:31 | 8757 |
| 09200250004 | 3 | 1205 | INTEGRAL | 2012-08-25 19:16:27 | 2012-08-26 07:05:14 | 19728 |
| 09200010018 | 3 | 1206 | INTEGRAL | 2012-08-29 12:42:07 | 2012-08-29 16:36:44 | 8635 |
| 09200250008 | 3 | 1207 | INTEGRAL | 2012-08-31 18:47:36 | 2012-09-01 00:05:58 | 10219 |
The spectrum of 1E1740.7-2942 (catalog ) in the hard state is usually well fitted by a cutoff power-law (CPL) or Comptonization model such as comptt (Titarchuk, 1994; Hua & Titarchuk, 1995). Bouchet et al. (2009) reported the existence of a high energy excess dominating beyond keV, which is reminiscent of a similar component observed for Cyg X-1 (McConnell et al., 2002). Jourdain et al. (2012) presented a sensitive spectrum for Cyg X-1 up to a few hundred keV with the SPI instrument (Vedrenne et al., 2003) on board INTEGRAL (Winkler et al., 2003). They detected a high level of polarization for energies keV; polarized emission was also reported from the IBIS instrument (Laurent et al., 2011). These observations support a jet origin of the excess for Cyg X-1. The SPI observations of 1E1740.7-2942 (catalog ) are contaminated by the GC environment, especially at the lowest energies (E keV), due to the wide angular resolution of that instrument ( FWHM). The SPI spectrum measured by Bouchet et al. (2009) was obtained by subtracting the contaminating source spectra as measured by IBIS/ISGRI. Conversely, the IBIS instrument (Ubertini et al., 2003) allows unambiguous measurements from 20 keV up to a few hundred keV. Reynolds & Miller (2010) reported on two observations separated by about 700 days with Suzaku. In both cases, the source was observed after a transition to the hard state. Significant emission was detected up to 300 keV showing no spectral break. The spectra were consistent with a Comptonized corona with the high emission accounted for with a hard power law () and a significant contribution from an accretion disk with keV at soft X-ray energies. These authors reported that the accretion disc is not truncated at large radii, while residing close to the inner-most stable circular orbit (ISCO), i.e. . There is no significant detection of disc reflection in the Suzaku data while a weak, broad iron line was marginally found at keV. Simultaneous observations of 1E1740.7-2942 (catalog ) by RXTE and INTEGRAL/IBIS, obtained mostly when the source was in the hard state, were analyzed by Del Santo et al. (2005) who reported values of the reflection normalization in the range . We note that their analysis is so far the only claimed detection of reflection in this source.
The recently launched NuSTAR observatory (Harrison et al., 2013) is the ideal instrument for the study of the reprocessed components in the spectrum of 1E1740.7-2942 (catalog ), due its unprecedented broadband coverage from soft to hard X-rays. In this work, we use nearly simultaneous observations by NuSTAR and the IBIS/ISGRI instrument on board INTEGRAL. IBIS, with its wide FOV and good sensitivity near 100 keV, can be used to complement the NuSTAR energy coverage and better constrain the parameters of the Comptonization. For INTEGRAL we limited our analysis to the IBIS data and did not attempt to use data from either Jem-X (Lund et al., 2003) or SPI, mainly because Jem-X had a relatively short exposure time and the SPI data are seriously contaminated by other sources. We also searched for nearly simultaneous observations of 1E1740.7-2942 (catalog ) in the Swift/XRT archive, but only very short, off-axis exposures were available. We verified that the statistics are too low to discriminate between spectral models from these data.
In Section 2, we describe the observations; Section 3.1 deals with the spectral and timing analysis of the NuSTAR data while in Section 3.2 we present the IBIS/ISGRI spectrum and lightcurves. Section 3.3 reports on the joint NuSTAR/INTEGRAL spectrum. In Section 4, our results are compared to previous observations of 1E1740.7-2942 (catalog ), and finally our conclusions are presented in Section 5.
2. Observations
All our observations were taken from July to September 2012. Data from NuSTAR are available from two epochs in July-August 2012, spaced by about two weeks (see details in Table 1). The total exposure times were 2172s and 6125s, respectively. NuSTAR is the first X-ray satellite with multilayer hard X-ray optics and is operational in the energy range 3–79 keV (Harrison et al., 2013). The mission carries two telescopes with grazing incidence optics, each one focusing on separate detector modules at a distance of 10m, i.e. two detectors named Focal Plane Modules A and B (FPMA, FPMB). These CdZnTe detectors have a spatial resolution of 0.6mm and sample a total Field-Of-View (FOV) of . The telescope Point Spread Function (PSF) has an Full-Width-At-Half-Maximum with extended tails resulting in a Half-Power-Diameter of .
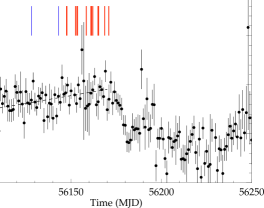
Shortly after the NuSTAR observations were completed, INTEGRAL began a GC monitoring campaign as part of its AO10 cycle. Furthermore, some of the Galactic Bulge Monitoring data were available. Due to the wide FOV ( Full-Width-At-Zero Response) of IBIS/ISGRI, 1E1740.7-2942 (catalog ) was monitored over quite a long period. Figure 1 shows the Swift/BAT light curve of 1E1740.7-2942 (catalog ) taken around the time of our observations. The source experienced a significant flux decline near MJD 56175 followed by a decrease of the accretion rate that was further monitored by INTEGRAL. For the purpose of this work, we selected data in a time period comprised between the first NuSTAR observation and the latest date available before the flux decline. This results in a time coverage spanning nine INTEGRAL orbits from 2012 August 8 to September 1 (revolutions 1199-1207). These observations consist of a series of pointings, selected for the source being at an offset from the IBIS instrument axis. Due to the high total flux of sources from the GC region, the sensitivity of IBIS is reduced particularly in the lowest energy channels.
The NuSTAR observations are not simultaneous with INTEGRAL and on the basis of the light curve shown in Figure 1, are expected to have a % lower flux. However, rate fluctuations up to % or more are observed at daily time scale. We distinguish three epochs consisting of the two NuSTAR observations and of the further INTEGRAL monitoring. Since 1E1740.7-2942 (catalog ) does not usually exhibit substantial spectral variations within such a small flux range, we model the data from both satellites simultaneously, allowing the cross-normalization to vary.
Note that the total NuSTAR observation time is much shorter than the INTEGRAL one. IBIS/ISGRI, being particularly sensitive in the keV spectral region, is expected to provide a good overlap of both data sets, allowing minimal possible bias in the spectral modeling.
3. Data Analysis
3.1. NuSTAR
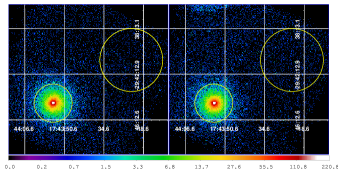
We analyzed the NuSTAR data using the NuSTAR Data Analysis Software (NuSTARDAS) version 1.1.1, CALDB version 20130509 and in-flight calibrated response matrices. The software applies offset correction factors to the energy response to account for the movement of the mast, causing a varying position of the focal spots on the detector planes. For the two FPMs the pipeline produces images, spectra and deadtime corrected lightcurves. For each NuSTAR observation, the source and background subtraction regions must be carefully evaluated due to the possible presence of contaminating sources outside the FOV. This straylight problem can be minimized prior to the observations by a tuning of the spacecraft position angle (PA) and if needed, of the optical axis position. In Figure 2 the images obtained for both FPMs are shown. The intensity is encoded in logarithmic scale, to emphasize underlying structures. The source net spectra were obtained by selecting counts in a circular region of radius centered on the source position and subtracting count rates measured in a background dominated region, also circular, of radius . The different area normalizations were taken into account in the background subtraction. Both regions are shown in the figure.
The total source count rates in the energy range 3–75 keV, in the selected spatial region
are: c/s (FPMA)
and c/s (FPMB) for epoch 1, and
c/s (FPMA) and c/s (FPMB) for epoch 2.
The ratio of the source-to-background rates varies with energy and is as high as
and 35 for the energy bands 3–10 keV and 10–40 keV, respectively.
We checked against possible systematic effects introduced by spatial variations
of the background rates. For the epoch 2 observation, we extracted a set of source
spectra in different annular regions of the detectors, far from the source,
and having the same size as the source region shown in Figure 2.
We found that the maximum
variation of the 3–60 keV rates in these spectra is counts
s-1, i.e. a fraction of only of the total source intensity.
Spectral analysis — We first analyzed spectra of the two observations using XSPEC (Arnaud, 1996) version 12.8.0 and models consisting of a PL and a PL with a high energy cutoff. To model the effect of X-ray absorption, we used the XSPEC TBabs model with abundances set as in Wilms et al. (2000) and cross sections set as in Verner et al. (2006). Note that the values of the absorption column derived from these abundances may be different to previously reported determinations of . For each observation we fitted the two spectra obtained from FPMA and FPMB, rebinned to have at least 75 counts per spectral bin. This choice is appropriate for a good overlap with the IBIS spectra, i.e. it allows similar error sizes for the spectral bins in the range keV. Since the absorption is quite high, in all the fits we left the TBabs absorption column free.
The results are reported in Table 2. The spectra from both observations do not show clear evidence for a high energy cutoff, though the improves slightly for epoch 2 using the CPL model. For this observation, a high energy cutoff is formally constrained as keV (90% confidence). An attempt to model a high energy cutoff for epoch 1 did not lead to meaningful constraints. Furthermore, for epoch 2, if we require the exponential cutoff to occur only at energies above a certain threshold (powerlaw*highecut for XSPEC), the latter parameter is compatible with zero or, formally, keV at 90% confidence.
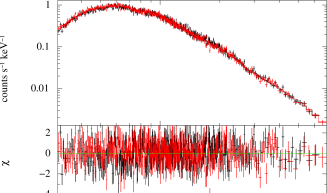
The low energy part of the spectrum, when fitted by a single continuum component shows positive residuals below keV. Therefore, in order to improve the modeling, we added a multicolor disk blackbody or diskbb (Mitsuda et al., 1984; Makishima et al., 1986) component to both the above spectral models. Due to the limited soft X-ray coverage, we fixed the value of the inner disk temperature as 0.3 keV, consistent with previous observations. The resulting is improved for both epochs. Assuming a distance of 8.5 kpc and inclination angles between and , the flux of the disk component points to values of the inner disk radius , where is the gravitational radius (14.8 km for a 10 black hole). Figure 3 shows the count rate spectrum, fitted by the PL plus low energy disk component for epoch 2.
We note that the detection of the disk component in the hard X-ray spectra of black holes is common (Reis, Fabian & Miller, 2010). In our case, it is quite unlikely that it can be ascribed to a calibration issue affecting the low energy response, which has been calibrated in flight against observations of the Crab source, known to have a PL spectrum below 10 keV. Also, the cross-calibration of NuSTAR with other X-ray instruments in the soft band is found to be very good (Harrison et al., 2013).
To better establish the presence of the soft excess, we fitted simultaneously the four NuSTAR spectra of the epochs 1 and 2 (note that the results of the spectral analysis for the two observations are in good agreement with each other). An F-test against the null hypothesis of a PL spectrum gives a very low probability of 3.6. However, following Protassov et al. (2002), the null distribution of the F-statistics could deviate from the nominal values when testing for the presence of a spectral feature, or the significance of an added model component. An alternative approach is using the Akaike information criterion, AIC (Akaike, 1974). This method can be used to compare the relative quality of models, all using a given data set. Following Burnham & Anderson (2002), for each model considered, AIC is computed as
| (1) |
where p is the number of free parameters, n is the number of data samples and L is the maximized value of the likelihood function applied to that model. In the case of fitting,
| (2) |
where C is a value, depending only on the data set and hence, is constant for all models. The model which yields the minimum AIC is, regardless of the true (and unknown) underlying process, the one minimizing the information loss and the relative likelihood of a model can be estimated as (/2), where is the difference in the AIC values of and . Applying the above method to the same model spectra used in the F-test and computing the relative probability, we found that the PL model without the soft component is 3.8 less probable than the corresponding model with the added diskbb. This result provides evidence that the disk blackbody is indeed present in our data. Using the same data set, we computed the upper limits for the equivalent width (EW) of an iron line feature at 6.4 keV. Modeling with a narrow line yields a 90% confidence limit of 12 eV while a Gaussian line with a FWHM of 1 keV yields a corresponding value of 38 eV. These are statistical limits and do not include an analysis of the possible fluctuations of the line background.
We also used Comptonization models such as comptt (Titarchuk, 1994; Hua & Titarchuk, 1995) and compps
(Poutanen & Svensson, 1996) to fit the epoch 2 data. The latter includes modeling of reflection from the cold
disk following the method of Magdziarz & Zdziarski (1995). In fitting with both models, we assume a Maxwellian
distribution of electron temperature and a spherical geometry for the electron cloud. Moreover,
for compps we used a disk viewing angle fixed at .
A good fit was obtained in both cases when adding the diskbb component, i.e. =753/740 and
=754/737 for comptt and compps, respectively.
The fit with comptt sets a lower limit to the electron temperature of the hot, optically thin
cloud as 40 keV, whereas compps puts some more contraints on this parameter, yielding
=115 keV (90% confidence). For the latter model a reflection
component cannot be detected
and the 90% upper limit to the reflection normalization is for 1000 erg cm s-1,
where is the ionization parameter.
We also computed upper limits using reflionx,
a recently improved version of the constant density, ionized disc model of Ross, Fabian & Young (1999)
and Ross & Fabian (2005).
For the spectral fitting, we tied the spectral index parameter of the reflionx component to
the one of the direct PL component.
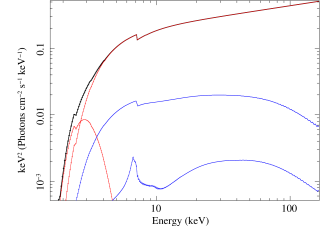
Figure 4 shows the best fit model with the diskbb and PL components
along with the 90% upper limit spectra of the reflected components for a partially ionized
and fully ionized disk (=1000 erg cm s-1 and =10,000 erg cm s-1, respectively).
The corresponding
upper limits in the solid angle normalization, /2, for the above cases are
R=0.007 (=1000 erg cm s-1) and R=0.08 (=10,000 erg cm s-1).
| Model | Epoch | ||||||||
|---|---|---|---|---|---|---|---|---|---|
| ( cm-2) | (keV) | (keV) | |||||||
| PL | 1 | 19.41.1 | 1.650.03 | 3439 | 47812 | 408/377 | |||
| diskbb+PL | 1 | 24.3 | 1.710.35 | 144 | 37116 | 46713 | 387/376 | ||
| PL | 2 | 19.40.7 | 1.670.02 | 3296 | 4497 | 771/741 | |||
| diskbb+PL | 2 | 22.01.3 | 1.700.02 | 66 | 3438 | 4445 | 755/740 | ||
| CPL | 2 | 18.30.9 | 1.580.04 | 215 | 3207 | 4428 | 761/740 | ||
| highecut*PL | 2 | 18.2 | 1.60 | 260 | 3199 | 4418 | 760/739 | ||
| diskbb+CPL | 2 | 20.9 | 1.65 | 4931 | 335 | 4418 | 753/739 |

Timing analysis — We extracted light curves of 1E1740.7-2942 (catalog ) in the energy range 3–60 keV from epoch 2 with XSELECT V2.4b using a time resolution of 10ms, and corrected them using the tool nulccorr. Prior to temporal binning, the filtered event files were corrected for arrival times at the Solar System Barycenter using the JPL 2000 ephemeris (for this purpose, we used the barycorr tool in the HEASOFT v13 distribution). We then calculated power spectra on different contiguous sections of the light curves and averaged them into a total spectrum. Each single power spectrum was built using intervals of 32768 bins and averaging up to 10 intervals in a frame. The total spectrum was finally rebinned in frequency channels for more statistics. An offset constant term was subtracted from the total spectrum to remove the Poisson noise level and compensate for residual effects of the deadtime correction. This term was evaluated as the average power in the frequency interval 10–49 Hz. The power spectrum is shown in Figure 5. Although the statistics are quite poor due to the short exposure time of the observations, we could model the power spectrum with a zero-centered Lorentzian function and obtained a good fit (=15.4/23). For our adopted normalization, the root-mean-square (RMS) variability is derived as the integral of the Lorentzian. This resulted in %. The error also includes the uncertainty in the evaluation of the offset term.
3.2. INTEGRAL
We extracted images, spectra and lightcurves of 1E1740.7-2942 (catalog ) from the IBIS/ISGRI instrument using the INTEGRAL Off Line Analysis v.10 package which takes advantage of a recently updated calibration (Caballero et al., 2012). The lightcurves and spectra of 1E1740.7-2942 (catalog ) were extracted by simultaneous fitting of all the sources detected in the mosaic images above a detection level of 7. This process reduces systematic noise in the reconstructed flux due to the cross-talk between sources to a level close to % or less. For 1E1740.7-2942 (catalog ) this effect is mostly limited to lower energies, because the source is the brightest one in the field at keV. For this reason we excluded the energy channels below 26 keV from the analysis.

Figure 6 shows the IBIS/ISGRI light curves in the energy bands 26–60 keV and 60–150 keV for epoch 3. We performed an analysis of the IBIS spectrum to search for any evidence of spectral curvature at high energy, which is a typical signature of (thermal) Comptonization. The absorption value was fixed as = cm-2 in TBabs and a systematic error of 1% has been added to all spectral channels. For IBIS, the PL model fit is not satisfactory, resulting in =48.1/20. Conversely, using the CPL model yields =24.2/19 with a high energy cutoff at =123 keV. The resulting count rate spectrum with the convolved best fit model is shown in Figure 7. This measurement yields definitive evidence for spectral curvature at high energies and is fully compatible with the NuSTAR measurements described in Sect. 3.1. See also the following Sect.3.3.
3.3. NuSTAR/INTEGRAL spectrum
| Model | |||||||||||
|---|---|---|---|---|---|---|---|---|---|---|---|
| ( cm-2) | (keV) | (keV) | (keV) | ||||||||
| PL | 20.40.6 | 1.6900.013 | 1.040.03 | 4416 | 95526 | 1337/1141 | |||||
| diskbb+PL | 27.21.2 | 1.7580.021 | 14 | 0.380.06 | 1.100.03 | 4326 | 86632 | 1262/1139 | |||
| CPL | 18.00.6 | 1.5560.024 | 163 | 1.270.03 | 4506 | 62329 | 1188/1140 | ||||
| diskbb+CPL | 20.31.3 | 1.5970.029 | 190 | 47 | 0.3(f) | 1.130.03 | 4386 | 62528 | 1174/1139 | ||
| diskbb+comptt | 20.40.9 | 38 | 1.41 | 48 | 0.3(f) | 1.130.03 | 4417 | 63831 | 1168/1139 |

We fitted the NuSTAR and IBIS/ISGRI data for the whole set of observations described in Table 1. For the spectral fits we considered, in addition to the empirical PL and CPL models, the thermal Comptonization model comptt, which assumes that the soft seed photons in the accretion disk are diffused via inverse Compton scattering by an electron plasma with a Maxwellian distribution of energies. The spectrum of the seed photons is assumed to follow the Wien law and is typically keV. For our purposes, the shape of the seed photon spectrum is not relevant since our spectra are measured at energies keV. Conversely, the high energy part of the spectrum is dominated by the cutoff induced by the finite temperature of the plasma electrons.
The data set consists of four NuSTAR spectra and one IBIS/ISGRI spectrum. We allowed free normalization between the three different observations by including a normalization factor in all the models. The NuSTAR spectra from FPMA and FPMB of the same observation are cross-calibrated between each other at the few % level. For this reason, we included another free normalization factor. The five spectra are the same discussed previously in this Section. We summarize the results of the overall fits in Table 3. In Figure 8, the resulting unfolded spectrum for the diskbb+comptt model is shown. The result of the fit, even if not formally acceptable, is adequate to describe the broadband shape and characterize it as dominated by a thermal Comptonized component in the energy band 3-250 keV. Adding the soft component improves the quality of all model fits; however, only for one model (diskbb+PL) it is possible to constrain both disk temperature and normalization.
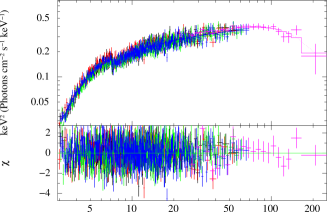
Table 3 also lists the values of the relative normalization factor between the IBIS/ISGRI and the NuSTAR epoch 2 observations. In the fit, we fixed to unity the normalization of the epoch 2 observation for the NuSTAR FPMA. The relative (variable) normalization of epochs 1 to 2 is actually found to be constant for all model fits, i.e. =1.040.01. Note that the value of accounts not only for the different flux between the two observations but also for any difference in the cross-calibration of the two instruments.
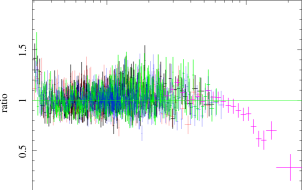
Finally, to better describe the departure of the spectrum from a pure PL we plot in Figure 9 the data/model ratios in the energy band 3–250 keV. The positive residuals at low energies are likely due to the thermal disk component, while the negative values of the ratio at high energies are due to an exponential cutoff.
4. Discussion
These observations show that 1E1740.7-2942 (catalog ) presents a featureless spectrum in its hard state and is consistent with being dominated by Comptonization with an electron temperature of keV. Assuming a distance of 8.5 kpc, the luminosity of the source is erg s-1, i.e. a fraction less than a few % of the Eddington limit for a stellar black hole. The sensitivity of NuSTAR constrains the strength of the reflection component to be quite low, similar to the limits which have been measured previously by Reynolds & Miller (2010), who reported a disk reflection fraction at the 99% confidence level. However, in contrast to these observations, the Suzaku data are compatible with no high energy cutoff ( keV). This issue could be ascribed to either a genuine variation of the plasma temperature causing the cutoff energy to vary, to a different inherent mechanism for the hard X-ray emission, or to a difference in calibration with the HXD instrument. However, we note that the Suzaku and NuSTAR PL slopes are similar when data are fitted without a high energy cutoff. Also, a sensitivity bias is unlikely as Reynolds & Miller (2010) report a Suzaku detection up to 300 keV. Therefore, it is likely that the difference is related to a genuine variation of the physical conditions of the high energy corona in two different occurrences of the hard state. Both Suzaku and NuSTAR detect a soft component in the spectrum of the hard state and the NuSTAR data are compatible with a disk inner radius close to the ISCO. However, we cannot exclude a recessed disk as we cannot determine any reliable constraints of the parameters of the soft component. Using diskbb on the single NuSTAR observations and leaving free, the fitting procedure converges to either values keV with a rather strong soft component (rather unlikely in a hard state), or to values keV, yielding normalizations similar to what was observed by Suzaku. Castro et al. (2012) also report the presence of a soft component in the hard state during an observation in 2005 by XMM/Newton, with an inner disk color temperature close to 0.25 keV. Our upper limits on the EW of a 6.4 keV Fe line are consistent with the ones reported by Nakashima et al. (2010), who found 8 eV with Suzaku/XIS, and by Sakano et al. (1999), who measured EW eV with ASCA. Heindl & Smith (1998) also report a line with EW=19 eV with observations by RXTE/PCA.
At the highest energies we can compare our observations with the available measurements from INTEGRAL/SPI. These observations, described in Bouchet et al. (2009), point to the presence of two different spectral components, of which the lower in energy is well described by thermal Comptonization with a cutoff energy of 140 keV. The higher energy component is above 200 keV. We did not detect this component: fitting our NuSTAR/INTEGRAL spectrum with a two temperature model, in which the seed photon temperature of the high energy component is equal to 30 keV as in Bouchet et al. (2009), the 90% upper limit flux for the high energy excess is 4 erg s-1 cm-2 in the 20–250 keV band. This value, scaled by the intensity measured by SPI, is % higher than the flux of this component reported by these authors. Our observations are then substantially in agreement with those of Bouchet et al. (2009) for the highest energies.
There are several possible reasons for the low level of reflection from 1E1740.7-2942 (catalog ). If the accretion disk is close to the ISCO and the upper layers of the disk are close to being fully ionized, the reflection would be non-negligible but the shape of the reflected spectrum could be quite similar to that of the directly radiated flux (see e.g. Figure 4). In this case, it would be quite difficult to detect it. Furthermore, Fe lines and edges can be significantly broadened by additional Doppler and relativistic effects. Conversely, if the disk is recessed, the geometry and positioning of the corona relative to the disk could play a role and likewise for the (unknown) disk inclination. A low level of reflection is also expected if a substantial part of the hard X-ray spectrum is generated in an outflow (Beloborodov, 1999). However, the mechanism of acceleration in an outflow or jet and its connection to the hot disk corona are presently not understood and so, also the relative contribution of the jet component. The hard tail detected by Bouchet et al. (2009) could be non-thermal and associated with a jet, similar to the high energy polarized component in Cyg X-1. In this case we could have a scenario in which the bulk of hard X-rays are indeed produced by a hot corona up to keV, with a jet dominating emission at higher energies.
For 1E1740.7-2942 (catalog ) we report clear evidence for a high energy cutoff, which is a typical signature of a thermal electron plasma. However, this scenario is not the only one that is consistent with such a cutoff. The emergent spectra computed by jet models could also contain high energy exponential cutoffs in the region from 100 to a few hundred keV, generated, e.g., by synchrotron cooling as described in Markoff et al. (2001). These features can also be produced by Comptonized emission from regions within the jet (Reig et al., 2003; Giannios, 2005) or at the base of it (Markoff et al., 2005). For the jet model of Markoff et al. (2005), the interplay of the direct synchrotron and Comptonized components controls the hardening of the spectrum above 10 keV, which is commonly ascribed to reflection in a corona/disk model. If such hardening is not present, as in the case of 1E1740.7-2942 (catalog ), the synchrotron emission component could be dominant. However, we emphasize that in our case it is not possible to provide any direct evidence of synchrotron emission or non-thermal Comptonization, and our broadband spectrum in the range 3–250 keV is well described by inverse Compton radiation by a hot, optically thin thermal plasma plus a soft disk component.
5. Conclusions
We have analyzed spectra of the well known microquasar 1E1740.7-2942 (catalog ), located in the vicinity of the GC using the NuSTAR telescope and the hard X-ray instrument IBIS/ISGRI on board INTEGRAL. During the observations, the source was in a typical low/hard state. We have analyzed NuSTAR spectra from two different observations (taken about two weeks apart) and found that they are fully consistent. The NuSTAR and IBIS/ISGRI data, spanning a time range of months, are also well in agreement both for the spectral modeling and for the relative normalization. The broadband spectrum in the range 3–250 keV is essentially modeled by a component that is consistent with Comptonization with a thermal energy cutoff keV. The NuSTAR power spectrum is compatible with what was previously observed by RXTE (Smith et al., 1997; Lin et al., 2000) and also RMS variation is detected at the level of %.
At the softest energies, near 3 keV, there is some evidence for a soft component. Although we cannot obtain a reliable measure of the disk temperature and inner radius, due to both the low threshold of 3 keV and the shortness of the NuSTAR observations, the disk component observed is quite compatible with previous observations by Suzaku. Conversely, the detection of a high energy cutoff points to a possible change in the physical conditions of the plasma in the Comptonizing corona (we also note that a state change occurred shortly after these observations).
The very high sensitivity of NuSTAR has allowed us to characterize in detail the spectrum of this source up to 70 keV and combining NuSTAR and INTEGRAL provides a determination of the overall properties of the broadband emission. The complementarity of NuSTAR and INTEGRAL is excellent for the study of the properties of black holes in the low/hard state, for which the bulk of the emission is in the energy range keV. In the case of 1E1740.7-2942 (catalog ), we were able to rule out a single PL model for the broadband spectrum. NuSTAR could not detect any reflection feature; however, more interesting results/constraints will likely come from significantly longer observations of this source.
References
- Akaike (1974) Akaike, H. 1974, IEEE Trans. on Automatic Control, Vol.19, Issue 6, p.716
- Arnaud (1996) Arnaud, K.A., 1996, in Astronomical Data Analysis Software and Systems V, ed. G.H. Jacoby, J. Barnes, Vol. 101, 17
- Bally & Leventhal (1991) Bally, J. & Leventhal, M. 1991, Nature, 353,234
- Beloborodov (1999) Beloborodov, A.M., 1999, ApJ, 510, 123
- Bouchet et al. (1991) Bouchet, L., Roques, J.P, Mandrou, P., et al. 1991, ApJ, 383, L45
- Bouchet et al. (2009) Bouchet, L., Del Santo, M., Jourdain, E., et al. 2009, ApJ, 693, 1871
- Burnham & Anderson (2002) Burnham, K. P. & Anderson, D.R. 2002, Model selection and multimodel inference: a practical information-theoretic approach (2nd ed.; New York:Springer)
- Caballero et al. (2012) Caballero, I., Zurita-Heras, J.A., Mattana, F., et al. 2012, in Proceedings of Science (Trieste,Italy: SISSA), 142, http://pos.sissa.it/cgi-bin/reader/conf.cgi?confid=176
- Castro et al. (2012) Castro, M.C., Maiolino, T., D’Amico, F., et al. 2012, in Proceedings of Science (Trieste,Italy: SISSA), 46, http://pos.sissa.it/cgi-bin/reader/conf.cgi?confid=176
- Churazov et al. (1993) Churazov, E., Gilfanov, M., Sunyaev, R., et al. 1993, ApJ, 407, 752
- Del Santo et al. (2005) Del Santo, M., Bazzano, A., Zdziarski, A.A., et al. 2005, A&A, 433, 613
- Giannios (2005) Giannios, D. 2005, A&A, 437, 1007
- Harrison et al. (2013) Harrison, F.A., Craig, W.W., Christensen, F.E., et al. 2013, ApJ, 770, 103
- Heindl & Smith (1998) Heindl, W.A., & Smith, D.M. 1998, ApJ, 506, 35
- Hertz & Grindlay (1984) Hertz, P., & Grindlay, J.E. 1984, ApJ, 278, 137
- Hua & Titarchuk (1995) Hua, X.M. & Titarchuk, L.G. 1995, ApJ, 449, 188
- Jourdain et al. (2012) Jourdain, E., Roques, J.P., Chauvin, M., & Clark, D.J. 2012, ApJ, 761, 27
- Jung et al. (1995) Jung, G.V., Kurfess, D.J., Johnson, W.N., et al. 1995, A&A, 295, 23
- Kuznetsov et al. (1997) Kuznetsov, S., Gilfanov, M., Churazov, E., et al. 1997, MNRAS, 292, 651
- Laurent et al. (2011) Laurent, P., Rodriguez, J., Wilms, J., et al. 2011, Science, Vol. 332, no. 6028, p.438
- Lin et al. (2000) Lin, D., Smith, I.A., Böttcher, M., & Liang, E.P. 2000, ApJ, 531, 963
- Lund et al. (2003) Lund, N., Budtz-Jørgensen, C., Westergaard, N.J. et al. 2003, A&A, 411, L231
- Magdziarz & Zdziarski (1995) Magdziarz, P., & Zdziarski, A.A. 1995, MNRAS, 273, 837
- Makishima et al. (1986) Makishima, K., Maejima, Y., Mitsuda, K., et al. 1986, ApJ, 308, 635
- Markoff et al. (2001) Markoff, S., Falcke, H., & Fender, R. 2001, A&A, 372, L25
- Markoff et al. (2005) Markoff, S., Nowak, M.A., & Wilms, J. 2005, ApJ, 635, 1203
- Martì et al. (2010) Martì, J., Luque–Escamilla, P.L., Sánchez-Sutil, J.R., et al. 2010, ApJ, 721, 126
- McConnell et al. (2002) McConnell, M.L., Zdziarski, A.A., Bennett, K., et al. 2002, ApJ, 572, 984
- Mirabel et al. (1992) Mirabel, I.F., Rodriguez, L.F., Cordier, B., Paul, J. & Lebrun, F. 1992, Nature, 358, 215
- Mirabel et al. (1993) Mirabel, I.F., Rodriguez, L.F., Cordier, B., Paul, J. & Lebrun, et al. 1993, A&A, 97, 193
- Mitsuda et al. (1984) Mitsuda, K., Inoue, H., Koyama, K., et al. 1984, PASJ, 36, 741
- Nakashima et al. (2010) Nakashima, S., Nobukawa, M., Go Tsuru, T., Koyama, K. & Uchiyama, H., et al. 2010, PASJ, 62, 971
- Ogilvie & Dubus (2001) Ogilvie, G.I. & Dubus, G. 2001, MNRAS, 320, 485
- Paul et al. (1991) Paul, J., Cordier, B., Goldwurm, A. et al. 1991, in Gamma Ray Line Astrophysics, ed. P.Durouchoux & N.Prantzos (New York:AIP), 232, 17
- Poutanen & Svensson (1996) Poutanen, J., & Svensson, R. 1996, ApJ, 470,249
- Protassov et al. (2002) Protassov, R., van Dyk, D.A., Connors, A., Kashyap, V.L. & Siemiginowska, A. 2002, ApJ, 571, 545
- Reig et al. (2003) Reig, P., Kylafis, N.D. & Giannios, D. 2003, A&A, 375, 155
- Reis, Fabian & Miller (2010) Reis, R.C., Fabian, A.C., & Miller, J.M. 2010, MNRAS, 402, 836
- Reynolds & Miller (2010) Reynolds, M.T., & Miller, J.M. 2010, ApJ, 716, 1431
- Ross, Fabian & Young (1999) Ross, R.R., Fabian, A.C., & Young, A.J. 1999, MNRAS, 306, 491
- Ross & Fabian (2005) Ross, R.R. & Fabian, A.C. 2005, MNRAS, 358, 211
- Sakano et al. (1999) Sakano, M., Imanishi, K., Tsujimoto, M. & Koyama, K. 1999, ApJ, 520, 316
- Smith et al. (1996) Smith, D.M., Leventhal, M., Cavallo, R. et al. 1996, ApJ, 458, 576
- Smith et al. (1997) Smith, D.M., Heindl, W.A., Swank, J., et al. 1997, ApJ, 489, 51
- Smith et al. (2002) Smith, D.M., Heindl, W.A., & Swank, J. 2002, ApJ, 578, 129
- Sunyaev et al. (1991) Sunyaev, R., et al. 1991, A&A, 247, L29
- Titarchuk (1994) Titarchuk, L.G. 1994, ApJ, 434, 570
- Ubertini et al. (2003) Ubertini, P., Lebrun, F., Di Cocco, G., et al. 2003, A&A, 411, L131
- Vedrenne et al. (2003) Vedrenne, G., Roques, J.P., Schönfelder, V., et al. 2003, A&A, 411, L63
- Verner et al. (2006) Verner, D.A., Ferland, D.J., Korista, K.T. & Yakovlev, D.G. 1996, ApJ, 465, 487
- Wilms et al. (2000) Wilms, J., Allen, A. & McCray, R. 2000, ApJ, 542, 914
- Winkler et al. (2003) Winkler, C., Courvoisier, T.J.-L., Di Cocco, G. et al. 2003, A&A, 411, L1