A system of beam energy measurement based on the Compton backscattered laser photons for the VEPP-2000 electron-positron collider
Abstract
The beam energy measurement system for the VEPP-2000 electron-positron collider is described. The method of Compton backscattering of laser photons on the electron beam is used. The relative systematic uncertainty of the beam energy determination is estimated as . It was obtained through comparison of the results of the beam energy measurements using the Compton backscattering and resonance depolarization methods.
keywords:
compton backscattering , beam energy calibration , collider VEPP-20001 Introduction
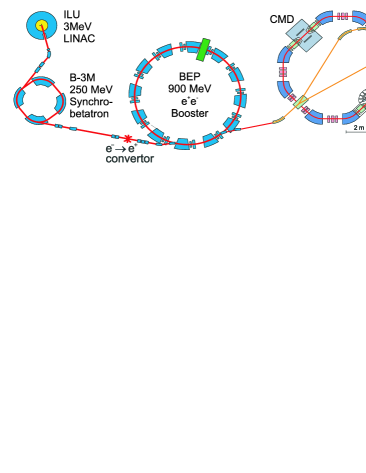
The collider VEPP-2000(BINP, Novosibirsk) [1] for the energy range – 2 GeV with a peak luminosity of cm-2s-1 was commissioned in 2007. The design of VEPP-2000 is based on the concept of round colliding beams, which allows to achieve luminosity up to cm-2s-1 in a bunch per bunch regime due to suppression of the beam-beam tune shift [2]. The layout of the VEPP-2000 complex is shown in Fig.1.
Currently the Cryogenic magnetic detector (CMD-3) and Spherical neutral detector (SND) collect data at VEPP-2000. The main goals of these experiments are
-
1.
High precision measurements of the cross section of the processes of annihilation into hadrons. These results are of paramount importance for the test of the Standard Model by a precise comparison of the experimental and theoretical predictions for the anomalous magnetic moment of the muon.
-
2.
Study of the light vector mesons and their excited states
-
3.
Study of nucleon electromagnetic form factors near threshold in the process .
The high accuracy of collider beam energy determination is crucial for a lot of physical studies. For example, in order to measure the cross section of the process with accuracy better than 1%, the beam energy should be determined with a relative error of . The beam energy measurement using Compton backscattering of monochromatic laser radiation on the electron beam (CBS method) provides such an accuracy, and allows to measure energy during data taking. This approach was developed and experimentally proved in Refs.[3, 4, 5, 6, 7]. At the BESSY-I storage ring the relative accuracy of energy measurement of about was achieved for the beam energy of 800 MeV [5]. This accuracy was confirmed by comparison of the CBS measurement with the results obtained by the resonance depolarization (RD) method [9]. In collider experiments, the CBS method was applied at VEPP-4M [7] and the factory BEPC-II [8]. A similar system was proposed and constructed for VEPP-2000. In this paper, the system design and performance are reported. The comparison of CBS and RD measurements has been performed.
2 CBS method at VEPP-2000
In the previous works [5, 6, 7, 8] the CBS method was realized as follows. Laser light interacts with an electron beam at the straight part of its orbit, i.e. the angle between initial particles is equal to . The energy spectrum of back-scattered photons is described by the Klein-Nishina cross section [10] with a sharp edge at the maximal energy (Fig.2) due to kinematics of the Compton scattering. Photons are detected by the High-Purity Germanium (HPGe) detector. The ultra-high energy resolution () of the HPGe detector allows a relative statistical accuracy in the measurement to be at the level of – . The beam energy can be calculated using the measured value:
| (1) |
where is the laser photon energy.
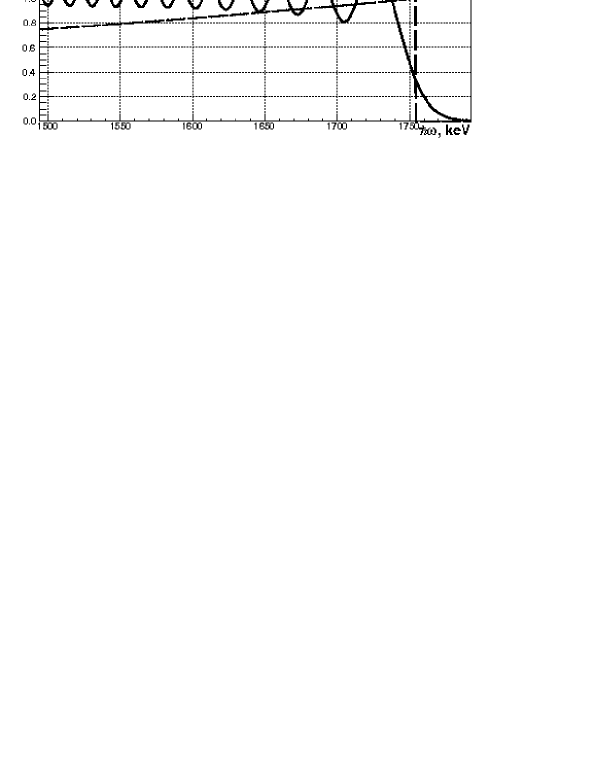
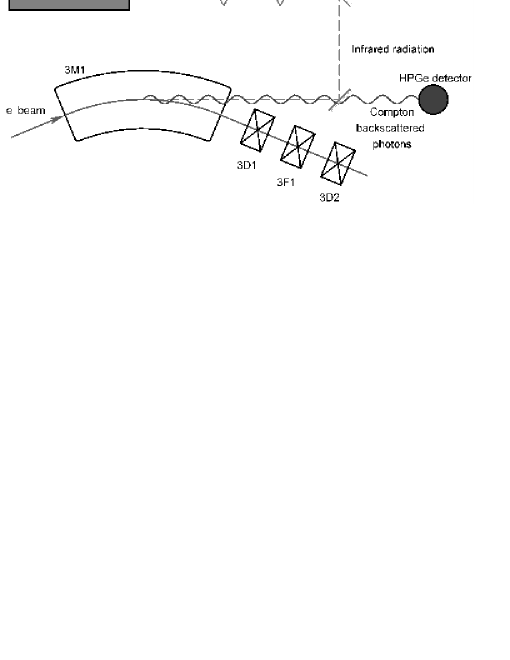
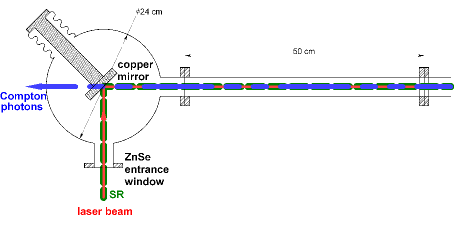
At VEPP-2000 the interaction of laser photons with electrons occurs inside the 3M1 bending magnet at the curvilinear part of orbit. The layout of the beam energy measurement system is shown in Fig.3. In this case the energy spectrum of scattered photons (Fig.2) is described by the formulae [11]:
| (2) |
where
| (3) |
| (4) |
| (5) |
Here is the Airy function, is the scattered photon energy, is the dipole magnet field, T. Taking into account the beam energy spread, the energy distribution of the scattered photons (2) can be expressed as
| (6) |
where
| (7) |
Here is a relative beam energy spread. The beam energy is obtained by a fit of the measured spectrum to the theoretical distribution (6).
3 The system of beam energy measurement for VEPP-2000
The system of beam energy measurement consists of the laser source, optical and laser-to-vacuum insertion systems to transport the laser beam into the interaction region where the laser beam collides with the electron beam, and the HPGe detector to measure backscattered photons.
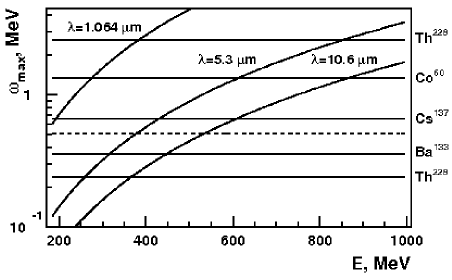
The source of initial photons is a PL3 laser from Edinburgh Instruments. The laser wavelength is calibrated with a relative accuracy of by a manufacturer, but this precision in not sufficient to measure beam energy with an accuracy of . Therefore, a laser was additionaly calibrated with the help of a high precision wavelength meter WS6-200 IR-III from High Finesse/ngstrom. It was found that the laser has a maximal power of 2W at the wavelength m. This value agrees well with the table data 5.426463 m for the wavelength of the P23 transition in a molecule. Thus, the contribution of the laser wavelength accuracy to the relative error of the beam energy determination is less than . The laser is used because in the entire VEPP-2000 energy range – 1.0 GeV the energy of back scattered photons can be measured by the HPGe detector ( – 3.5 MeV). There exist -active radionuclides suitable for a detector calibration in this energy range. (Fig.4).
The total distance from the laser output aperture to the interaction region is 773 cm. Two ZnSe lenses with focal lengths of cm and cm focus a laser beam in such a way that its transverse size at the interaction region is 1 mm. The laser beam passes the lenses and is reflected by the mirror to a viewport in a vacuum pipe extension of the beam pipe. The mirror is installed on a special support that allows precise vertical and horizontal angular alignment by using stepping motors (one step equals rad).
The insertion of the laser beam into the vacuum chamber is performed using the laser-to-vacuum insertion system (Fig.6). The system is a special stainless steel vacuum chamber with a ZnSe entrance viewport and copper mirror. The laser beam passes to the vacuum chamber through the entrance viewport and is reflected by an angle of at the copper mirror. After backscattering, the photons return to the mirror, pass through it, leave the vacuum chamber, and are detected by the HPGe detector.
The design of the copper mirror was presented in Ref.[8, 12]. The viewport based on the ZnSe polycrystal provides:
-
1.
transmission spectrum from 0.45 up to 20 m,
-
2.
baking out of the vacuum system up to 250∘C,
-
3.
very high vacuum.
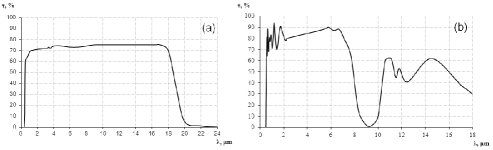
The viewport was manufactured using a ZnSe crystal plate with a diameter of 50.8 mm and thickness of 8 mm. The transmission spectrum of the plate is shown in Fig. 6(a). The ZnSe viewport design is similar to the design of the viewport described in Refs.[8, 12, 13]. The transmission spectrum of the product is shown in Fig. 6(b).
After installation of the vacuum chamber at VEPP-2000 and pumping out, a pressure of Torr was obtained.
The optical elements of the system are adjusted using the synchrotron radiation (SR) light of the electron beam. The copper mirror of the vacuum chamber and the mirrors of the optical system are adjusted in such a way that the SR light comes to the laser output window. Application of the ZnSe viewport in contrast to GaAs one[8] makes system adjusting more convenient because ZnSe is transparent for the visible part of SR.
At VEPP-2000 the n-type coaxial HPGe detector manufactured by ORTEC (model GMX25-70-A) is used for the system of energy measurement. It has a diameter of 51.1 mm and height of 72.9 mm. The energy resolution for the 1.33 MeV line of is 1.9 keV (FWHM). The detector is connected to the multichannel analyzer (MCA) ORTEC DSpec Pro, which transfers data using the USB port of the computer.
The HPGe spectrum has channels. The bin error for each channel is determined as
| (8) |
where is the number of counts in the channel and corresponds to the MCA differential nonlinearity, which is 0.02 according to the MCA specifications.
In order to protect the HPGe detector from background, it is surrounded by a 6 cm lead collimator with a 4 cm diameter hole in the direction of the beam scattered -quanta. The detector is arranged in the collider’s orbit plane, at the distance of 225 cm from the interaction region of laser radiation and an electron beam.
The data acquisition system is similar to those described in Ref.[8]. During data taking, the mirror is adjusted automatically to provide a maximal photon/electron interaction efficiency using the feedback from the detector counting rate.
The data for the HPGe detector calibration – peaks of the sources and peaks of the precise calibration pulse generator BNC model BP-5 with integrated nonlinearity ppm and jitter ppm are accumulated simultaneously with scattered photons. Generator signals are put to the preamplifier with 12 different amplitudes covering the range of MCA and frequency of 1 Hz. The pulse shape is set in such a way that it is similar to the shape of the signal from a -quantum.
The system was operating in the test mode in April-December of 2012. In 2013 it started permanent operation in experiments at VEPP-2000.
4 Data processing
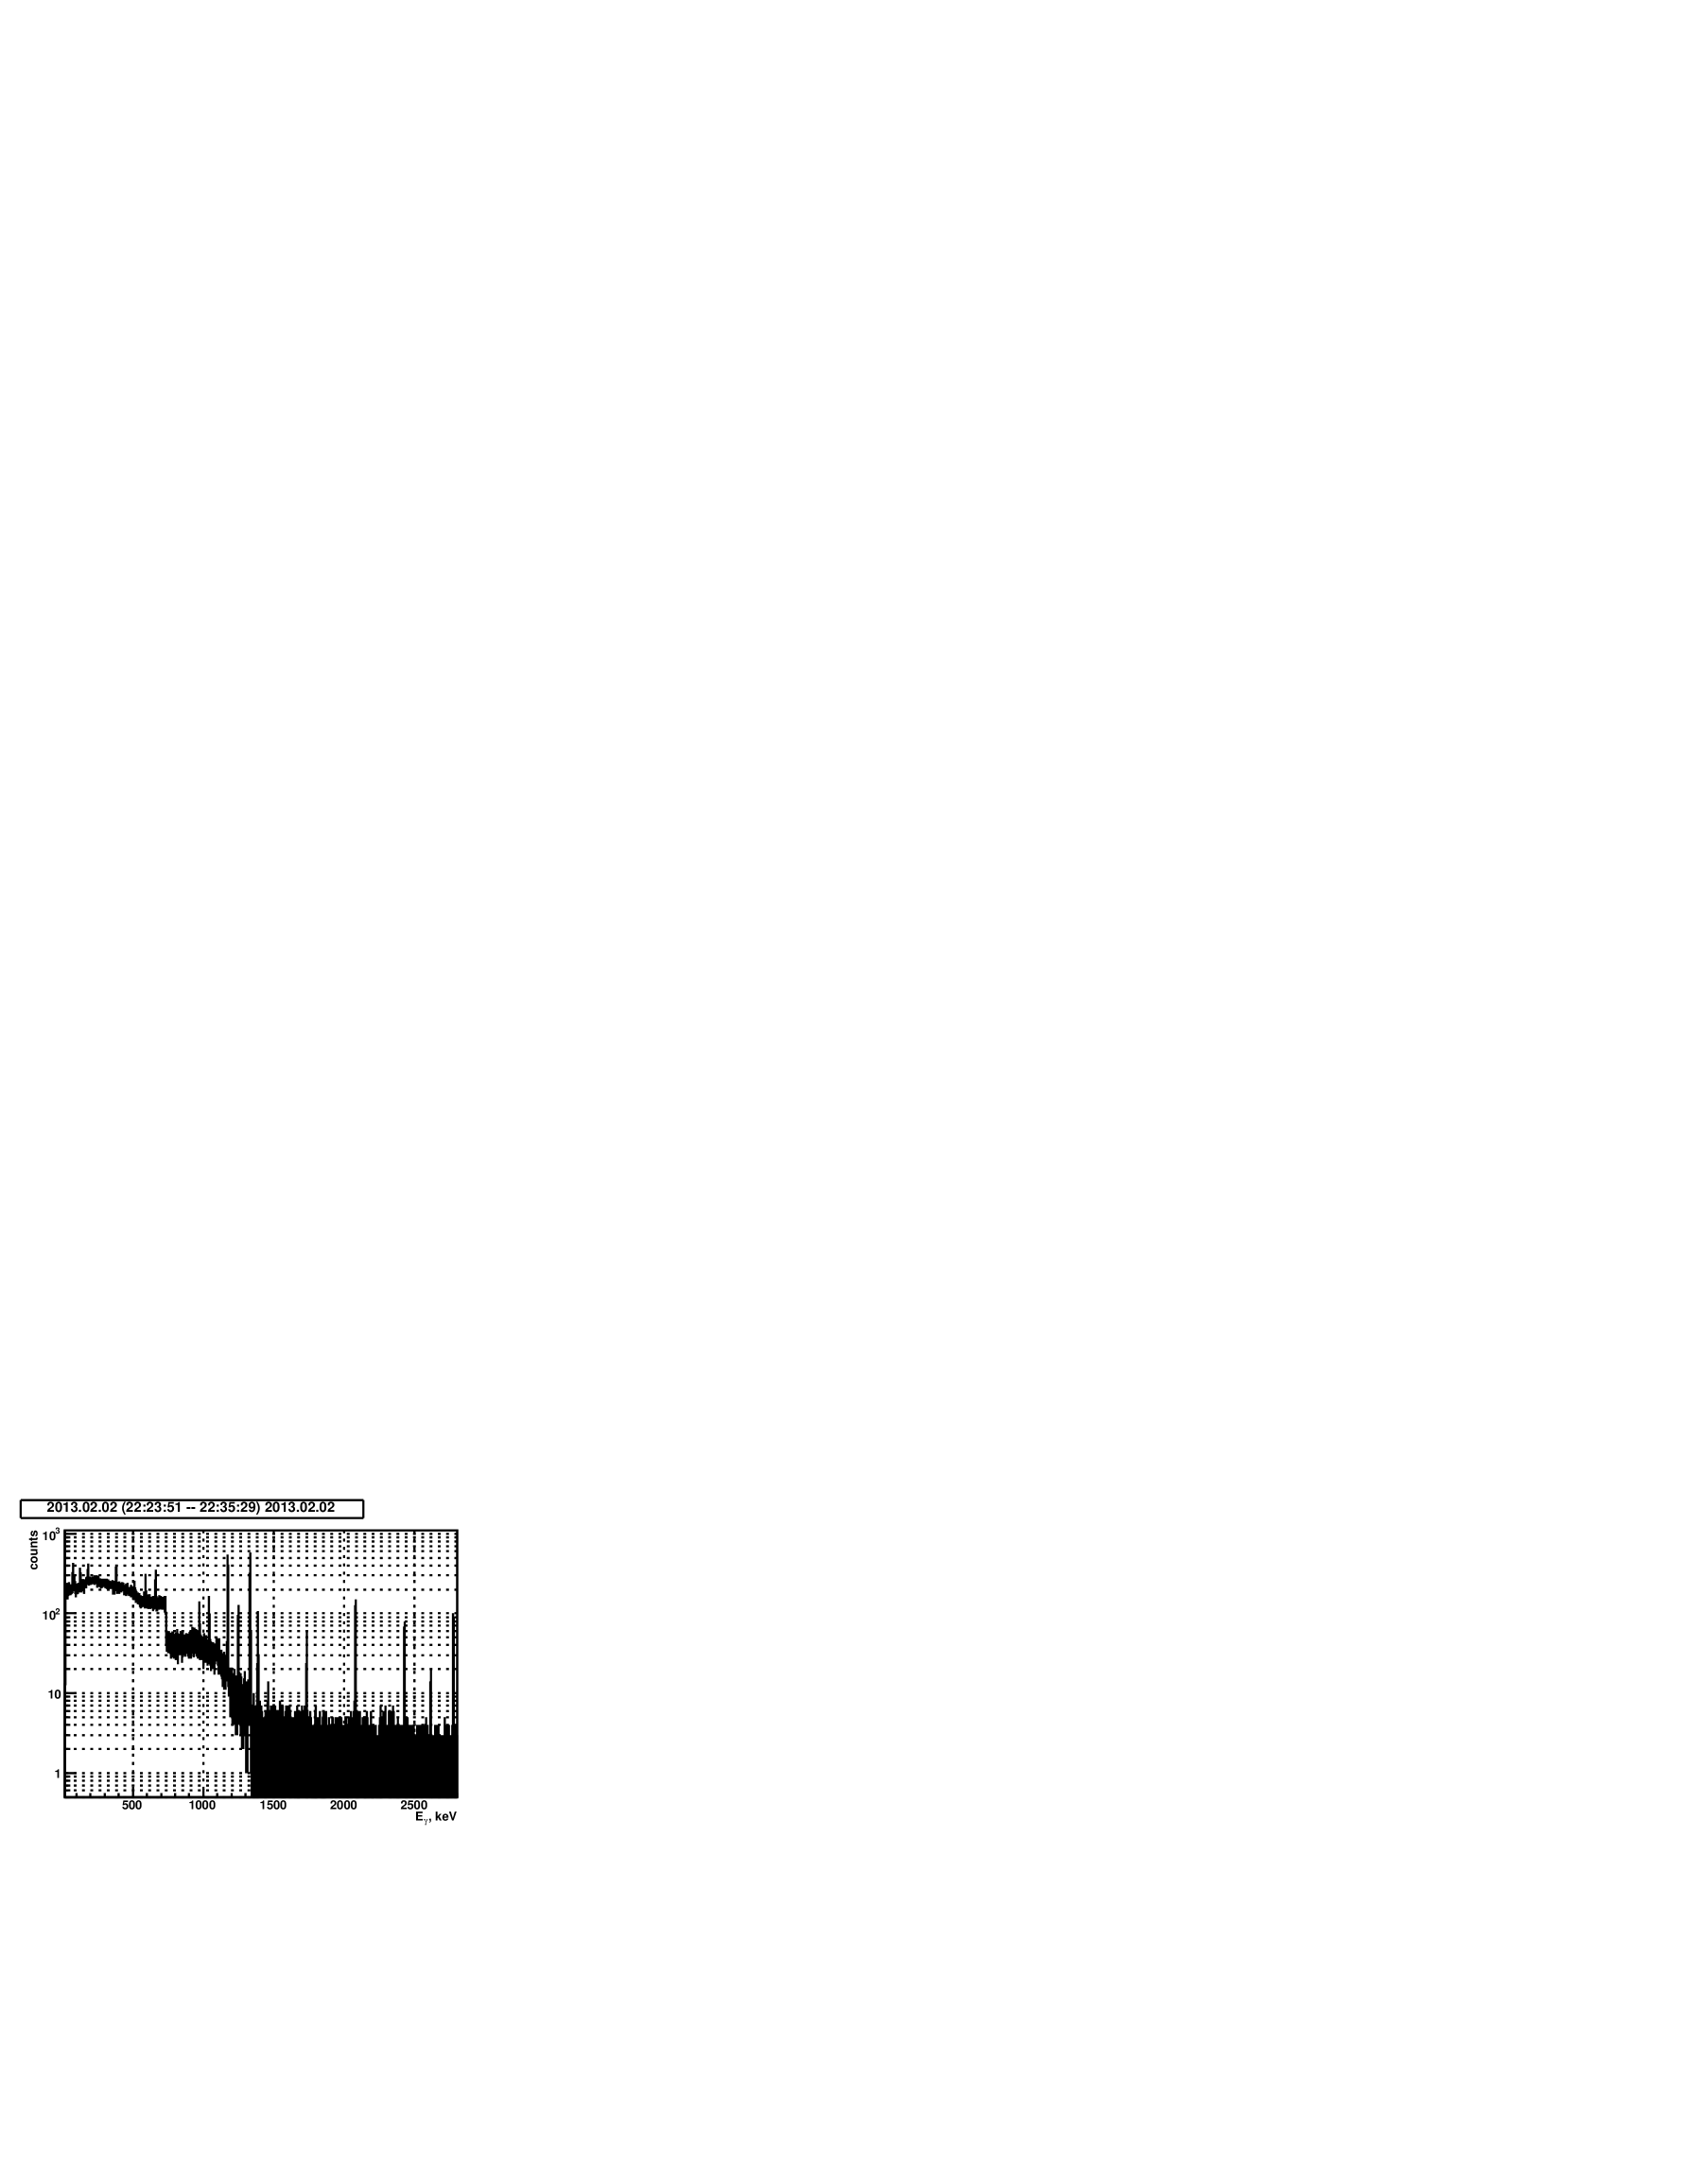
The processing of the spectrum (Fig. 8) includes calibration of the energy scale, Compton edge fitting and determination of the beam energy. The procedure is similar to those described in Ref.[8].
| Source | , keV |
|---|---|
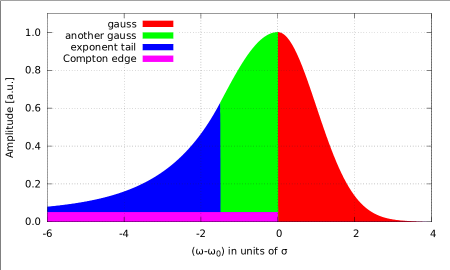
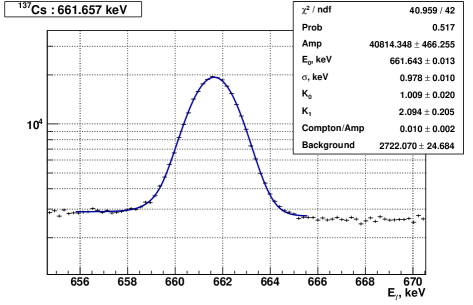
The radiative sources used in this work for the HPGe detector scale calibration are presented in Table 1. The goal of the HPGe detector calibration is to obtain the coefficients needed for conversion of the MCA counts of the HPGe detector into the corresponding energy deposition, measured in units of keV, as well as to determine the parameters of the detector response function. The following response function is used (Fig.8):
| (9) |
where is normalization, is the position of the maximum, and are RMS of the Gaussian distribution to the right and to the left of the , respectively, is responsible for the small-angle Compton scattering of -quanta in the passive material between the source and the detector, is an asymmetry parameter.
The calibration procedure is as follows:
-
1.
Peak search and identification of the calibration lines (Table 1).
-
2.
The peaks which correspond to calibration lines are fitted by a sum of the signal and background distributions (Fig.9). The free parameters of the fit are , , , , and constant coefficient , which takes into account background. The generator peaks are well fitted by the Gaussian distribution with a mean value and RMS .
-
3.
Using generator data the nonlinearity of MCA scale is obtained:
(10) where is a generator amplitude in V, is a corresponding amplitude in MCA counts, and are the linear coefficients, is a cubic spline, which takes into account ADC nonlinearity. Using the results of the isotope peak approximation and values of calculated from Eq.(10) the coefficients and to convert the amplitude of the generator in the corresponding energy of -quanta in keV are obtained:
(11) Using (10) and (11), the formula for conversion of MCA counts to the energy measured by the HPGe detector is:
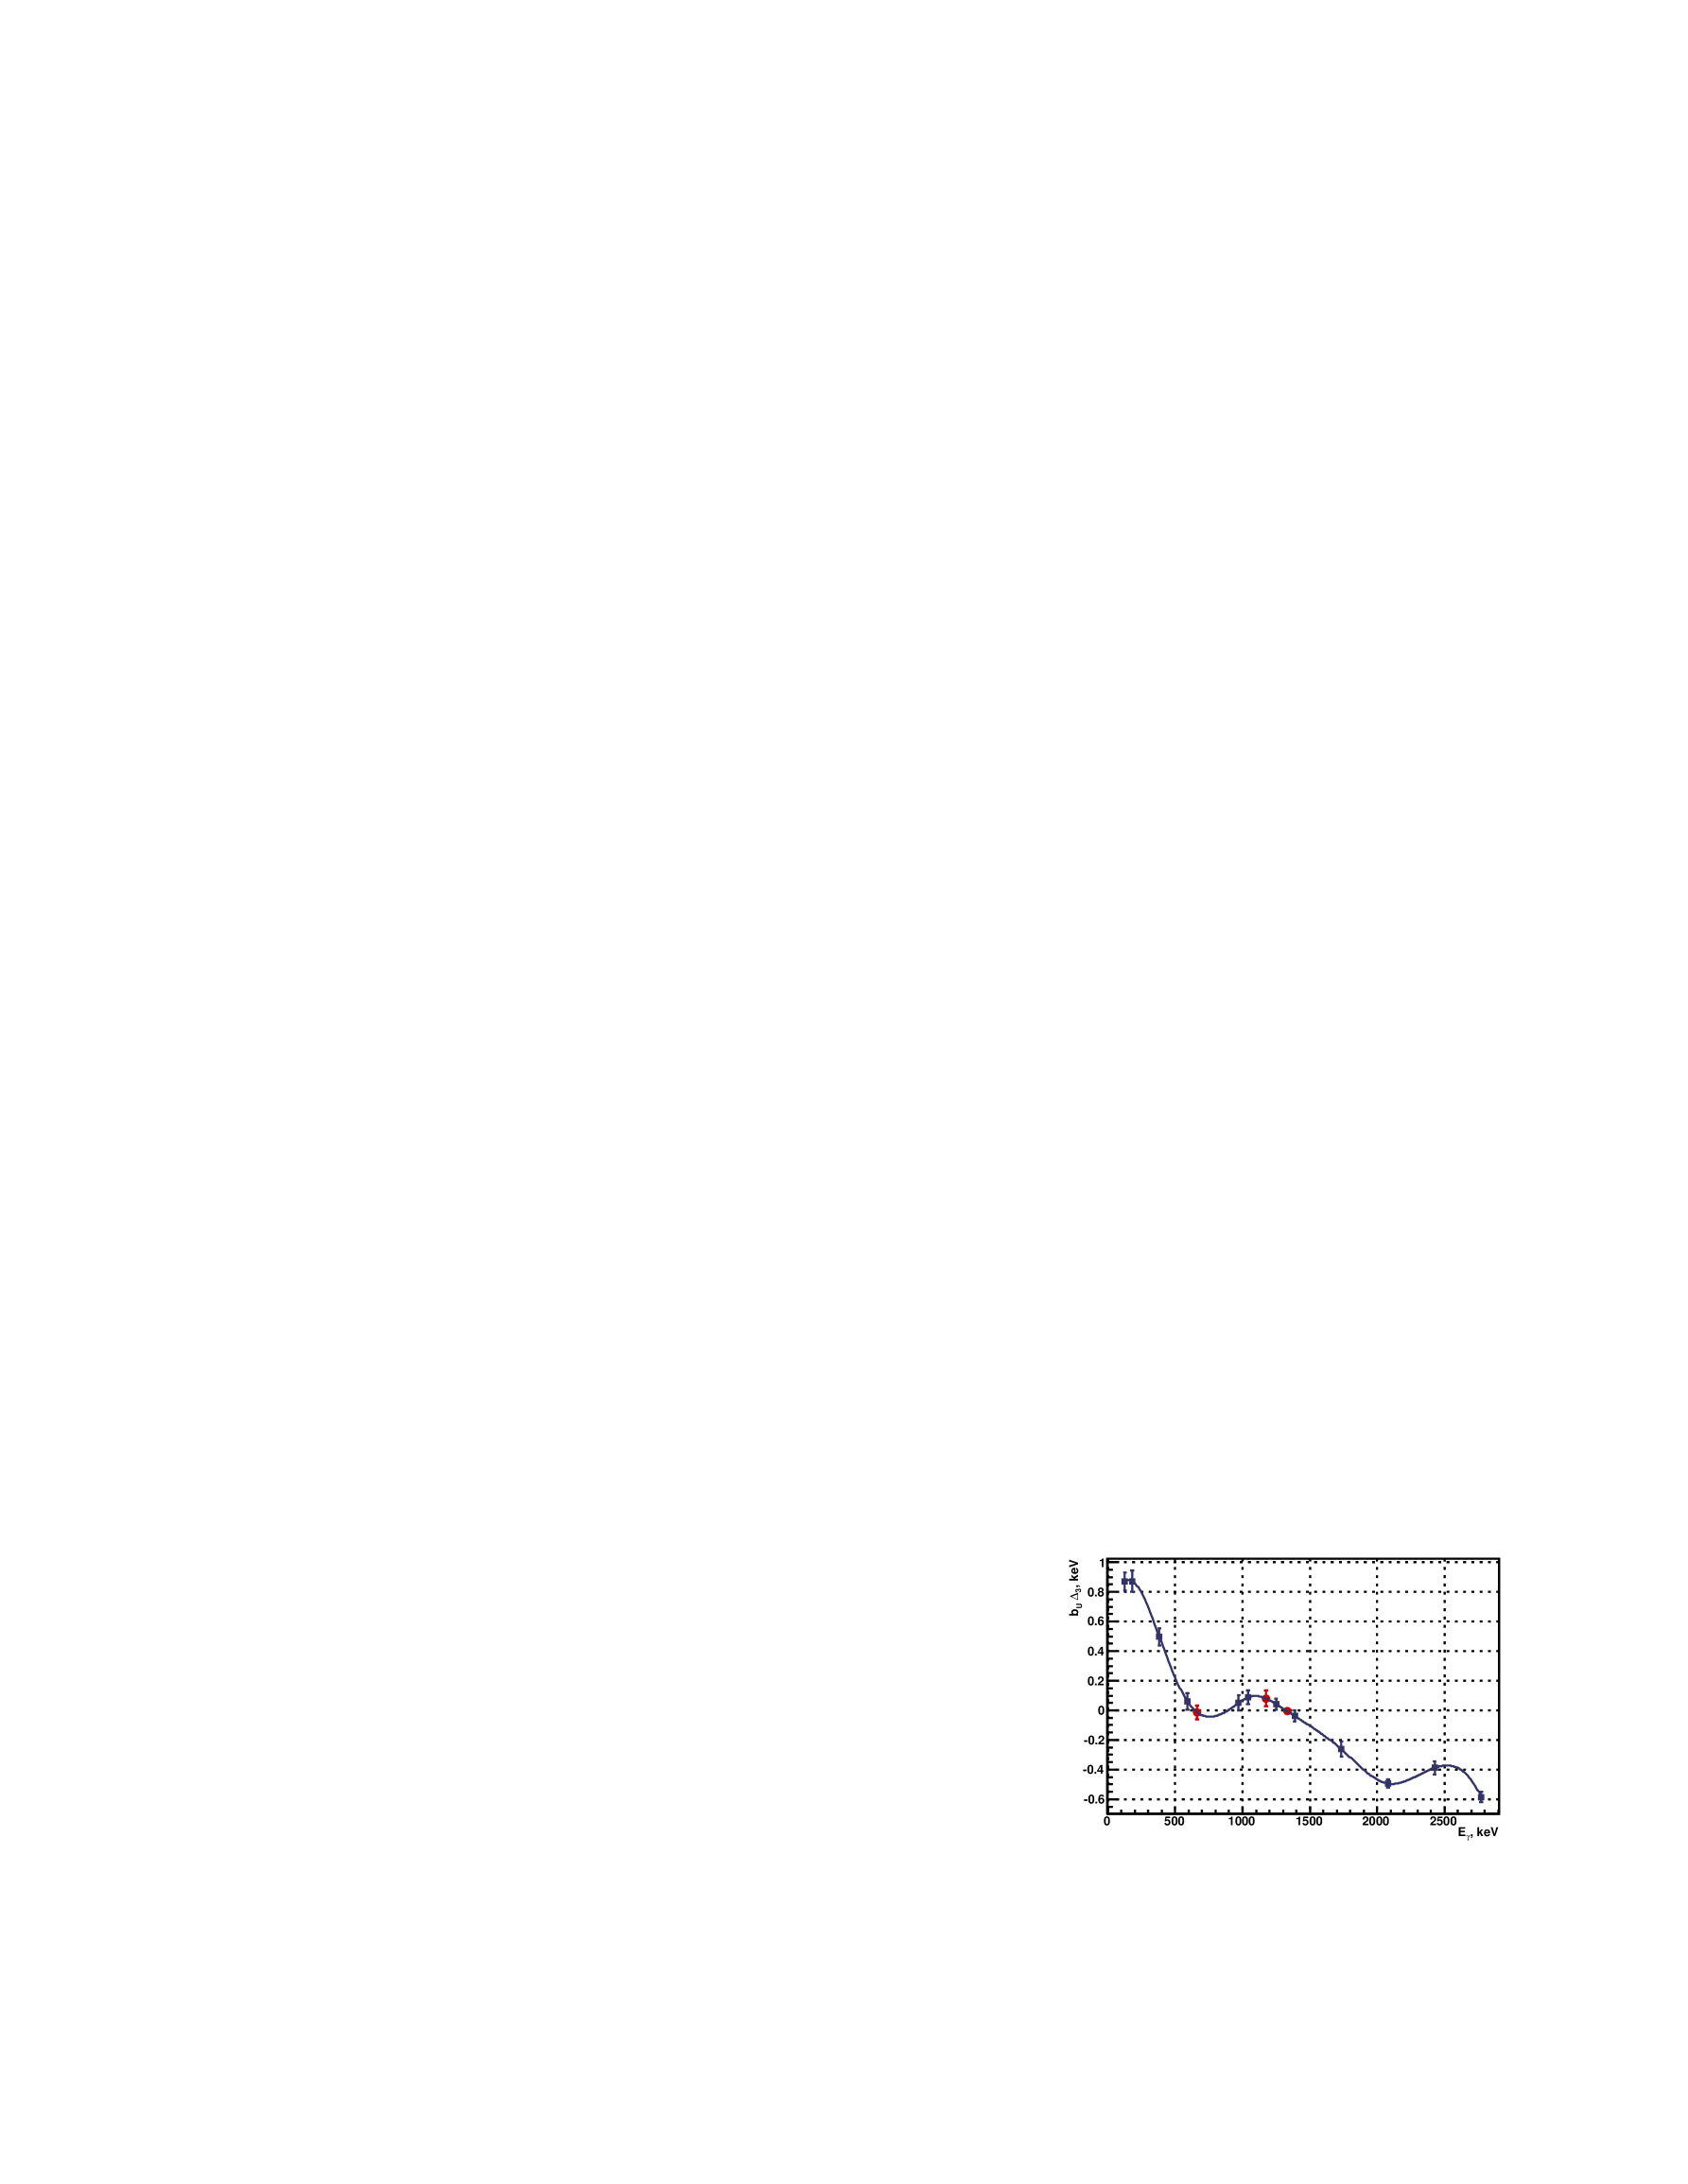
(12) The dependence of MCA nonlinearity on photon energy is shown in Fig.11.
-
4.
Using the results of the isotope peak approximation, the energy dependence of the response function parameters , , and is determined.
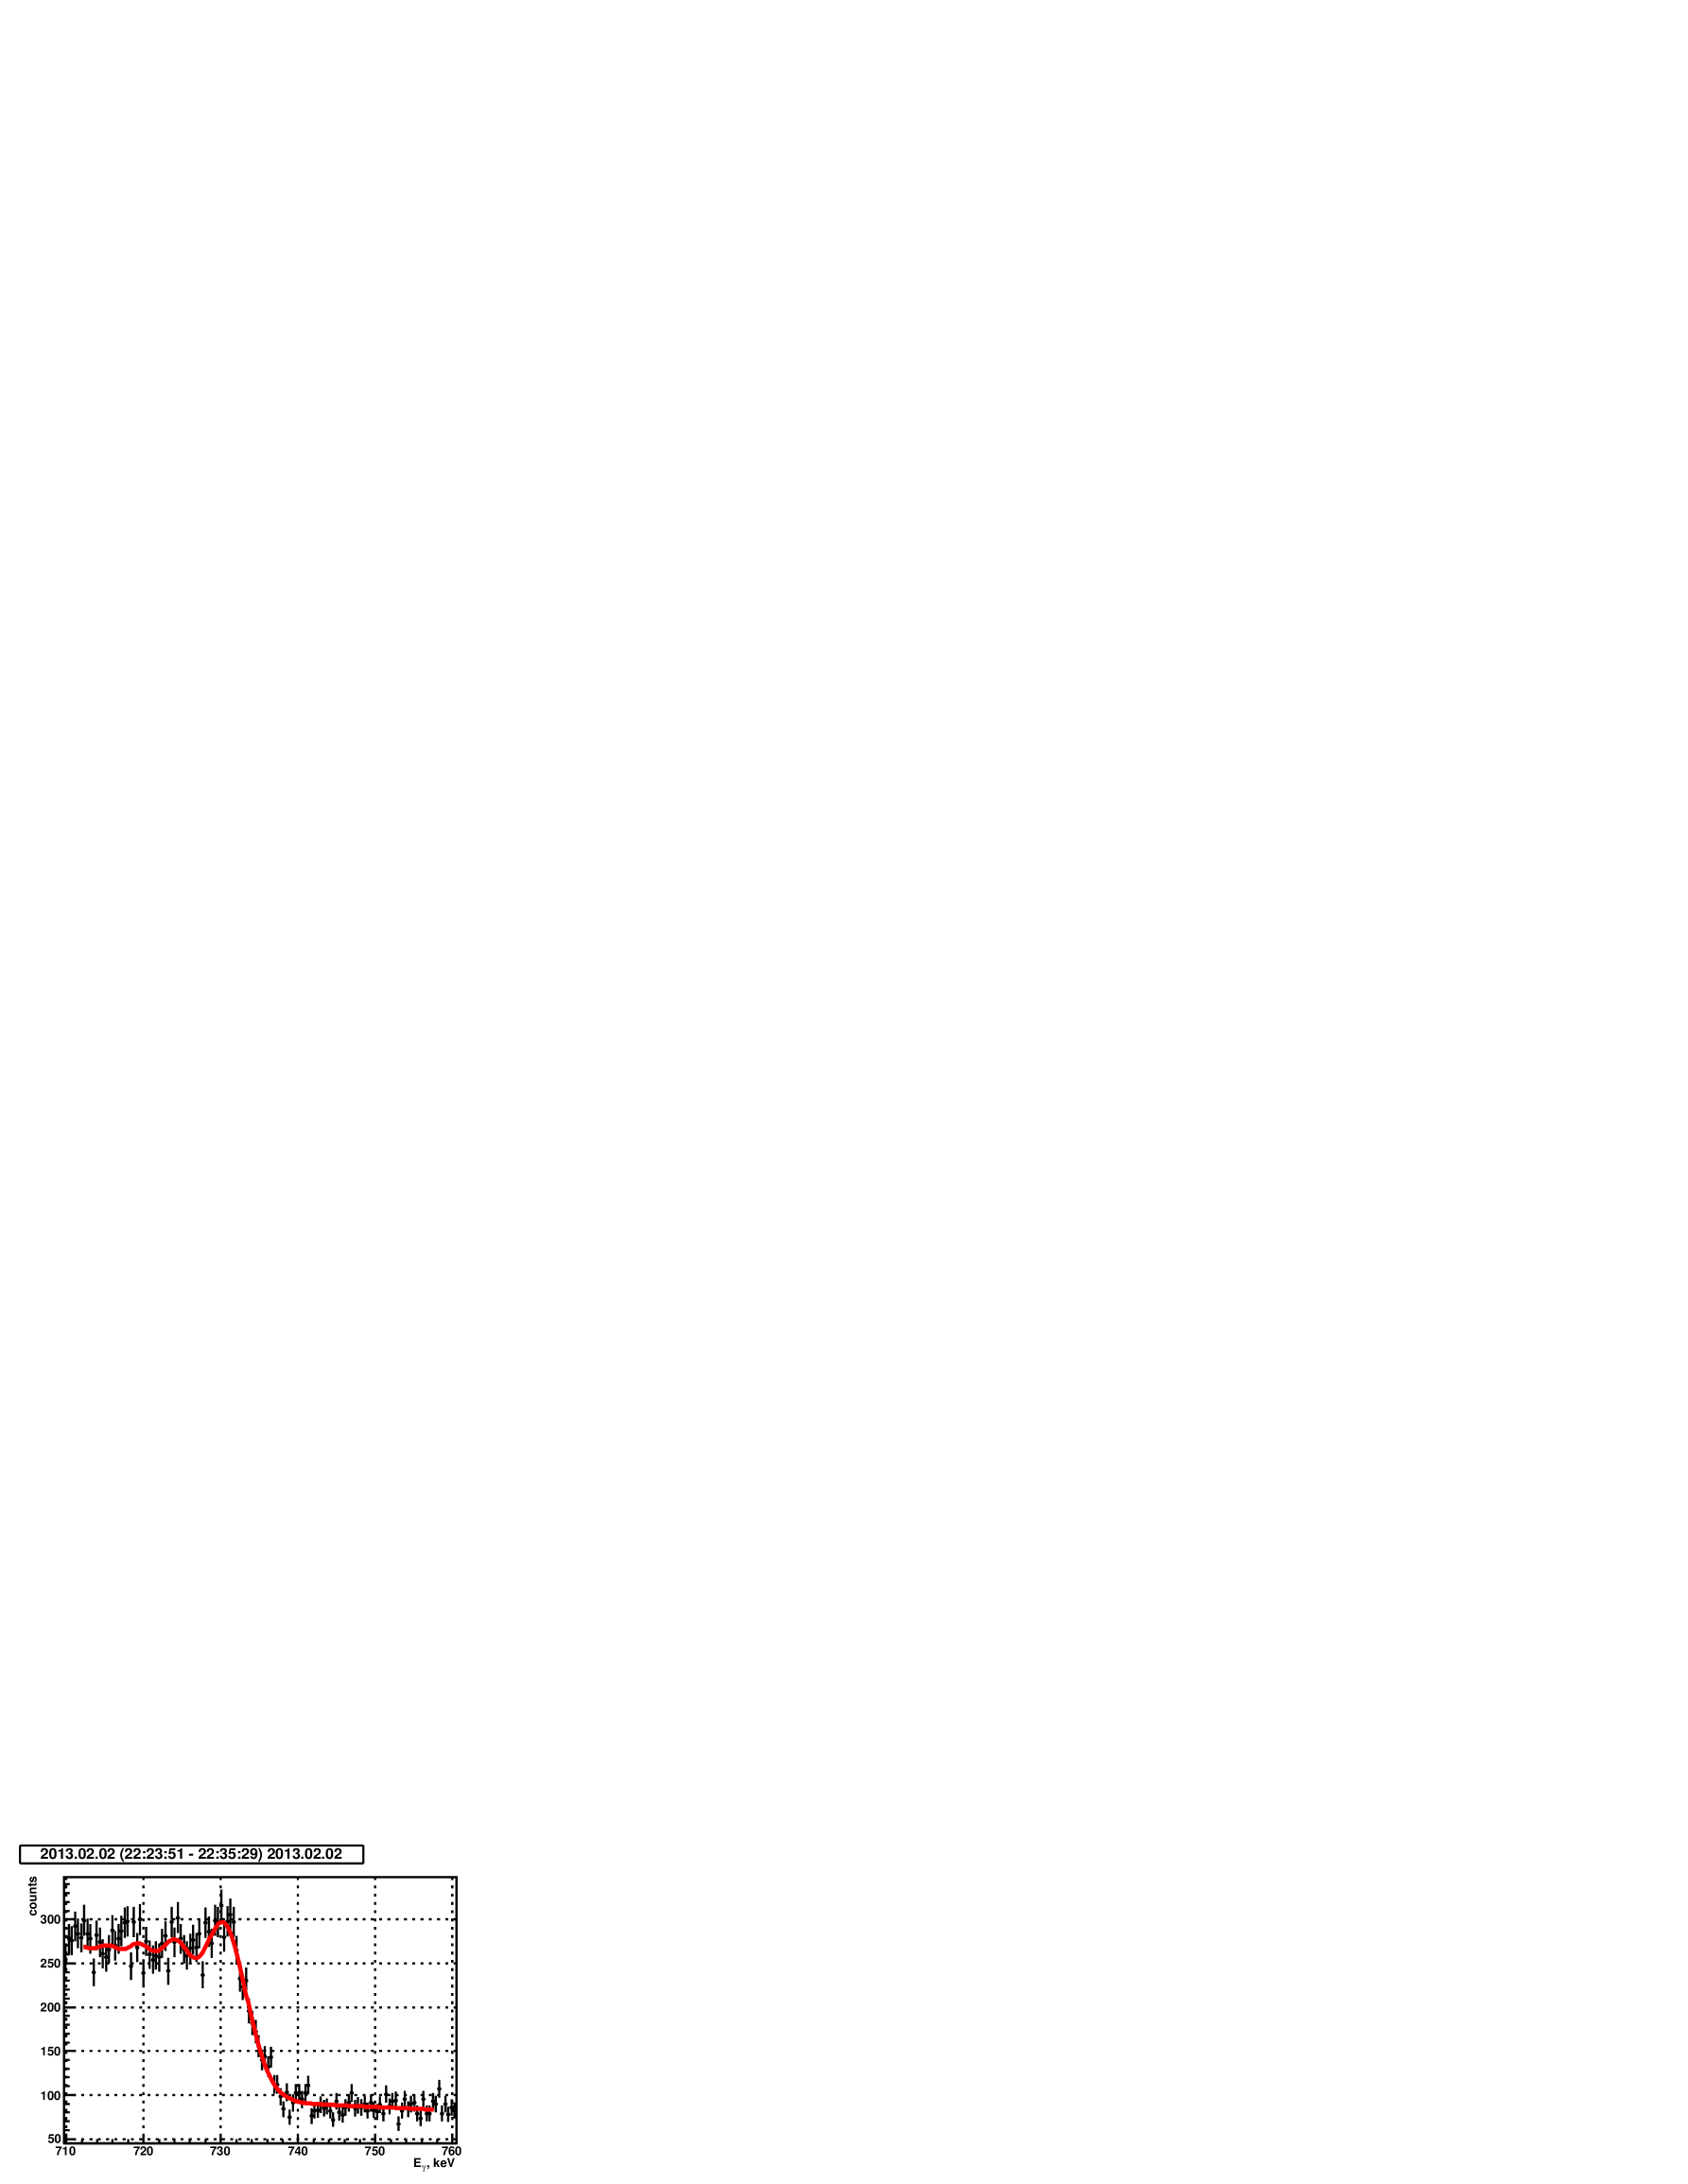
The edge of the backscattered photon spectrum (Fig.11) is fitted by the function:
| (13) |
where the function
| (14) |
approximates background and
| (15) |
is defined in Eq.(6).
5 Comparison of CBS measurements with the RD method
The beam energy determination using RD [9] is based on the relation between the electron energy and frequency of its spin precession during the motion of the particle in the transverse magnetic field with a revolution frequency :
| (16) |
where is the ratio of the anomalous and normal parts of the electron magnetic moment known with a relative accuracy of [14]. The frequency can be obtained through resonant depolarization of the polarized beam due to impact by an external electromagnetic field with a frequency such that
| (17) |
The relation (16) is violated in the presence of longitudinal magnetic fields. Therefore, to measure the energy of the VEPP-2000 by RD the collider focusing solenoids and solenoid of CMD-3 detector are swiched off. Measurements are carried out at two energy points close to 458 and 509 MeV.
The positron beam with the energy of 800 MeV is polarized due to the Sokolov-Ternov effect (radiation polarization) [15] in the booster of electrons and positrons (BEP, Fig.1). The time of polarization is about 50 minutes. During polarization the beam circulates in the booster for 2 hours. After that the beam energy is lowered to the value close to 485 or 509 MeV and the beam is injected to VEPP-2000. The positron beam is used for RD measurements, because positrons both in the booster and collider are circulating in the same direction. Therefore, after injection to VEPP-2000 the direction of the positron spin does not change due to radiation polarization, in contrast to electrons. Since the electron and positron beams circulate in the same vacuum chamber in the same magnetic field and in the absence of transverse electric fields, the results of depolarization for them are identical [16].
The destruction of polarization is provided by a high-frequency depolarizer based on striplines, which is installed in the injection section of VEPP-2000. In order to detect the moment of depolarization the process of intrabeam scattering (Touschek effect) is used. The cross section of the scattering of polarized electrons is smaller than for unpolarized ones. Therefore, after depolarization the number of particles scattered out of the beam rises. The scattered electrons are detected using the coincidence signal of two scintillation counters, installed in the internal and external parts of the VEPP-2000 straight section. While scanning the depolarizer frequency, an approximately 2.5 % rise of the counter counting rate is observed at the moment of polarization destruction. From the time of the counting rate change the value of the frequency is obtained and then, using Eq.(16) and Eq.(17), the beam energy is calculated.
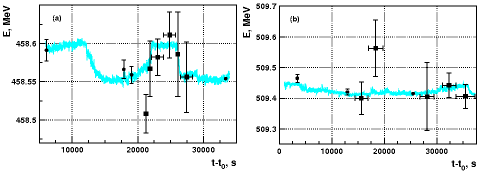
Four RD measurements were done at the beam energy 458 MeV (Fig.12(a)). Between RD measurements the electron beam was injected in VEPP-2000 and its energy was measured using the CBS method. The collider energy between RD calibrations was controlled by measuring fields in the bending magnets by NMR sensors. Currents in the dipole correctors were also taken into account. Using these data the collider energy was calculated:
| (18) |
where is the field in the VEPP-2000 ring, , is the energy obtained by RD, is the field value at the moment of depolarization. The values for different measurements are in statistical agreement. After averaging the relative statistical error of is about . The relative systematical error of was estimated taking into account unstability of the guiding magnetic field and presence of longitudinal magnetic fields. The dependence of energy on time (Fig.12) is due to a change of the dipole magnet temperature during operation of the complex.
The accuracy of the CBS measurement is estimated as
| (19) |
The values of for various measurements are in agreement and after averaging
| (20) |
Taking into account this deviation, the relative accuracy of the beam energy determination by the CBS method can be estimated as . Similar energy measurements at 509 MeV (Fig.12(b)) agree with this estimation.
6 Conclusion
The energy measurement system of the VEPP-2000 collider beam based on the Compton backscattering method was designed, constructed, and commissioned. The systematic error of the beam energy determination is tested by comparison with a measurement using the resonance depolarization method and is estimated as .
Acknowledgment
The authors are grateful to V.E. Blinov, S.I. Eidelman, A.G. Kharlamov, B.I. Khazin, S.I. Serednyakov, E.P. Solodov, Yu.A. Tikhonov, Yu.V. Usov for supporting the work and to P.L. Chapovsky, E.A. Sherbitsky and G.V. Tuliglovich for help in precise calibration of the laser wavelength. The work was supported by the Ministry of Education and Science of the Russian Federation, by the RF Presidential Grant for Scientific Schools NSh-6943.5320.2012.2 and by the RFBR Grants No 13-02-00418-a, No 11-02-00276-a.
References
- [1] D.E. Berkaev et al., Zh. Eksp. Teor. Fiz. 140 (2011) 247
- [2] V.V. Danilov et al., in Proc. EPAC’96, Barcelona, 1996, p.1149
- [3] T. Yamazaki et al., IEEE Trans. on Nucl. Sci., Vol. NS-32, No5, 1985, p.3406
-
[4]
Ian C. Hsu et. al., Nucl. Instr and Meth. A 384 (1997) 307;
Phys. Rev. E 54 (1996) 5657 -
[5]
R. Klein et al., Nucl. Instr. Meth. A 384 (1997) 293;
J. Synchrotron Rad. 5 (1998) 392 - [6] R. Klein et al., Nucl. Instr. Meth. A 486 (2002) 545
- [7] O.V. Anchugov et al., Zh. Eksp.Teor. Fiz. 136 (2009) 690 [J.Exp.Theor.Phys. 109 (2009) 590]
- [8] E.V. Abakumova et al., Nucl. Instr. Meth. A 659 (2011) 21
- [9] A.N. Skrinsky and Yu.M. Shatunov, Sov. Phys. Uspekhi 32 (1989) 548
- [10] O. Klein and T. Nishina, Z. Phys. 52 (1929) 853
- [11] E.V. Abakumova et al., Phys. Rev. Lett. 110 (2013) 140402
- [12] E.V. Abakumova et al., in Proc. of 18th Vacuum Congress, Phys. Proc. 32 (2012) 753
- [13] E.V. Abakumova et al., Vacuum Technic and Technology 20(2) (2010) 77 (in Russian)
- [14] J. Beringer et. al. (Particle Data Group), Phys. Rev. D86 (2012) 010001
- [15] V.N. Baier, Usp. Fiz. Nauk 105 (1971) 3
- [16] I.B. Vasserman et al., Phys. Lett. B198 (1987) 302