Constraints on the explosion mechanism and progenitors of type Ia supernovae
Abstract
Observations of SN 2011fe at early times reveal an evolution analogous to a fireball model of constant color. In contrast, our unmixed delayed detonations of Chandrasekhar-mass white dwarfs (DDC series) exhibit a faster brightening concomitant with a shift in color to the blue. In this paper, we study the origin of these discrepancies. We find that strong chemical mixing largely resolves the photometric mismatch at early times, but it leads to an enhanced line broadening that contrasts, for example, with the markedly narrow Si ii 6355 Å line of SN 2011fe. We also explore an alternative configuration with pulsational-delayed detonations (PDDEL model series). Because of the pulsation, PDDEL models retain more unburnt carbon, have little mass at high velocity, and have a much hotter outer ejecta after the explosion. The pulsation does not influence the inner ejecta, so PDDEL and DDC models exhibit similar radiative properties beyond maximum. However, at early times, PDDEL models show bluer optical colors and a higher luminosity, even for weak mixing. Their early-time radiation is derived primarily from the initial shock-deposited energy in the outer ejecta rather than radioactive decay heating. Furthermore, PDDEL models show short-lived C ii lines, reminiscent of SN 2013dy. They typically exhibit lines that are weaker, narrower, and of near-constant width, reminiscent of SN 2011fe. In addition to multi-dimensional effects, varying configurations for such “pulsations” offer a source of spectral diversity amongst SNe Ia. PDDEL and DDC models also provide one explanation for low- and high-velocity gradient SNe Ia.
keywords:
radiative transfer – hydrodynamics – supernovae: general – supernovae: individual: SN 2011fe, SN 2013dy – stars: white dwarfs1 Introduction
Supernovae (SNe) Ia likely result from the explosion of carbon-oxygen degenerate stars in binary systems (Hoyle & Fowler, 1960). At present, the explosion mechanism known as the delayed-detonation model seems to offer the best agreement with SN Ia observations, provided one varies the deflagration-to-detonation transition density to yield a range of i mass. Successes of this model include the reproduction of the observed range of peak luminosities; the correct stratification of chemical elements in the ejecta to match the spectral line widths of C, O, intermediate-mass elements (IMEs) and iron-group elements (IGEs); the proper correlation between maximum brightness and width of the light curve (Khokhlov et al., 1993; Hoeflich & Khokhlov, 1996; Hoeflich et al., 1996; Höflich et al., 2010); the diversity in maximum-light spectra from sub-luminous to “standard” luminosity events (Blondin et al., 2013). Modeling of X-ray spectra from SN Ia remnants provides independent support for this delayed-detonation mechanism (Badenes et al., 2006, 2008; Patnaude et al., 2012; Chiotellis et al., 2013).
In Dessart et al. (2013a, hereafter D13), we presented an investigation, probably not exhaustive, of critical ingredients for the radiative-transfer modeling of SN Ia ejecta until the onset of the nebular phase. Our work revealed the need to treat a variety of non-LTE processes that are crucial to obtain reliable temperature and ionization structures. With such ingredients included, it appears that one can capture the fundamental spectral characteristics of SNe Ia from 10 to +40 d after -band maximum, i.e., at least until the onset of the nebular phase. How well the delayed-detonation scenario reproduces the observed evolution of SNe Ia during their first week after explosion has been less studied. Interest in this question is warranted today by the novel observational constraints set by the nearby SN 2011fe (Nugent et al., 2011; Richmond & Smith, 2012; Parrent et al., 2012; Pereira et al., 2013).
The color and brightness of a SN Ia at early times may be affected in various ways, but the consensus is that it is controlled by i decay heating (Colgate & McKee, 1969; Arnett, 1982; Piro, 2012). Multi-D fluid instabilities inherent to combustion may produce a complex 3-D chemical distribution in the ejecta, and in particular mixing of i-rich material that could influence the outer ejecta (Gamezo et al., 2005), its heat content and therefore the SN Ia radiation at early times. In numerical simulations, ejecta asphericity seem further enhanced, perhaps unrealistically, by a non-spherical initiation of the explosion itself (Livne et al., 2005; Röpke & Hillebrandt, 2005).111Diversity in progenitor properties may also be relevant, e.g., peculiarities from the simmering phase, asphericity due to rotation, presence of an accretion disk etc. Such ejecta asphericities cause the SN radiation to be angle dependent, producing one possible explanation to SN spectral diversity (Kasen et al., 2009; Maeda et al., 2010). Observationally, SNe Ia exhibit diverse trajectories for the P-Cygni profile minima in velocity space, implying distinct recession velocities of SN Ia ejecta photospheres (Benetti et al., 2005; Blondin et al., 2012).
Early time observations are probably best to reveal the diversity of progenitor and explosion properties since early-time spectra and photometry should show signatures related to the companion star (Kasen, 2010), or the structure of the outer layers of the white dwarf as a result of a merger and/or complex accretion processes. However, there has been only a limited discussion in the literature concerning the specific behavior of delayed-detonation models at early times, and then they are usually limited to semi-analytical solutions for the luminosity (e.g., Piro 2012). Since SNe Ia may exhibit a “dark phase” (Piro & Nakar, 2013), there is also some tension in the explosion time inferred from observations and models (Mazzali et al., 2013), suggesting that such a fundamental quantity still retains some uncertainty even for the best observed Type Ia SN, SN 2011fe. For that SN, Röpke et al. (2012) primarily focus on the maximum-light spectrum to discriminate between explosion models. Previous time-dependent simulations of SNe Ia, generally performed using the Monte Carlo technique, typically adopt a modest maximum grid velocity of 25000 km s-1 (e.g., Kasen et al. 2009). This value is somewhat small for a radiative-transfer study at early post-explosion time, when the spectrum-formation region is located in the outermost ejecta layers. Poor photon statistics also impact the accuracy of predicted observables. This can prevent an assessment of the properties of weaker lines, such as C ii line emission/absorption (see, e.g., Sim et al. 2010) which can carry critical information on the explosion mechanism.
It is commonly assumed that the light-curve of Type Ia SNe is almost entirely controlled by i through heating of the ejecta — any observational signature of the initial temperature arising from the SN explosion being lost (before the ejecta is 1 day old) due to the large expansion rate. When there are discrepancies of the light-curve with observations, mixing or ejecta asymmetry is invoked. However it is necessary to consider whether the outer temperature of SN Ia ejecta could be larger than that generally obtained in standard explosions of Chandrasekhar-mass white dwarfs in hydrostatic equilibrium. In Nature, a larger progenitor radius (as in the extreme case of red-supergiant stars) can cause a SN to remain more luminous and relatively bluer for longer. In the case of a white dwarf, very large variations would be needed to sufficiently swell the star and quench cooling from expansion. Such modulations are therefore unlikely to be large enough to produce the desired effect. Instead, an attractive configuration is an explosion from a pre-expanded white dwarf or from a white dwarf with a buffer of mass around it, or similar configurations that may arise from a pulsation or from a binary merger. As we show in this paper, such configurations will alter in other ways the outer ejecta and offer an interesting means to generate spectral diversity from SN Ia models, even for a quasi spherical ejecta.
In the next section, we present the observational data we use to confront with our models. We then investigate the behavior of our delayed-detonation models at early times, and in particular discuss the ingredients that affect their properties (Section 3). The potential merits of pulsational-delayed detonation models are explored in Section 4. In this section we also compare the pulsational-delayed detonation models with observations of the type Ia SN 2011fe. We present the radiative properties that differ between pulsational-delayed detonation models and “standard” delayed-detonation models in Section 5. Finally, we present our conclusions in Section 6.
2 Sources of observational data
To test the broad compatibility of our cmfgen simulations we primarily compare them to the multi-epoch observations of SN 2011fe. We take the photometric data from Richmond & Smith (2012) and the observed spectra from Pereira et al. (2013). As in Nugent et al. (2011), we assume no reddening and adopt a distance modulus of 29.04 mag (Shappee & Stanek, 2011). We use the host-galaxy redshift of 0.00089 quoted by NED ( km s-1 from the Updated Zwicky Catalogue; Falco et al. 1999). We adopt the inferred explosion time of Nugent et al. (2011), namely MJD 55796.687.
For some comparisons we also use observational data for SN 2002bo from Benetti et al. (2004), and for SN 2005cf from Garavini et al. (2007) and Bufano et al. (2009).
| Model | M(i) | Start time | Decay chains | |
| [M⊙] | [d] | [km s-1] | ||
| DDC10_M0 | 0.623 | 1 | i only | 0 |
| DDC10_M1 | 0.623 | 1 | i only | 250 |
| DDC10_M2 | 0.623 | 1 | i only | 500 |
| DDC10_M3 | 0.623 | 1 | i only | 1000 |
| DDC10_M4 | 0.623 | 1 | i only | 1500 |
| DDC10_T1D0 | 0.623 | 1 | i only | 500 |
| DDC10_T0D2 | 0.623 | 0.5 | 1-step & 2-step | 500 |
3 Early-time behavior: Dependencies
The procedure used to compute SN light curves and spectra with cmfgen has been described numerous times (Dessart et al., 2012; Hillier & Dessart, 2012; Dessart et al., 2013b, c) and will not be repeated here. In this work on SNe Ia, we use the same approach as discussed in Blondin et al. (2013) and D13. Model atoms used are A1 up to the peak and A4 beyond (see appendix of D13).
In cmfgen, we adopt a time step equal to 10% of the current time, and generally start the simulations at about 1 d. The problem is that the initial relaxation from the initial model takes a few time steps, and thus compromises the reliability of our models at 1 d (this relaxation is unavoidable because we start from a pure hydro model etc.). This is problematic if we want to compare our models to early-time observations of SN 2011fe. We therefore start most of the cmfgen simulations in this work at 0.5 d after explosion. When showing results, we omit the first computed time steps to skip the “relaxation” stage.

Because the photosphere (defined as the location where the Rosseland-mean optical depth integrated inward from the outermost shell is 2/3) is located at very large velocities at early times we extend the ejecta grid from 40000 km s-1 to 70000 km s-1 using a linear extrapolation of all fluid quantities. This may seem very large, but UV photons still interact with the SN ejecta at velocities 40000 km s-1 at 0.5 d. In model DDC10, the photosphere is, however, at 25000 km s-1 at 0.5 d, 21000 km s-1 at 1 d, and 18000 km s-1 at 2 d after explosion.222If we were to adopt the flux mean opacity the photosphere would be at slightly larger radii So, the bulk of the radiation emerges from layers that were optically thick at the time of explosion, at 0.04 M⊙ below the white dwarf surface, and thus well described by the hydrodynamical code. Extrapolation is not ideal but too little is accurately known about the explosion to make a better guess on the properties of these outer regions. Overall, the study of SNe Ia at the earliest times is problematic because the properties will depend strongly on the initial conditions, at the time of explosion, which are very poorly known. Further, the outermost regions, which contain very little mass, are usually not treated accurately in hydrodynamical simulations. The inadequacy in the density slope at large velocity is noticeable through the width of the strongest lines, e.g., the Ca ii 8500 Å triplet, which tend to be much too broad in all our models at early times. Hence, what is likely to be in error at the earliest times in our calculations is spectral regions influenced by strong line transitions.
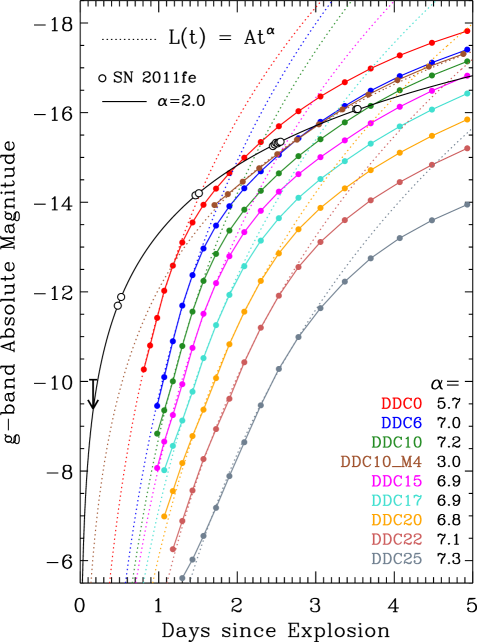
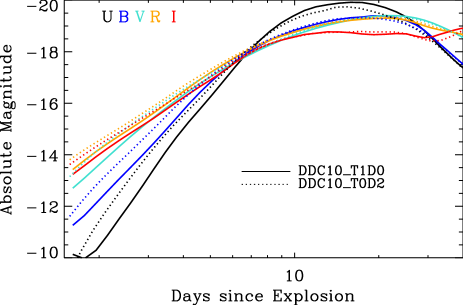
The delayed-detonation models (named DDC) presented in Blondin et al. (2013), which cover i masses in the range 0.12–0.87 M⊙, were previously used to compare to radiative properties of SNe Ia at bolometric maximum. Because these simulations were all initiated at 0.5 d after explosion, we can compare their pre-peak properties to those of SN 2011fe. We find that the explosion models are extremely faint for 1–2 d after explosion and fainter than the pre-discovery brightness limit for SN 2011fe (Fig. 1). In addition, the models are systematically redder in color and their brightening rate in all optical and near-IR bands is steeper than observed for SN 2011fe (Fig. 1). Shifting the observations in time by a day, as done by Mazzali et al. (2013), changes significantly the magnitude of the offset in brightness and color at such early epochs, although a discrepancy with observations remains.
In all our DDC models, decay energy from i, which causes heating at and below the photosphere, systematically leads to a hardening of the radiation as the SN brightens. As a result, none of our delayed-detonation models behaves like a fireball, as observed for SN 2011fe (Nugent et al., 2011). In contrast, they get considerably bluer as they rise to bolometric maximum, and the rate of change of that color is greater at earlier times. This property of our current set of DDC models is robust and holds irrespective of i mass.
To investigate the cause of the discrepancies we study which variations in ejecta properties can alter the early-time color evolution of our delayed-detonation models. We first explore the effects of chemical mixing (Section 3.1). We then consider the influence of treating additional decay routes, other than the i decay chain generally treated (Section 3.2). Some properties of these “test” models are given in Table 1, while the ejecta properties of DDC models are given in Table 2.
3.1 Influence of radial mixing
Delayed detonations in three dimensions reveal the presence of large and small scale structures, both in the lateral and vertical directions, with significant macroscopic mixing of fuel and ashes (Gamezo et al., 2005). When averaged over angle, the multi-dimensional structure is reflected primarily through a radial mixing: C and O are advected inwards to lower velocities, while IMEs and IGEs tend to occupy a much broader region in velocity space.
As cmfgen is a one-dimensional radiative-transfer code it is not possible to address directly the multi-dimensional nature of the explosion mechanism, nor the multi-dimensional effects associated with the radiative transfer. However we can apply radial mixing, thereby capturing the main feature of multi-dimensional explosion simulations. This trick has beed used for 1D radiative-transfer modelling of core-collapse SNe (Blinnikov et al., 2000) and, in particular, type Ib SNe (Lucy, 1991; Dessart et al., 2012).
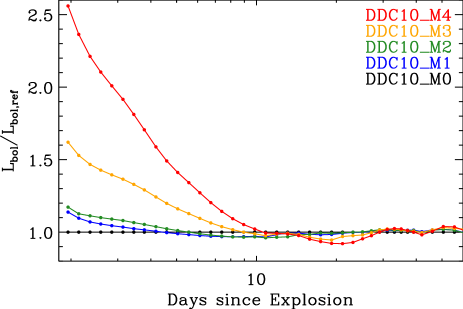
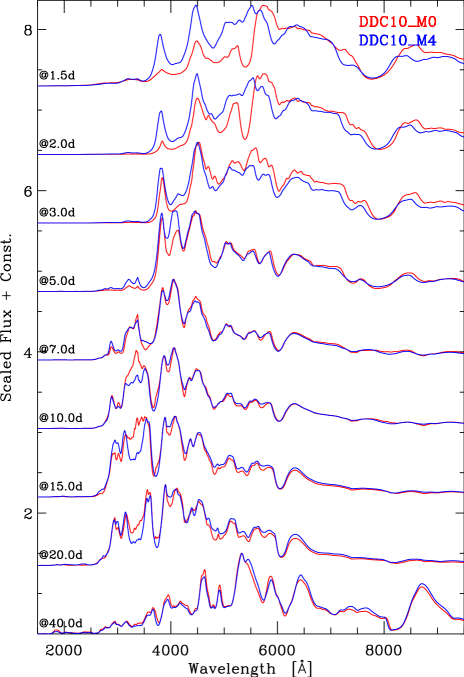
We test the effect of mixing by running additional sequences in which only the starting conditions are modified. Namely, in models DDC10_MX (X between 1 and 4), the chemical structure of model DDC10 is (microscopically) mixed at 100 s after explosion using a characteristic velocity width of 250, 500, 1000, 1500 km s-1 (Fig. 2). In practice, we progress from the innermost to the outermost ejecta location and make homogeneous all mass shells within a velocity of the local mass shell.333As we progress outwards, we mix already mixed material. Thus the effect of the adopted algorithm is to smooth over a velocity range much larger than the characteristic velocity width. This softens the composition gradients considerably, but leaves the density structure intact, and makes all species present to some extent at all depths for the two models with the highest mixing efficiencies.
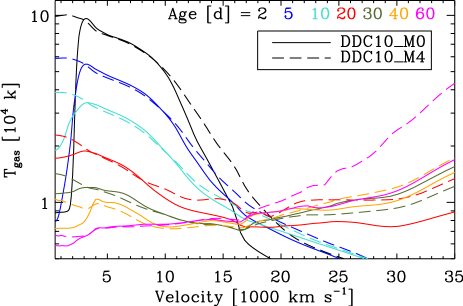
In our simplistic approach radial mixing applies to all species. However, the main effect results from mixing i into high velocity regions where the original DDC10 model produced little or no i. In our most extreme model, DDC10_M4, mixing leads to the presence of i all the way to the inner ejecta shell, causing heating in the regions below 2000 km s-1 (the location of the i hole in the DDC10_M0 model). The contrast with DDC10_M0 is strong early on (these test models have a start time of 1 d after explosion), but as time progresses, heat diffuses into the hole in DDC10_M0 and non-local decay-energy deposition strengthens, so that the mixed and unmixed models show more comparable temperatures in this region after bolometric maximum.
Radial mixing influences the bolometric light curve, although the effect is significant only for the strongest mixing efficiency. The effect is strongest at the earliest times when the SN is very faint (e.g., the SN is 1000 times fainter at 1 d than at bolometric maximum). and remains visible until a week after explosion (Fig. 3). This corresponds to epochs when the photosphere is located at a larger velocity and is also hotter in mixed models. The i mass fraction is on the order of 0.01 at 15000 km s-1 and effectively zero beyond 20000 km s-1 in model DDC10_M0. Mixing causes an enhancement of a factor of a few at 15000 km s-1, and much larger (fractional) enhancements at larger velocities. Although the amount of i mass mixed to higher velocities is small it has a very significant effect on the early light curve because the SN is very faint.
In mixed models, the increase in line blanketing is compensated by the sizable increase in temperature, while the larger outer ejecta optical depth pushes the spectrum formation region out to larger velocities. The larger IME mass fraction (from chemical mixing of IMEs) contributes to making a broader Si ii 6355 Å and enhanced blanketing in some regions, e.g., by Fe ii in the band at 3 d (Fig. 3). Beyond bolometric maximum, the SN Ia radiative properties become insensitive to our adopted mixing. This is easily explained. At advanced times, all photon ( or optical) mean free paths become large, making the transport of energy non local. We are therefore not seeing a restricted ejecta shell but instead a large ejecta volume, with emission biased towards the hottest and densest parts. These layers are essentially cobalt and iron, and the lack of strong chemical stratification there makes this region weakly sensitive to mixing.
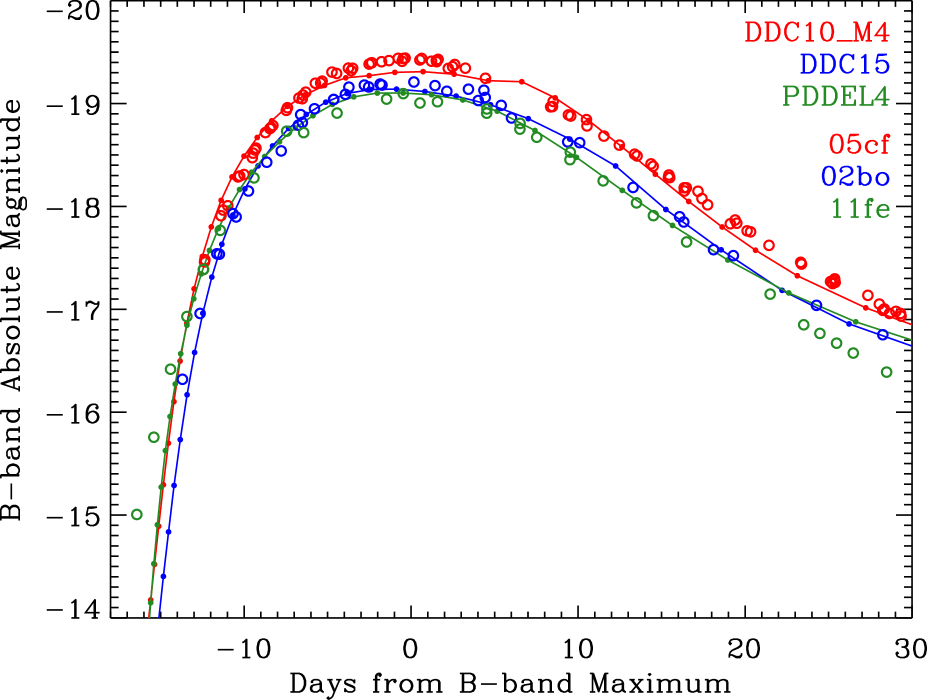
When compared to the -band light curve for three observed SNe (2002bo, 2005cf, and 2011fe), model DDC10_M4 shows a reasonable match to the overall rise to peak (Fig. 4; see also Fig. 1; additional models are also overlaid and will be discussed in Section 5). However, at the earliest times, the model is significantly fainter than SN 2011fe, even though model DDC10_M4 has 0.65 M⊙ of i compared to 0.53 M⊙ inferred for SN 2011fe (this work; see also, e.g., Pereira et al. 2013). Here, we have shifted the model by d, and it is clear that a slight mismatch in the inferred explosion time (or in the rise time) translates into a potentially large magnitude offset at the earliest times, when the SN brightness is predicted to steeply rise. Even with allowance for a time shift (see, e.g., Mazzali et al. 2013), SN 2011fe brightens along a flatter slope than model DDC10_M4. SN 2011fe also has a markedly flatter brightening slope than SNe 2002bo or 2005cf at comparable pre-maximum epochs. The recent observations of SN 2013dy (Zheng et al., 2013) further support the existence of a photometric diversity at early times. Lacking a physical basis in SNe Ia, it is of no surprise that the fireball model is not universal, but merely coincidental in SN 2011fe.
The relatively bluer colors of model DDC10_M4 correspond to spectra that are still too red compared to early-time observations of SN 2011fe, although the discrepancy is much reduced compared to unmixed models (Figs. 1 and 5). By 5 d after explosion, model DDC10_M4 follows with good fidelity the spectral color and morphology, and continues to do so beyond maximum (we show this comparison despite the 0.15 M⊙ difference in i mass for the model and this SN). Notable exceptions are the Ca ii lines and Si ii 6355 Å which are systematically broader than observed at all times. The velocity structure of this delayed-detonation model is not suitable for an event like SN 2011fe. Despite these various discrepancies, the fundamental properties of this DDC10_M4 model are in fair agreement with those of SN 2011fe, since no tinkering is applied to the ejecta properties (density, velocity, temperature, composition) throughout the time sequence (and the choice of model atoms is the only freedom in the cmfgen simulation; D13).
To conclude, we find that strong mixing has an influence on both the photometric and the spectroscopic properties of our SN Ia models. Mixing can cause the SN luminosity to increase by a factor of a few and the color to harden in the optical for up to a few days after explosion. With strong mixing our DDC10 model is in fair agreement with the observed color of SN 2011fe. However, our DDC models tend to show broad lines, and mixing tends to exacerbate this property. As a result, mixing would tend to favor the production of high-velocity-gradient (HVG) SNe Ia, although this classification tends to be based on times around and beyond bolometric maximum (Benetti et al., 2005). Overall, model DDC10, and in particular its strongly mixed variants, show broader lines than observed in SN 2011fe, or SN 2005cf (see D13). Mixing can provide a source of SN Ia spectral diversity. For example, it can modulate the trajectory of absorption maxima at early times in Si ii 6355 Å (Fig. 3).
3.2 Influence of decay chains included
Because of the prevalent role of i and o in controlling SN Ia radiative properties, the general custom is to include only the decay chain associated with these two unstable nuclei in SN Ia simulations. In reality, SN Ia explosions produce a variety of unstable nuclei, either IMEs or IGEs, present in the inner or outer ejecta, and taking part in two-step or one-step decay chains. These nuclei show a range of decay lifetimes, from less than a day to years, and can thus influence SN Ia ejecta on very different time scales.
Here, we improve the consistency of our simulations with a more complete treatment of decay chains. The lifetimes, -ray energies and probabilities, and electron-positron emission associated with all such decays are given in the appendix in Tables 3–5. Besides their impact on the internal energy of the gas, these decays modify the composition and can alter the line-blanketing properties of the ejecta. As discussed in D13, the decay chain associated with the parent nucleus r is the cause of a 100-fold increase in Ti mass fraction in the spectrum formation region beyond light curve peak, causing enhanced line blanketing.
| Model | i | Ni | Co | Fe | Ti | Ca | Si | Mg | O | C | ||||
|---|---|---|---|---|---|---|---|---|---|---|---|---|---|---|
| [] | [B] | [km s-1] | [M] | [M] | [M] | [M] | [M] | [M] | [M] | [M] | [M] | [M] | [d] | |
| PDDEL12 | 1.0(7) | 1.262 | 1.11(4) | 0.253 | 0.268 | 1.88(-2) | 0.101 | 2.37(-5) | 4.56(-2) | 0.489 | 4.21(-3) | 0.103 | 2.11(-2) | 17.24 |
| PDDEL11 | 1.1(7) | 1.236 | 1.14(4) | 0.299 | 0.312 | 2.17(-2) | 0.102 | 2.52(-5) | 4.91(-2) | 0.441 | 2.82(-3) | 7.98(-2) | 2.00(-2) | 16.49 |
| PDDEL9 | 1.3(7) | 1.342 | 1.18(4) | 0.408 | 0.416 | 2.85(-2) | 0.105 | 3.10(-5) | 5.50(-2) | 0.386 | 2.44(-3) | 7.24(-2) | 1.94(-2) | 16.08 |
| PDDEL4 | 1.5(7) | 1.344 | 1.22(4) | 0.529 | 0.530 | 3.58(-2) | 0.108 | 3.43(-5) | 5.40(-2) | 0.307 | 1.64(-3) | 4.70(-2) | 1.85(-2) | 16.60 |
| PDDEL7 | 1.6(7) | 1.336 | 1.25(4) | 0.604 | 0.602 | 4.02(-2) | 0.107 | 3.07(-5) | 5.03(-2) | 0.258 | 1.52(-3) | 4.34(-2) | 1.79(-2) | 17.65 |
| PDDEL3 | 1.8(7) | 1.353 | 1.26(4) | 0.685 | 0.680 | 4.51(-2) | 0.107 | 3.01(-5) | 4.64(-2) | 0.218 | 1.46(-3) | 4.04(-2) | 1.77(-2) | 18.21 |
| PDDEL1 | 2.0(7) | 1.398 | 1.28(4) | 0.758 | 0.751 | 4.95(-2) | 0.107 | 2.99(-5) | 4.23(-2) | 0.190 | 1.48(-3) | 3.99(-2) | 1.73(-2) | 18.18 |
| Model | i | Ni | Co | Fe | Ti | Ca | Si | Mg | O | C | ||||
| [] | [B] | [km s-1] | [M] | [M] | [M] | [M] | [M] | [M] | [M] | [M] | [M] | [M] | [d] | |
| DDC25 | 8.0(6) | 1.185 | 8.49(3) | 0.119 | 0.142 | 9.69(-3) | 9.80(-2) | 1.13(-4) | 2.41(-2) | 0.485 | 3.72(-2) | 0.283 | 2.16(-2) | 19.82 |
| DDC22 | 1.1(7) | 1.345 | 9.80(3) | 0.211 | 0.231 | 1.59(-2) | 0.107 | 1.17(-4) | 4.15(-2) | 0.483 | 2.57(-2) | 0.209 | 8.26(-3) | 17.49 |
| DDC20 | 1.3(7) | 1.442 | 1.03(4) | 0.300 | 0.315 | 2.15(-2) | 0.110 | 1.12(-4) | 4.72(-2) | 0.426 | 2.10(-2) | 0.170 | 5.12(-3) | 17.21 |
| DDC17 | 1.6(7) | 1.459 | 1.08(4) | 0.412 | 0.421 | 2.84(-2) | 0.112 | 1.14(-4) | 4.73(-2) | 0.353 | 1.79(-2) | 0.152 | 3.80(-3) | 17.24 |
| DDC15 | 1.8(7) | 1.465 | 1.12(4) | 0.511 | 0.516 | 3.44(-2) | 0.114 | 1.11(-4) | 4.53(-2) | 0.306 | 1.14(-2) | 0.105 | 2.73(-3) | 17.09 |
| DDC10 | 2.3(7) | 1.520 | 1.16(4) | 0.623 | 0.622 | 4.11(-2) | 0.115 | 1.10(-4) | 4.10(-2) | 0.257 | 9.95(-3) | 0.101 | 2.16(-3) | 17.69 |
| DDC6 | 2.7(7) | 1.530 | 1.20(4) | 0.722 | 0.718 | 4.72(-2) | 0.116 | 1.07(-4) | 3.52(-2) | 0.216 | 7.28(-3) | 8.35(-2) | 1.81(-3) | 18.03 |
| DDC0 | 3.5(7) | 1.573 | 1.29(4) | 0.869 | 0.872 | 5.58(-2) | 0.102 | 1.17(-4) | 2.49(-2) | 0.160 | 3.58(-3) | 5.18(-2) | 1.20(-3) | 17.67 |
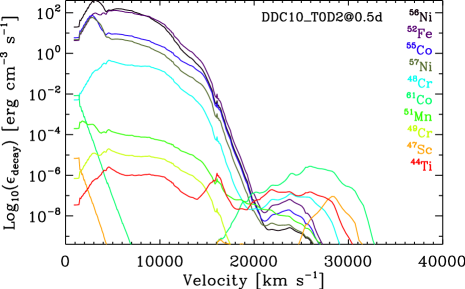
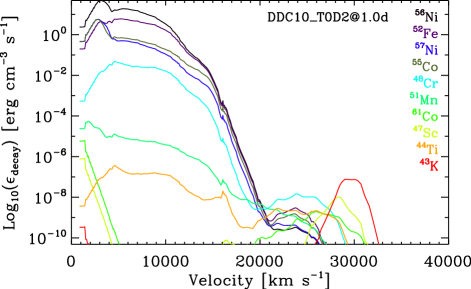
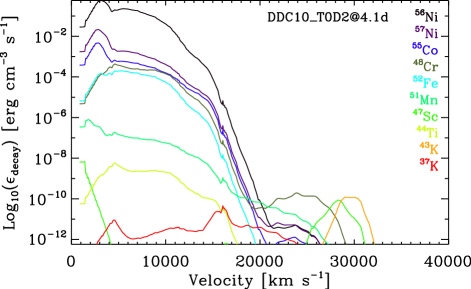
We thus run some variants of model DDC10 in which different sets of decay chains are treated, corresponding to simulations with suffix “D”. Simulations that include the i two-step decay chain only are named “D0”. Simulations that include all two-step decay chains have suffix “D1” (see D13). Simulations that include all fifteen decay chains (six one-step chains and nine two-step chains) have suffix “D2”. When suffix “T” is specified, “T0” refers to time sequences started with cmfgen at 0.5 d and suffix “T1” refers to sequences started at 1 d after explosion.
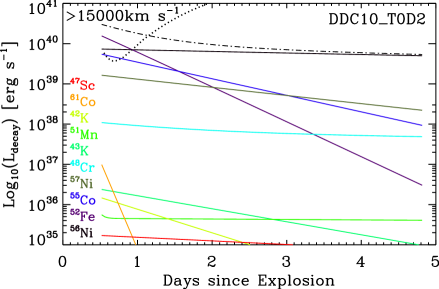
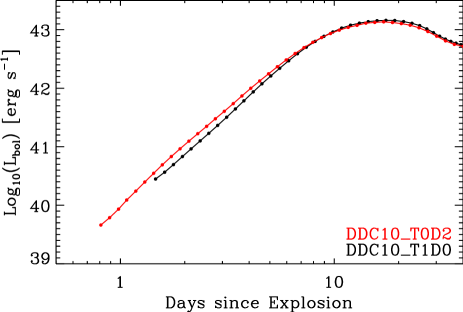
At early post-explosion times, we find that numerous chains contribute more energy than that of i, in particular in the outer ejecta, above 15000-20000 km s-1 where i is under-abundant (Fig. 6). We find that the chains associated with , , o, and r dominate the decay energy above 20000 km s-1 at 1 d. By 4 d after explosion, the same regions are primarily influenced by the decay of , r, and c. At smaller velocities, besides i, we find e, o, and i. Despite the treatment of these additional contributions in cmfgen, the resulting synthetic spectra change little, and thus remain quite red (Fig. 7). The main effect is a global brightening in all bands with a slight hardening of the spectrum. For example, for model DDC10_T0D2 compared to model DDC10_T1D0. goes from 2.0 to 1.7 mag at 2 d, which corresponds to a 0.3 mag shift only. At bolometric maximum, the -band flux offset is caused by enhanced blanketing from Ti, whose mass fraction is increased 100-fold in model DDC10_T0D2 through the decay of r (D13). Overall, extra decays induce too small a correction to the DDC10 model to bring it into agreement with the observations of SN 2011fe.
Up to 10 d after explosion, we assume local energy deposition because the bulk of radioactive decays occurs at high optical depth where the -ray mean free path is small compared to the size of the SN ejecta. Indeed, allowing for non-local energy deposition earlier on in cmfgen causes only minute alterations to the line profile morphology and no change in color or luminosity in our models. SN 2011fe, which is more luminous and bluer that any of our DDC models at 1-2 d after explosion (Fig. 1), is typically sub-luminous at peak (Röpke et al., 2012), so the i should be buried somewhat deep in the ejecta, hence unlikely to affect drastically the outer ejecta layers at 1 d. One is thus led to question whether 56Ni is the only quantity controlling the SN Ia radiation properties at the earliest times.
4 Pulsational-delayed detonation models of SNe Ia
In this section we discuss the potential merits of the pulsational-delayed detonation model to explain a number of SN Ia properties, in particular those that we do not reproduce satisfactorily with the “standard” delayed-detonation model.444It is unfortunately not possible at present to discuss the “universal” radiative properties of a given explosion model because many differences are in fact tied to the radiative-transfer treatment. For example, Sim et al. (2013) find fundamental problems with the “standard” delayed detonation model of SNe Ia, while for similar models, D13 find a promising agreement with observations suggestive of the broad adequacy of that explosion configuration. This explosion configuration in a Chandrasekhar mass white dwarf has been previously studied in Hoeflich et al. (1996) and confronted with observed SN Ia light curves.
For this work, we produce pulsational-delayed detonations somewhat artificially. We first initiate a deflagration in a Chandrasekhar-mass white dwarf. After a modest expansion of the white dwarf, we stop nuclear burning. Upon the subsequent infall and compression of the white dwarf material that is still bound, a detonation is initiated at a prescribed transition density, whose value is tuned to produce ejecta with a different i mass. Importantly, the material that becomes loosely bound during the first deflagration expands sufficiently to avoid burning by the subsequent detonation. This allows more carbon to remain unburnt compared to the “standard” delayed-detonation scenario, which generally leaves no unburnt material at all (Khokhlov, 1991).
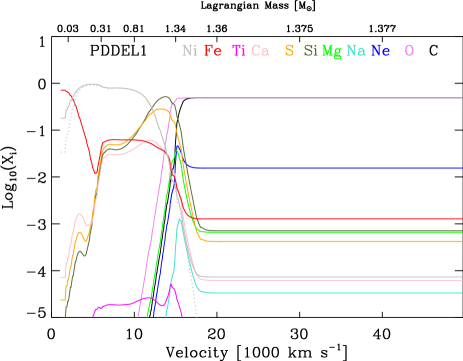
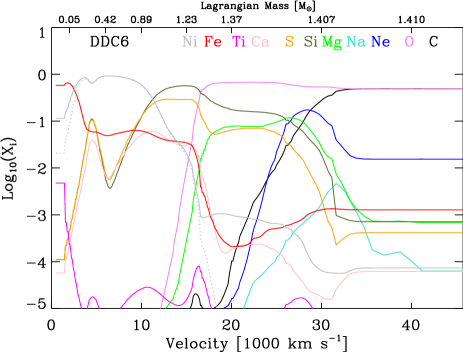
Pulsational-delayed-detonation models correspond to the PDDEL sequence, which is composed of individual models named PDDELm with m being 1, 3, 7, 4, 9, 11, and 12, in order of decreasing i mass, from 0.76 to 0.25 M⊙. Each model retains about 0.02 M⊙ of unburnt carbon, irrespective of i mass — the rest of the ejecta composition is typical of “standard” delayed-detonation models. Standard delayed-detonation models correspond to the DDC sequence (used here for comparison). It is composed of models whose properties at bolometric maximum are presented in Blondin et al. (2013). Individual model names are DDCn with n being 1, 6, 10, 15, 17, 20, 22, and 25, in order of decreasing i mass, from 0.87 to 0.12 M⊙. The mass of unburnt carbon in DDC models is typically a factor of 2–10 lower than in PDDELm models. We summarize the chemical yields of our pulsational-delayed-detonation models as well as those for the “standard” delayed-detonation models in Table 2. For all DDC and PDDEL simulations discussed in the next section, we apply the same mixing procedure (we use 400 km s-1) and account for the same set of decay chains — all two-step and one-step decay chains presented in Table 3–5 are included in the calculation. Hence, our simulations differ only in initial ejecta properties.
The ejecta structures of models PDDEL are significantly different from those of DDC models, forming two distinct families. This stems primarily from the hydrodynamical interaction that takes place in PDDEL models, between the outer infalling white dwarf and the inner layers of the white dwarf where the detonation goes off. This reduces the amount of mass at large velocity. It also produces a steep change in density (hereafter termed the cliff) at the lagrangian mass where the interaction takes place and a much larger temperature of the lower density shocked material than in the “standard” delayed-detonation scenario. The density cliff is located at slightly larger velocities in models with a larger i mass, but the scatter is small, with a mean velocity of 14000 km s-1 (in practice, this value can be altered by slight adjustments in the numerical procedure, so it is not obtained robustly from first principles).
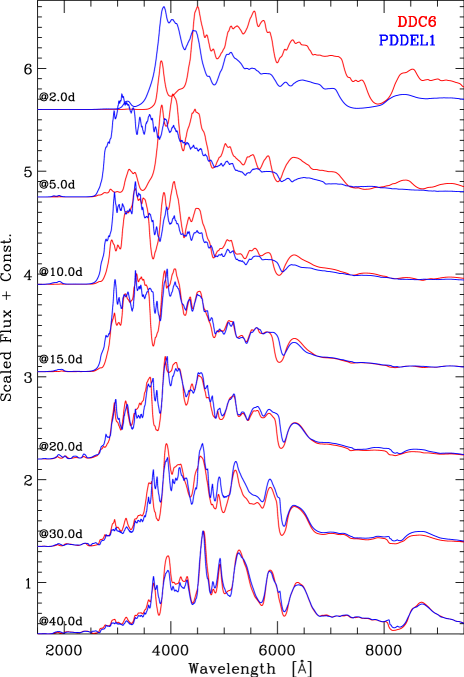
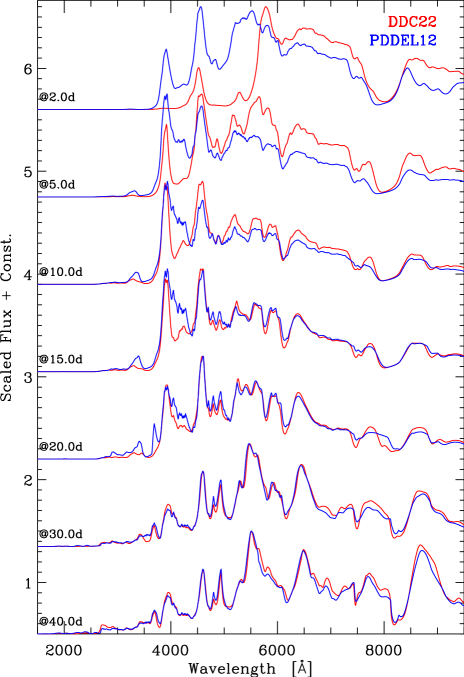
To illustrate differences, we use from each DDC and PDDEL set a couple of models with comparable i mass, at a high and at a low value. For the set with a large i mass, we use models DDC6 and PDDEL1 (initially with 0.72 and 0.76 M⊙ of i, respectively). For the set with a low i mass, we use models DDC22 and PDDEL12 (initially with 0.21 and 0.25 M⊙, respectively). Figure 8 illustrates the different stratification in velocity space for the ejecta of models DDC6 and PDDEL1. Although they synthesize a comparable mass of i and Si, the Mg/Ti/O/C yields differ by a factor of 7/5/2/0.1 (Mg, Ti, O, and C are under-abundant species relative to i and Si). These non-trivial variations could be a clear source of diversity at a given i mass (or peak luminosity). Models of the PDDEL sequence also systematically show a stronger confinement of chemical species. In particular, nuclear processed IMEs are restricted to a narrower velocity range than in “standard” delayed-detonation models.
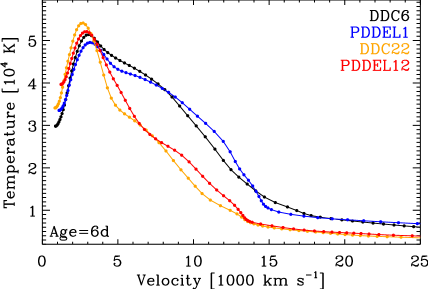
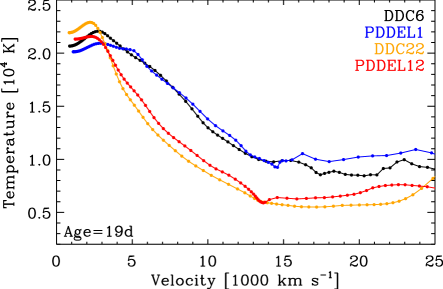
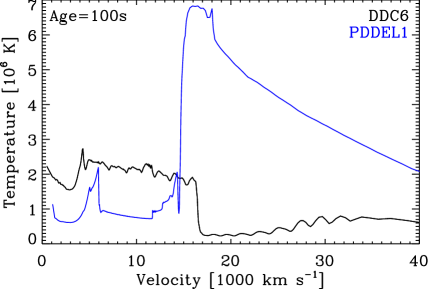
Using physically-consistent ejecta properties is essential for SN studies (see, e.g., the discussion in Dessart et al. 2013c in the context of SNe II-Plateau). Here, our simulations have to capture the different chemical stratifications, as well as the distinct density and temperature structures of the original DDC and PDDEL models. As shown in the left panel of Fig. 9, the temperature profile at 100 s after explosion is drastically different between models PDDEL1 and DDC6 (although they have the same i mass). While the temperature in i-rich regions is quickly controlled by i decay, the temperature in i-deficient regions is at early times entirely determined by the initial temperature set by the explosion and cooling from expansion. It is much larger in the outer regions of PDDEL ejecta models because of the “pulsation” and associated hydrodynamic interaction.
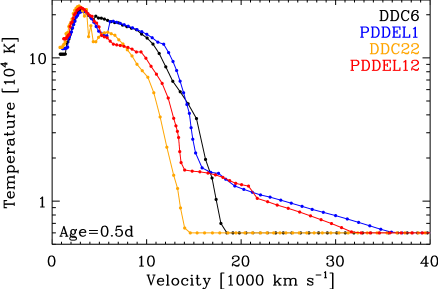
In the right panel of Fig. 9, we show the temperature structure at 0.5 d (this is the time we start the cmfgen simulations), evolved from 100 s ignoring radiative diffusion. Although the contrast between PDDEL and DDC models is somewhat reduced by enforcing a minimum of 6000 K in the low-density (optically-thin) outermost regions (see D13 for details), the temperature in the outer ejecta is typically 10 times as large in the PDDEL models compared to the DDC ones. The temperature shift is very large, much larger than obtained in the DDC sequence through a change in i mass of a factor of 5 and therefore will no doubt cause a dramatic change in the SN radiation properties. For PDDEL models, it is essential to use this initial temperature, which is physical, rather than assuming that it is entirely controlled by i decay, which is only true in i-rich regions.
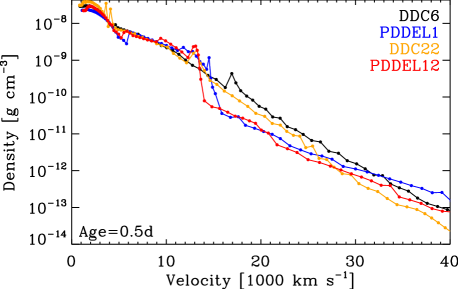
We show the density structure at 0.5 d in Fig. 10. A large density jump is clearly visible, spanning more than an order of magnitude. The i is systematically confined to regions bound by this density cliff in all PDDEL models (see Fig. 8 and Table 2), and therefore plays little role in establishing the high temperature of the outer ejecta at early times.
In contrast, the inner ejecta (say below 10000 km s-1) are very comparable between the DDC and PDDEL sequences, so we anticipate that the photometric and spectroscopic differences between the two sets of models will occur primarily at early times, during the rise to bolometric maximum. In the next section, we discuss to what extent the different initial conditions (enhanced temperature in the outer ejecta; presence of a density cliff at 13000-15000 km s-1; residual unburnt carbon) alter the SN Ia radiative properties we obtain for the “standard” delayed-detonation simulations presented in Blondin et al. (2013) and D13.
5 Results
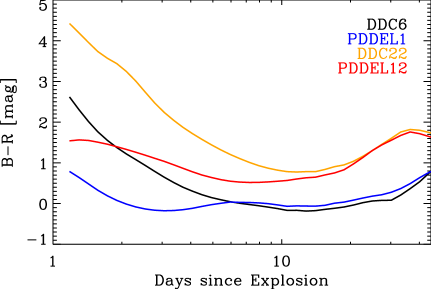
In this section, we discuss the photometric and spectroscopic differences between the DDC and PDDEL series. To be concise, we focus on two sets of models at large (DDC6 and PDDEL1) and low (DDC22 and PDDEL12) i mass.
5.1 Photometric properties
Our cmfgen simulations of pulsational-delayed detonation models exhibit a number of striking differences with their “standard” delayed-detonation counterparts.
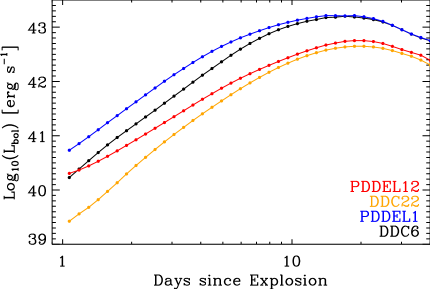
At times prior to peak, PDDEL models are more luminous and bluer than their corresponding DDC model (Fig. 11; the effect is more pronounced in than in the color shown in the right panel). The early-time luminosity still correlates with i in the PDDEL sequence, but the sensitivity is weaker. All these properties stem from the larger initial temperature in the outer ejecta, which is caused not by i but by the hydrodynamic interaction that arises in the pulsational-delayed-detonation scenario. In practice, assuming no decay heating, no radiative cooling, and no radiative diffusion, the evolution of outer ejecta mass shells yields a temperature on the order of 10000 K at 0.5 d for PDDEL models, and typically a factor of 10 lower in DDC models (Fig. 9). A temperature offset subsists for about 1-2 weeks, which suggests that the ejecta keeps a memory of these different initial conditions (pulsation or not) until bolometric maximum (Figs. 11-12).
Our PDDEL models appear more luminous and bluer early on, and from 1d to bolometric maximum PDDEL models span a reduced range of color compared to our cmfgen simulations of DDC models (right panel of Fig. 11). However both DDC and PDDEL models show similar photometric and spectroscopic properties at maximum, and post maximum. At these times the evolution is controlled by the inner cobalt/iron rich ejecta which have similar properties for a given i mass. As illustrated in Figs. 9–10, the impact of the “pulsation” is limited to the outer ejecta layers and, consequently, to the early-time evolution.
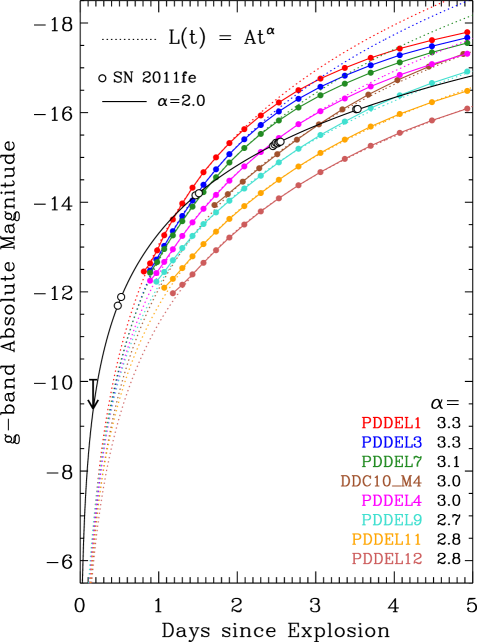
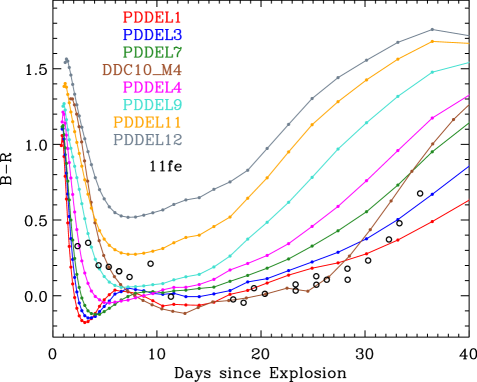
For the same level of mixing, the early photometric behavior of PDDEL models is in better agreement with the observations of SN 2011fe than obtained with the DDC models (Fig. 13). The higher luminosity and bluer color at early times makes the rising slopes more compatible with observations, the power-law exponents now being 3 rather than 7 for the DDC models. PDDEL models are still too red prior to 1-2 d, but after that those with a large i mass match the color of SN 2011fe (some are even a little too blue). Thus the pulsational-delayed-detonation mechanism offers an interesting means to obtain bluer colors and a sizable SN Ia luminosity early after explosion, without invoking a direct contribution from i heating through a strong mixing of the ejecta. A weak correlation of the early luminosity to i mass is present but it results not from decay heating, but from the differing strengths of the hydrodynamic interaction that is caused by the different strengths of the detonation.
These results rely on having knowledge of the initial ejecta temperature immediately after explosion. They depend on the use of physically consistent models rather than crafted ones with a zero initial temperature – it cannot be assumed that nuclear decay is solely responsible for the luminosity at early epochs. At early times, the match would be improved by introducing a 1 d shift, as in Mazzali et al. (2013), but this worsens the match for the -band rise time of model PDDEL4 with SN 2011fe. For the purpose of the present paper, and given the artificial setup for the “pulsation”, it is unnecessary to be more quantitative. The contrast between the PDDEL and DDC models suggests that a slight adjustment of the pulsation setup and burning (through its influence on the explosion energy) could bring our PDDEL4 model in agreement with the observations of SN 2011fe, perhaps even using the inferred explosion time of Nugent et al. (2011). The key is that the early light curve may not be controlled primarily by nuclear decay. This works also highlights the need for deep observations as early as possible — such observations are needed to capture the SN when it is about a thousand times fainter than at bolometric maximum, and to study what controls the early evolution in luminosity and color. The early-time light curve and spectra provide important insights into both the explosion mechanism and the progenitor properties. However, given the uncertainties in numerical models, it is important to build a statistical data base of SN Ia behavior 15–20 days before bolometric maximum so that we can investigate how the early-time behavior correlates with other properties of SNe Ia.
5.2 Spectral evolution and line-profile morphology
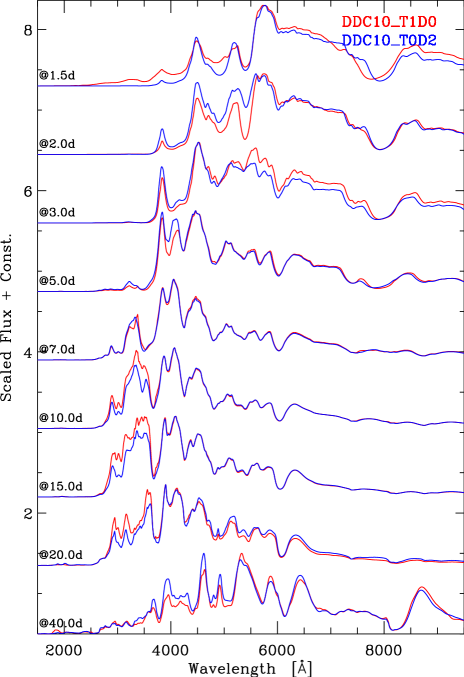
Spectroscopic properties of PDDEL models are markedly different from those of DDC models up until (approximately) bolometric maximum. A montage of spectra that illustrates these spectroscopic differences for our two sets of PDDEL/DDC models at large and small i mass is shown in Fig. 14. At early times, the bluer color in PDDEL models is associated with a bluer spectrum throughout the optical range, although all models are typically too cold to radiate much flux in the UV (i.e., shortward of 3000 K). The concept of a photosphere is still meaningful at such times so this change in color and slope stems from the higher temperature of the radiating layer, in analogy to the emission from a blackbody.
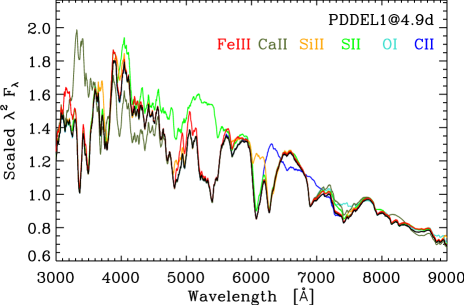
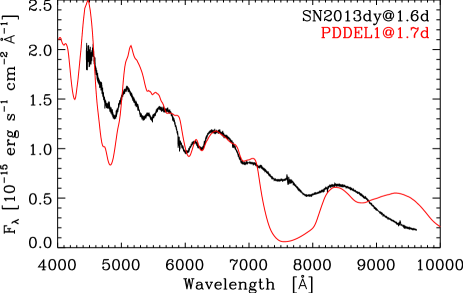
The higher temperature in the outer ejecta of PDDEL models leads to an increase in ionization at early times. This, together with the presence of unburnt carbon, produces clearly visible C ii lines at early times in PDDEL models, in particular for high i mass (Fig. 15). Besides the doublet at 6580 Å, the C ii 7234 Å triplet is also present. This synthetic spectrum exhibits a striking similarity with the observations of SN 2013dy (Zheng et al., 2013), although our model is not particularly abundant in carbon (cumulative mass of 0.02 M⊙). Instead, their visibility is caused by the enhanced ionization and the presence of carbon at relatively small velocities, just above the density cliff where the spectrum forms at early times. Blanketing by Fe iii lines is visible but quite weak. The conspicuous presence of lines from Si ii, S ii, and other IMEs indicates that such PDDEL models do not match the basic properties of 91T-like events (see, e.g., Filippenko et al. 1992).
It is clear from the early time spectrum that the ejecta model properties are in error at large velocities. Strong lines like the Ca ii 8500 Å triplet are very broad in the model but much narrower in the observations. Although a mismatch in ionization is a possibility, an alternative is that the density is much lower in reality beyond 25000 km s-1 than our hydrodynamical code presently predicts. This applies to both DDC and PDDEL models. 555We make the reasonable assumption that the abundances in the outer layers are solar. The validity of this assumption will depend on the SN model and the explosion model. We note, for example, that an isolated white dwarf has very low metal abundances at the surface due to gravitational settling of heavy elements in the atmosphere.
The density cliff, present in PDDEL ejecta but absent in “standard” delayed-detonation models, is central to the understanding of the early spectral morphology of PDDEL models. Because the outer ejecta layers have a very low density above the cliff, the spectrum formation region quickly recedes after explosion to 14000 km s-1 where the density steeply rises in our PDDEL set (Fig. 10). While the spectrum formation region tends to continuously recede in DDC models, it resides for longer within that cliff because it represents a large jump in optical depth. This density jump also spans a very narrow range of velocities, which drastically reduces the change of line widths with time. Consequently, the radiation forms and emerges from a region with a large density gradient, which is known to reduce the spatial extent of line formation, and thus produce weak absorption/emission in SN ejecta (Dessart & Hillier, 2005b, a). Because of the particular chemical stratification of PDDEL models in velocity space, line absorption (especially associated with IMEs) is confined to a narrow velocity range (Fig. 8), causing narrow absorption troughs. Interestingly, the difference in the profile morphology of Si ii 6355 Å is strong between models DDC6 and PDDEL1, even though both ejecta have the same total mass of Si. This shows that different line strengths can arise without associated abundance changes.
Overall, pulsational-delayed-detonation models tend to produce pre-peak spectra with weak lines whose absorption maxima trace a modest range of velocities. This contrasts with “standard” delayed-detonation models which exhibit stronger lines with larger velocity changes in P-Cygni profile minima with time (see Section 5.4).
5.3 A pulsational-delayed-detonation model for SN 2011fe
In this section, we make a more specific comparison between our PDDEL models and SN 2011fe. In agreement with the earlier studies of Pereira et al. (2013) and Mazzali et al. (2013), we find that an ejecta with 0.53 M⊙ of i satisfactorily matches the peak luminosity,
We show a comparison between the SN 2011fe -band light curve and model PDDEL4 in Fig. 4. The model matches the peak magnitude and the decline rate for the first 20 d after maximum (beyond that, SN 2011fe fades faster than the model). A slight offset remains at early times, but as we argue above, modest adjustments in the setup for the “pulsation” suggest the two could probably be brought into agreement. In this figure, we add the observations of SN 2002bo and model DDC15 (a detailed study of SN 2002bo, with a comparison with model DDC15, will be presented in Blondin et al., in prep.). The light curves for the two models and the two SNe lie very close to each other, although SN 2002bo is notorious for its broad lines (Benetti et al., 2004), while SN 2011fe has in contrast narrow lines. This demonstrates that for a given light curve, constrained primarily by the i mass, spectral diversity can arise even from spherical ejecta like the PDDEL and DDC models we study here. Interestingly, the strongly mixed model DDC10_M4 and the pulsation-delayed-detonation model PDDEL4 have comparable early-time light curves.
As mentioned earlier, the match at early times would be improved by introducing a 1 d shift, as in Mazzali et al. (2013), but this worsens somewhat the match for the -band rise time of model PDDEL4. More importantly, it seems that the need to argue for a dark phase in a SN Ia stems from the assumption that the SN radiation is powered entirely by i. At early times, this radiation could instead come from shock-deposited energy in a configuration conceptually equivalent to the pulsational-delayed-detonation presented here. In that sense, SNe Ia could exhibit a short but not so faint post-breakout phase, analogous to what is expected in SNe IIb/Ib/Ic (Dessart et al., 2011). This highlights the need for more sensitive surveys, to push the detection limits.
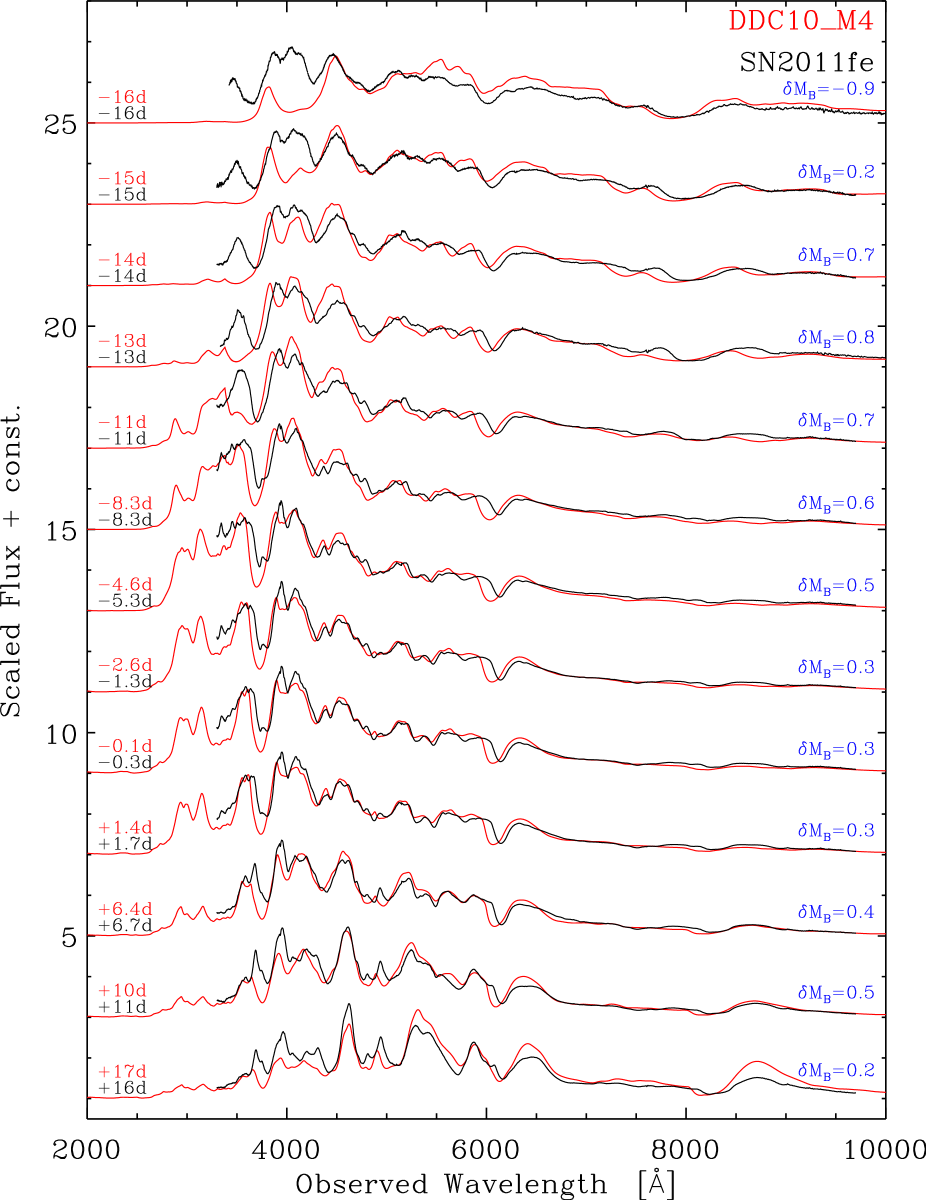
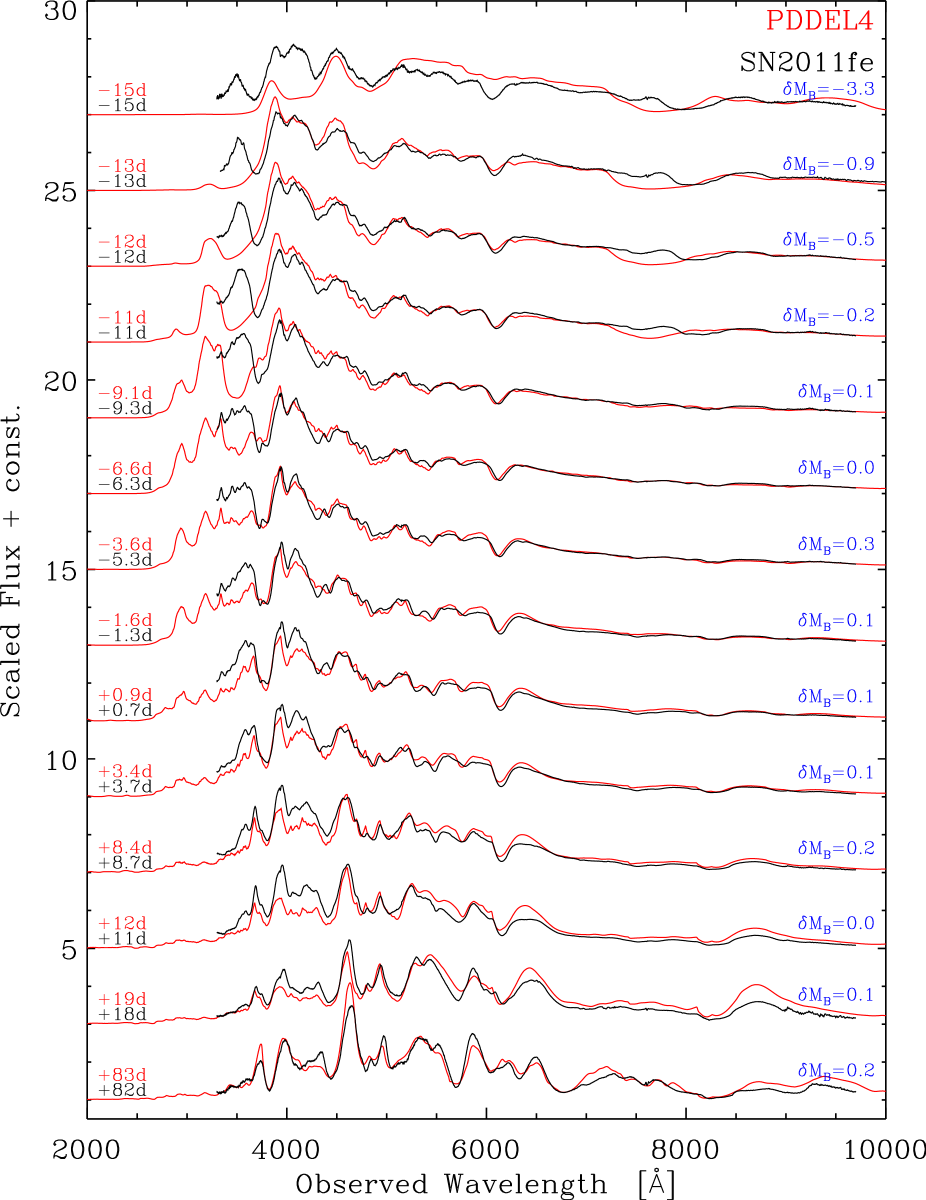
Spectroscopically, the match between model PDDEL4 and SN 2011fe is also good (Fig. 16), especially if we consider that there is no adjustment made to the initial explosion model (which we take at 100 s after explosion). In particular, unlike Mazzali et al. (2013), we do not adjust any of the species mass fractions or the density profile. Despite the lack of freedom, the basic color evolution is matched, and line widths are also well matched (we synchronize the model and the observations at -band maximum in this montage). We also predict the presence of C ii 6580 Å and 7234 Å for the first few days after explosion. While these are stronger in the model than observed in SN 2011fe, they are in close agreement with the C ii lines in SN 2013dy.
The largest discrepancies are at early times, but they seem to concern primarily the widths of the lines. It is hard at this stage to address this since the outer ejecta is poorly covered by the hydrodynamical code, which probably compromises the accuracy of the density profile beyond 20000-30000 km s-1. This density profile would also be different if we changed the setup for the pulsation. A steeper profile would quench absorption/emission at large velocity and would prevent the formation of the very broad Ca ii features that we predict, for example. Because of this and uncertainties on the temperature/ionization, abundance determinations for these layers are uncertain. Our model has an equal share of C and O beyond 15000 km s-1 and matches reasonably well the C ii and O i lines. With such abundances, the strength of these lines in our simulations is primarily affected by ionization. We do not find strong evidence for overabundance in carbon, as proposed by Mazzali et al. (2013) for SN 2011fe.
In Fig. 16, we also include a comparison of model PDDEL4 with the observations of SN 2011fe at +82 d after -band maximum (unfortunately, the data from Pereira et al. 2013 has a 50 d gap and there is at present no public data available during that gap). The spectral morphology is well reproduced, in particular the relative flux distributions, line strengths and widths, with only a slight offset in absolute flux (0.2 mag in ). This suggests that apart from a few mismatches at early times (Ca ii H&K region, red part of the optical), the pulsational-delayed-detonation model PDDEL4 is a sound physical model of SN 2011fe. Of course, this does not mean it is the only possible ejecta that has a similar evolution as SN 2011fe, but it strongly suggests that delayed detonations of that nature are not incompatible with this event. This result contrasts with the conclusions of Röpke et al. (2012), who favor a white-dwarf—white-dwarf merger progenitor based on maximum-light spectral properties. However, the numerical procedure we employ to set the pulsation may actually mimic with some basic fidelity the effect that a buffer of mass, resulting from a merger event, would have on the exploding white dwarf remnant.
5.4 HVG versus LVG SNe Ia
The hydrodynamic interaction that takes place in pulsational-delayed-detonation models of SNe Ia causes two features that affect the evolution of line profile widths. First, the spectrum formation region will tend to reside longer within the density cliff located at the outer edge of the IME-rich layers. Secondly, the bulk of the ejecta mass covers a reduced range of velocities, in particular for IMEs. Together, these effects reduce the maximum range of line-profile widths as the SN ages. These effects are absent in “standard” delayed-detonation models.666The hydrodynamic interaction taking place in pulsational-delayed-detonation models is strong and would likely be present in a multi-D simulation started with the same conditions. This, however, remains to be studied.
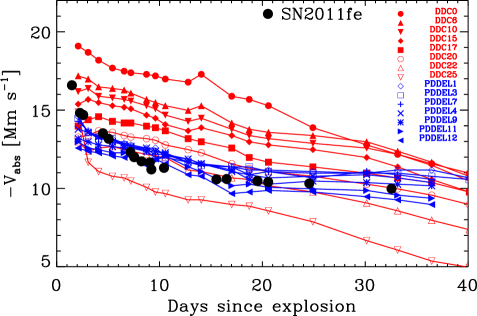
Hence, the distinct explosion mechanism between PDDEL and DDC models offers one physical source of spectral diversity. As shown in Fig. 17, these two populations of models are reminiscent of the so-called HVG and LVG SNe Ia (Benetti et al., 2005). While DDC models can match the broad Si ii 6355 Å trough in SNe Ia like 2009ig or 2002bo (Blondin et al., 2013), they poorly fit the SNe Ia exhibiting a narrower Si ii 6355 Å line, such as SN 2005cf (D13), or SN 2011fe. For these, the PDDEL models match both the narrow absorption and the near-constancy of the location of the absorption maximum (Fig. 16). More quantitatively, over the range 20 to 30 d after explosion, we obtain a mean velocity gradient of 100–300 km s-1 d-1 (absolute value) for models DDC and 0 km s-1 d-1 for models PDDEL.
In the context of delayed-detonation and pulsational-delayed-detonation models, the HVG and LVG classes of SNe Ia no longer require strong ejecta asphericity, as proposed by Maeda et al. (2010) or discussed by Blondin et al. (2011). They may instead arise from distinct but quasi-spherical mass distributions in velocity space, some SNe Ia having a larger mass at large velocity (e.g., SN 2009ig) than others (e.g., SNe 2011fe or 2005cf).
6 Conclusions
In this work, we have investigated the early-time behavior of delayed-detonation models. Although we obtain good agreement around bolometric maximum for these models, we find that the models tend to be very faint and red during the first week after explosion compared to the observations of SN 2011fe.
Assuming that decay heating is the key mechanism for powering SN Ia radiation, we investigate the effect of treating decay chains other than that of i. While i is primarily produced at high density, a number of unstable isotopes, especially associated with IMEs, are produced in the outer ejecta. We find that these additional decays enhance the early-time luminosity, but at a level that is much too small to reconcile our DDC model with observations of SN 2011fe.
Secondly, we examined the role of chemical mixing in our reference model DDC10 (D13). As expected, we find that radial microscopic mixing, in particular of i, influences the early time properties of these models, leading to a luminosity increase of a factor of 2-3 for the model with the strongest mixing. This also produces bluer colors and partially reconciles the model photometry with the observations of SN 2011fe. However, mixing tends to enhance line-optical depths at early times due to larger metal mass fractions and excess heating at large velocities. This enhances line broadening and exacerbates the discrepancy with SN 2011fe, which shows relatively narrow and weak lines.
As an alternative to the DDC models, we have presented results from explosion models named pulsational-delayed detonations. Although our setup for the explosion is artificial, it captures approximately what may occur if SNe Ia arise from the explosion of a white dwarf in a pulsation cycle, or from the explosion following the merger of two white dwarfs, i.e., a white dwarf remnant surrounded by a buffer of mass. In this context, pulsational-delayed detonations differ from standard delayed detonation models by the different chemical stratification of their ejecta in velocity space, the greater survival of unburnt carbon ( 0.02 M⊙ in all our PDDEL models, irrespective of i mass), the presence of a density cliff at the outer edge of the IME-rich layers, and the much higher initial temperature above (at higher velocities than) the density cliff.
Consequently, the radiation properties of pulsational-delayed detonations have several striking features absent in standard delayed-detonation models in which the same chemical mixing is applied. The early time model luminosity can be increased by up to a factor of 10, and the color is significantly bluer at early times, in much closer agreement with SN 2011fe than obtained with weakly mixed DDC models. These differences do not stem from the influence of i, but instead from the different temperature of the outer-ejecta that was shock-heated to very high temperatures in the initial phases of the explosion. Other interesting features of the pulsational-delayed detonations, which are seen in numerous SNe Ia, are
-
1.
the weakness of line profiles at early times, making the spectra more featureless;
-
2.
the presence of C ii lines for up to a week, with stronger features for SNe Ia having a larger i mass (an ionization rather than an abundance effect);
-
3.
the markedly different morphology of line profiles. The Si ii 6355 Å profile exhibits narrower P Cygni absorption whose velocity at maximum absorption varies only weakly (as compared to the DDC models) over time.
While some of these features are reminiscent of 91T-like objects (see, e.g., Filippenko et al. 1992), the presence at early times of lines from C/O and IMEs suggests pulsational-delayed detonations are not the explanation for these 91T-like events. However, we find that our pulsational-delayed detonation model PDDEL4 matches satisfactorily the multi-epoch spectra and muti-band light curves of SN 2011fe, including line features, line profile morphology, trajectory in velocity space of absorption minima. Our PDDEL models are close to matching the increase in brightness of SN 2011fe, as well as the relatively modest evolution in color on the way to bolometric maximum. Although standard delayed detonation models with strong mixing also provide a fair agreement to the early time photometry, they produce broader lines than observed in SN 2011fe.
Such pulsational-delayed detonation models break a number of intuitive but potentially wrong notions. First, the SN Ia radiation does not necessarily stem exclusively from decay heating, compromising “diffusion” models that attempt to explain the origin of the early light curve of SNe Ia. Second, the variations in line-profile width are not exclusively sensitive to variations in explosion energy, since some kinetic energy may be channeled into internal/radiation energy. If so, and in the present context, broad and narrow line SNe Ia should have different colors at early time. In this context we highlight SN 2011fe and SN 2002bo, which have similar light curves but very different spectral line profiles. More generally, pulsational-delayed detonations and delayed detonations produce two distinct SN Ia populations reminiscent of the HVG and LVG SNe Ia (Benetti et al., 2005).
Interestingly, this spectral diversity is not the result of ejecta asphericity (Maeda et al., 2010). It may be that in some circumstances, these asphericities are modest and it is instead the global, quasi-spherical, ejecta mass distribution that is fundamentally altered in certain explosion configurations. Thus spectral diversity may not result from a randomization of viewing angles on a 3-D structure but from the random sampling of intrinsically diverse quasi-spherical SN Ia ejecta. Truth is likely to lie in between these two standpoints, with both multi-D effects present together with SNe Ia having fundamentally distinct angle-averaged structures.
C ii lines are present in our early-time spectra of PDDEL models (yielding an interesting agreement with the observations of SN 2013dy; Zheng et al. 2013), primarily because of the enhanced ejecta temperature from the hydrodynamic interaction, but they are systematically absent in the corresponding spectra of DDC models. This suggests a natural association of C ii detection and LVG SNe Ia. This correlation has been observed by Parrent et al. (2012).
A weak interaction/pulsation or the presence of a low mass buffer around the exploding white dwarf can dramatically alter the outer ejecta layers of the SN Ia explosion. However, such modulations do not impact the bulk of the ejecta mass (for a given i mass, our DDC/PDDEL models have essentially the same structure inside 12000 km s-1), and so this “pulsation” configuration can bring diversity to the early-time evolution of SNe Ia without impacting much the maximum and post-maximum evolution (Fig. 11), which is primarily influenced in our set of DDC and PDDEL models by the total i mass. A specific discussion on the decline rate of all our DDC and PDDEL models, in connection with the width-luminosity relation, is left to a future study.
Acknowledgments
LD and SB acknowledge financial support from the European Community through an International Re-integration Grant, under grant number PIRG04-GA-2008-239184, and from “Agence Nationale de la Recherche” grant ANR-2011-Blanc-SIMI-5-6-007-01. DJH acknowledges support from STScI theory grant HST-AR-12640.01, and NASA theory grant NNX10AC80G. This work was also supported in part by the National Science Foundation under Grant No. PHYS-1066293 and benefited from the hospitality of the Aspen Center for Physics. AK acknowledges the NSF support through the NSF grants AST-0709181 and TG-AST090074. This work was granted access to the HPC resources of CINES (France) under the allocation c2013046608 made by GENCI (Grand Equipement National de Calcul Intensif).
| 6.075 d | 77.233 d | ||
| 1.718 MeV | 3.633 MeV | ||
| 0.000 MeV | 0.116 MeV | ||
| Prob. | Prob. | ||
| 0.158 | 98.8 | 0.511 | 38.0 |
| 0.270 | 36.5 | 0.847 | 100.0 |
| 0.480 | 36.5 | 0.977 | 1.4 |
| 0.750 | 49.5 | 1.038 | 14.0 |
| 0.812 | 86.0 | 1.175 | 2.3 |
| 1.562 | 14.0 | 1.238 | 67.6 |
| 1.360 | 4.3 | ||
| 1.771 | 15.7 | ||
| 2.015 | 3.1 | ||
| 2.035 | 7.9 | ||
| 2.598 | 17.3 | ||
| 3.010 | 1.0 | ||
| 3.202 | 3.2 | ||
| 3.253 | 7.9 | ||
| 3.273 | 1.9 | ||
| 1.483 d | 271.740 d | ||
| 1.937 MeV | 0.122 MeV | ||
| 0.154 MeV | 0.000 MeV | ||
| Prob. | Prob. | ||
| 0.127 | 16.7 | 0.014 | 9.2 |
| 0.511 | 87.0 | 0.122 | 85.6 |
| 1.378 | 81.7 | 0.137 | 10.7 |
| 1.758 | 5.8 | ||
| 1.919 | 12.3 | ||
| 0.898 d | 15.973 d | ||
| 0.432 MeV | 2.910 MeV | ||
| 0.002 MeV | 0.145 MeV | ||
| Prob. | Prob. | ||
| 0.112 | 96.0 | 0.511 | 99.8 |
| 0.308 | 100.0 | 0.944 | 7.8 |
| 0.511 | 3.2 | 0.984 | 100.0 |
| 1.312 | 97.5 | ||
| 2.240 | 2.4 | ||
| 0.029 d | 330.000 d | ||
| 1.055 MeV | 0.000 MeV | ||
| 0.598 MeV | 0.000 MeV | ||
| Prob. | Prob. | ||
| 0.062 | 16.4 | 0.511 | 0.0 |
| 0.091 | 53.2 | ||
| 0.153 | 30.3 | ||
| 0.511 | 186.0 | ||
| 0.032 d | 27.700 d | ||
| 0.992 MeV | 0.032 MeV | ||
| 0.933 MeV | 0.000 MeV | ||
| Prob. | Prob. | ||
| 0.511 | 194.2 | 0.320 | 9.9 |
| 0.730 d | 1002.200 d | ||
| 1.943 MeV | 0.000 MeV | ||
| 0.430 MeV | 0.000 MeV | ||
| Prob. | Prob. | ||
| 0.477 | 20.2 | 0.511 | 0.0 |
| 0.511 | 152.0 | ||
| 0.931 | 75.0 | ||
| 1.317 | 7.1 | ||
| 1.370 | 2.9 | ||
| 1.408 | 16.9 | ||
| 0.000 d | 35.040 d | ||
| 1.072 MeV | 0.000 MeV | ||
| 2.347 MeV | 0.000 MeV | ||
| Prob. | Prob. | ||
| 0.511 | 199.8 | 0.003 | 5.5 |
| 2.796 | 1.8 | ||
| 3.601 | 0.0 | ||
| 0.345 d | 0.015 d | ||
| 0.751 MeV | 2.447 MeV | ||
| 0.191 MeV | 1.113 MeV | ||
| Prob. | Prob. | ||
| 0.169 | 99.2 | 0.511 | 190.0 |
| 0.378 | 1.6 | 1.434 | 98.3 |
| 0.511 | 112.0 | 2.965 | 1.0 |
| 3.129 | 1.0 | ||
| 21915.000 d | 0.165 d | ||
| 0.000 MeV | 2.136 MeV | ||
| 0.000 MeV | 0.596 MeV | ||
| Prob. | Prob. | ||
| 0.511 | 0.0 | 0.511 | 188.5 |
| 1.157 | 99.9 | ||
| 0.076 d | |||
| 1.283 MeV | |||
| 0.464 MeV | |||
| Prob. | |||
| 1.294 | 99.2 | ||
| 1.677 | 0.1 | ||
| 0.513 d | |||
| 0.276 MeV | |||
| 1.430 MeV | |||
| Prob. | |||
| 1.525 | 18.1 | ||
| 0.929 d | |||
| 0.964 MeV | |||
| 0.310 MeV | |||
| Prob. | |||
| 0.221 | 4.8 | ||
| 0.373 | 86.8 | ||
| 0.397 | 11.9 | ||
| 0.404 | 0.4 | ||
| 0.593 | 11.3 | ||
| 0.618 | 79.2 | ||
| 0.801 | 0.1 | ||
| 0.990 | 0.3 | ||
| 1.022 | 2.0 | ||
| 1.394 | 0.1 | ||
| 0.162 d | |||
| 0.985 MeV | |||
| 0.419 MeV | |||
| Prob. | |||
| 0.373 | 22.5 | ||
| 0.511 | 176.2 | ||
| 3.349 d | |||
| 0.109 MeV | |||
| 0.162 MeV | |||
| Prob. | |||
| 0.159 | 68.3 | ||
| 0.069 d | |||
| 0.459 MeV | |||
| Prob. | |||
| 0.067 | 84.7 | ||
| 0.842 | 0.8 | ||
| 0.909 | 3.6 | ||
References
- Arnett (1982) Arnett, W. D. 1982, ApJ, 253, 785
- Badenes et al. (2006) Badenes, C., Borkowski, K. J., Hughes, J. P., Hwang, U., & Bravo, E. 2006, ApJ, 645, 1373
- Badenes et al. (2008) Badenes, C., Hughes, J. P., Cassam-Chenaï, G., & Bravo, E. 2008, ApJ, 680, 1149
- Benetti et al. (2005) Benetti, S., Cappellaro, E., Mazzali, P. A., Turatto, M., Altavilla, G., Bufano, F., Elias-Rosa, N., Kotak, R., Pignata, G., Salvo, M., & Stanishev, V. 2005, ApJ, 623, 1011
- Benetti et al. (2004) Benetti, S., Meikle, P., Stehle, M., Altavilla, G., Desidera, S., Folatelli, G., Goobar, A., Mattila, S., Mendez, J., Navasardyan, H., Pastorello, A., Patat, F., Riello, M., Ruiz-Lapuente, P., Tsvetkov, D., Turatto, M., Mazzali, P., & Hillebrandt, W. 2004, MNRAS, 348, 261
- Blinnikov et al. (2000) Blinnikov, S., Lundqvist, P., Bartunov, O., Nomoto, K., & Iwamoto, K. 2000, ApJ, 532, 1132
- Blondin et al. (2013) Blondin, S., Dessart, L., Hillier, D. J., & Khokhlov, A. M. 2013, MNRAS, 429, 2127
- Blondin et al. (2011) Blondin, S., Kasen, D., Röpke, F. K., Kirshner, R. P., & Mandel, K. S. 2011, MNRAS, 417, 1280
- Blondin et al. (2012) Blondin, S., Matheson, T., Kirshner, R. P., Mandel, K. S., Berlind, P., Calkins, M., Challis, P., Garnavich, P. M., Jha, S. W., Modjaz, M., Riess, A. G., & Schmidt, B. P. 2012, AJ, 143, 126
- Bloom et al. (2012) Bloom, J. S., Kasen, D., Shen, K. J., Nugent, P. E., Butler, N. R., Graham, M. L., Howell, D. A., Kolb, U., Holmes, S., Haswell, C. A., Burwitz, V., Rodriguez, J., & Sullivan, M. 2012, ApJL, 744, L17
- Bufano et al. (2009) Bufano, F., Immler, S., Turatto, M., Landsman, W., Brown, P., Benetti, S., Cappellaro, E., Holland, S. T., Mazzali, P., Milne, P., Panagia, N., Pian, E., Roming, P., Zampieri, L., Breeveld, A. A., & Gehrels, N. 2009, ApJ, 700, 1456
- Chiotellis et al. (2013) Chiotellis, A., Kosenko, D., Schure, K. M., Vink, J., & Kaastra, J. S. 2013, MNRAS, 435, 1659
- Colgate & McKee (1969) Colgate, S. A. & McKee, C. 1969, ApJ, 157, 623
- Dessart & Hillier (2005a) Dessart, L. & Hillier, D. J. 2005a, A&A, 439, 671
- Dessart & Hillier (2005b) —. 2005b, A&A, 437, 667
- Dessart et al. (2013a) Dessart, L., Hillier, D. J., Blondin, S., & Khokhlov, A. 2013a, ArXiv:1308.6352
- Dessart et al. (2012) Dessart, L., Hillier, D. J., Li, C., & Woosley, S. 2012, MNRAS, 424, 2139
- Dessart et al. (2011) Dessart, L., Hillier, D. J., Livne, E., Yoon, S.-C., Woosley, S., Waldman, R., & Langer, N. 2011, MNRAS, 414, 2985
- Dessart et al. (2013b) Dessart, L., Hillier, D. J., Waldman, R., & Livne, E. 2013b, MNRAS, 433, 1745
- Dessart et al. (2013c) Dessart, L., Waldman, R., Livne, E., Hillier, D. J., & Blondin, S. 2013c, MNRAS, 428, 3227
- Falco et al. (1999) Falco, E. E., Kurtz, M. J., Geller, M. J., Huchra, J. P., Peters, J., Berlind, P., Mink, D. J., Tokarz, S. P., & Elwell, B. 1999, PASP, 111, 438
- Filippenko et al. (1992) Filippenko, A. V., Richmond, M. W., Matheson, T., Shields, J. C., Burbidge, E. M., Cohen, R. D., Dickinson, M., Malkan, M. A., Nelson, B., Pietz, J., Schlegel, D., Schmeer, P., Spinrad, H., Steidel, C. C., Tran, H. D., & Wren, W. 1992, ApJL, 384, L15
- Gamezo et al. (2005) Gamezo, V. N., Khokhlov, A. M., & Oran, E. S. 2005, ApJ, 623, 337
- Garavini et al. (2007) Garavini, G., Nobili, S., Taubenberger, S., Pastorello, A., Elias-Rosa, N., Stanishev, V., Blanc, G., Benetti, S., Goobar, A., Mazzali, P. A., Sanchez, S. F., Salvo, M., Schmidt, B. P., & Hillebrandt, W. 2007, A&A, 471, 527
- Hillier & Dessart (2012) Hillier, D. J. & Dessart, L. 2012, MNRAS, 424, 252
- Hoeflich & Khokhlov (1996) Hoeflich, P. & Khokhlov, A. 1996, ApJ, 457, 500
- Hoeflich et al. (1996) Hoeflich, P., Khokhlov, A., Wheeler, J. C., Phillips, M. M., Suntzeff, N. B., & Hamuy, M. 1996, ApJL, 472, L81
- Höflich et al. (2010) Höflich, P., Krisciunas, K., Khokhlov, A. M., Baron, E., Folatelli, G., Hamuy, M., Phillips, M. M., Suntzeff, N., Wang, L., & NSF07-SNIa Collaboration. 2010, ApJ, 710, 444
- Hoyle & Fowler (1960) Hoyle, F. & Fowler, W. A. 1960, ApJ, 132, 565
- Kasen (2010) Kasen, D. 2010, ApJ, 708, 1025
- Kasen et al. (2009) Kasen, D., Röpke, F. K., & Woosley, S. E. 2009, Nature, 460, 869
- Khokhlov et al. (1993) Khokhlov, A., Mueller, E., & Hoeflich, P. 1993, A&A, 270, 223
- Khokhlov (1991) Khokhlov, A. M. 1991, A&A, 245, 114
- Livne et al. (2005) Livne, E., Asida, S. M., & Höflich, P. 2005, ApJ, 632, 443
- Lucy (1991) Lucy, L. B. 1991, ApJ, 383, 308
- Maeda et al. (2010) Maeda, K., Benetti, S., Stritzinger, M., Röpke, F. K., Folatelli, G., Sollerman, J., Taubenberger, S., Nomoto, K., Leloudas, G., Hamuy, M., Tanaka, M., Mazzali, P. A., & Elias-Rosa, N. 2010, Nature, 466, 82
- Mazzali et al. (2013) Mazzali, P., Sullivan, M., Hachinger, S., Ellis, R., Nugent, P. E., Howell, D. A., Gal-Yam, A., Maguire, K., Cooke, J., & Thomas, R. 2013, ArXiv:1305.2356
- Nugent et al. (2011) Nugent, P. E., Sullivan, M., Cenko, S. B., Thomas, R. C., Kasen, D., Howell, D. A., Bersier, D., Bloom, J. S., Kulkarni, S. R., Kandrashoff, M. T., Filippenko, A. V., Silverman, J. M., Marcy, G. W., Howard, A. W., Isaacson, H. T., Maguire, K., Suzuki, N., Tarlton, J. E., Pan, Y.-C., Bildsten, L., Fulton, B. J., Parrent, J. T., Sand, D., Podsiadlowski, P., Bianco, F. B., Dilday, B., Graham, M. L., Lyman, J., James, P., Kasliwal, M. M., Law, N. M., Quimby, R. M., Hook, I. M., Walker, E. S., Mazzali, P., Pian, E., Ofek, E. O., Gal-Yam, A., & Poznanski, D. 2011, Nature, 480, 344
- Parrent et al. (2012) Parrent, J. T., Howell, D. A., Friesen, B., Thomas, R. C., Fesen, R. A., Milisavljevic, D., Bianco, F. B., Dilday, B., Nugent, P., Baron, E., Arcavi, I., Ben-Ami, S., Bersier, D., Bildsten, L., Bloom, J., Cao, Y., Cenko, S. B., Filippenko, A. V., Gal-Yam, A., Kasliwal, M. M., Konidaris, N., Kulkarni, S. R., Law, N. M., Levitan, D., Maguire, K., Mazzali, P. A., Ofek, E. O., Pan, Y., Polishook, D., Poznanski, D., Quimby, R. M., Silverman, J. M., Sternberg, A., Sullivan, M., Walker, E. S., Xu, D., Buton, C., & Pereira, R. 2012, ApJL, 752, L26
- Patnaude et al. (2012) Patnaude, D. J., Badenes, C., Park, S., & Laming, J. M. 2012, ApJ, 756, 6
- Pereira et al. (2013) Pereira, R., Thomas, R. C., Aldering, G., Antilogus, P., Baltay, C., Benitez-Herrera, S., Bongard, S., Buton, C., Canto, A., Cellier-Holzem, F., Chen, J., Childress, M., Chotard, N., Copin, Y., Fakhouri, H. K., Fink, M., Fouchez, D., Gangler, E., Guy, J., Hillebrandt, W., Hsiao, E. Y., Kerschhaggl, M., Kowalski, M., Kromer, M., Nordin, J., Nugent, P., Paech, K., Pain, R., Pécontal, E., Perlmutter, S., Rabinowitz, D., Rigault, M., Runge, K., Saunders, C., Smadja, G., Tao, C., Taubenberger, S., Tilquin, A., & Wu, C. 2013, A&A, 554, A27
- Piro (2012) Piro, A. L. 2012, ApJ, 759, 83
- Piro & Nakar (2013) Piro, A. L. & Nakar, E. 2013, ApJ, 769, 67
- Richmond & Smith (2012) Richmond, M. W. & Smith, H. A. 2012, Journal of the American Association of Variable Star Observers (JAAVSO), 40, 872
- Röpke & Hillebrandt (2005) Röpke, F. K. & Hillebrandt, W. 2005, A&A, 431, 635
- Röpke et al. (2012) Röpke, F. K., Kromer, M., Seitenzahl, I. R., Pakmor, R., Sim, S. A., Taubenberger, S., Ciaraldi-Schoolmann, F., Hillebrandt, W., Aldering, G., Antilogus, P., Baltay, C., Benitez-Herrera, S., Bongard, S., Buton, C., Canto, A., Cellier-Holzem, F., Childress, M., Chotard, N., Copin, Y., Fakhouri, H. K., Fink, M., Fouchez, D., Gangler, E., Guy, J., Hachinger, S., Hsiao, E. Y., Chen, J., Kerschhaggl, M., Kowalski, M., Nugent, P., Paech, K., Pain, R., Pecontal, E., Pereira, R., Perlmutter, S., Rabinowitz, D., Rigault, M., Runge, K., Saunders, C., Smadja, G., Suzuki, N., Tao, C., Thomas, R. C., Tilquin, A., & Wu, C. 2012, ApJL, 750, L19
- Shappee & Stanek (2011) Shappee, B. J. & Stanek, K. Z. 2011, ApJ, 733, 124
- Sim et al. (2010) Sim, S. A., Röpke, F. K., Hillebrandt, W., Kromer, M., Pakmor, R., Fink, M., Ruiter, A. J., & Seitenzahl, I. R. 2010, ApJL, 714, L52
- Sim et al. (2013) Sim, S. A., Seitenzahl, I. R., Kromer, M., Ciaraldi-Schoolmann, F., Röpke, F. K., Fink, M., Hillebrandt, W., Pakmor, R., Ruiter, A. J., & Taubenberger, S. 2013, MNRAS, 436, 333
- Zheng et al. (2013) Zheng, W., Silverman, J. M., Filippenko, A. V., Kasen, D., Nugent, P. E., Graham, M., Wang, X., Valenti, S., Ciabattari, F., Kelly, P. L., Fox, O. D., Shivvers, I., Clubb, K. I., Cenko, S. B., Balam, D., Howell, D. A., Hsiao, E., Li, W., Marion, G. H., Sand, D., Vinko, J., Wheeler, J. C., & Zhang, J. 2013, ApJL, 778, L15