Pulsation Modes of Long-Period Variables in the Period–Luminosity Plane
Abstract
We present a phenomenological analysis of long-period variables (LPVs) in the Large Magellanic Cloud with the aim of detecting pulsation modes associated to different period–luminosity (PL) relations. Among brighter LPVs we discover a group of triple-mode semiregular variables with the fundamental, first overtone and second overtone modes simultaneously excited, which fall on PL sequences C, C′ and B, respectively. The mode identification in the fainter red giants is more complicated. We demonstrate that the fundamental-mode pulsators partly overlap with the first-overtone modes. We show a possible range of fundamental mode and first overtone periods in the PL diagram.
Subject headings:
stars: AGB and post-AGB – stars: late-type – infrared: stars – stars: oscillations1. Introduction
Stars that evolve on the first-ascent red giant branch (RGB) and asymptotic giant branch (AGB) show, with no exception, variability due to oscillations. The amplitudes of the photometric variations increase with the bolometric luminosity of giant stars – from micromagnitudes in stars at the base of the giant branch (Hekker et al., 2009; Bedding et al., 2010), through millimagnitudes in OGLE small amplitude red giants (OSARGs; Wray et al., 2004; Soszyński et al., 2004), tenths of a magnitude in semiregular variables (SRVs) to several magnitudes in Mira stars at the tip of the AGB. Recently, Bányai et al. (2013) have shown that it is possible to distinguish between solar-like oscillations low on the RGB and larger amplitude pulsations which are characteristic of the more luminous OSARGs, SRVs and Miras i.e. the OSARGs, SRVs and Miras all seem to be self-excited pulsators rather than solar-like oscillators.
It is important to emphasize that there is no break in the overall red giant evolutionary sequence, so one can expect to see a continuity between the OSARGs, SRVs and Miras (collectively known as long-period variables – LPVs). In the past, the OSARGs have sometimes been considered as a separate class of variables from the SRVs and Miras (e.g. Soszyński et al., 2004, 2007).
Such continuity is clearly visible between the classically defined SRVs, especially SRa stars, and Miras. Both groups follow the same period–luminosity (PL) sequence, labeled C by Wood et al. (1999). The difference between SRa stars and Miras lays in their amplitudes of variability and in the number of excited pulsation modes. Miras are usually single-mode pulsators, probably oscillating in the fundamental mode, while SRa stars usually exhibit two modes – fundamental and first overtone – so they occupy two sequences in the PL diagram, labeled C and C′.
However, LPVs display much more complex pattern in the PL plane. Recently, Soszyński & Wood (2013) showed that SRb stars (smaller-amplitude and less regular that SRa stars) can be found in the space between PL sequences C and C′. A theoretical analysis suggests that SRb stars do not follow a separate PL sequence, but they form a continuity with SRa stars and Miras on sequence C. All of these stars are thought to pulsate in the fundamental mode.
OSARG variables form a series of PL sequences (e.g. Soszyński et al., 2007) of which the longest-period ridge roughly overlaps with sequence C′. Even so, it is not clear which modes of pulsation correspond to different PL relations of OSARGs. For example, Dziembowski & Soszyński (2010) in their theoretical work assumed that the longest-period PL sequence of OSARGs corresponds to the fundamental mode. On the other hand, Takayama et al. (2013) argued that the same PL relation is associated with the first-overtone. From the phenomenological point of view, the identification of pulsation modes would be possible, if one detects LPVs with the fundamental-mode (a period lying on sequence C), first-overtone (sequence C′) and higher radial modes simultaneously excited in one star. Up to this time, such a configuration has not been observed in the pulsating red giants. LPVs with periods identified on sequence C have been either single-mode (Miras) or double-mode (SRVs) pulsators.
In this paper we report the discovery of a small group of triple-mode LPVs with the fundamental-mode, first-overtone and second-overtone simultaneously excited. Our sample populates exclusively the brighter part of the PL diagram and unambiguously assigns the pulsation modes to the PL relations in this region. For fainter LPVs we found no distinct counterparts of these triple-mode variables. We argue that sequence C′ in its fainter part is populated by both – fundamental mode and first-overtone – variables.
2. A sample of LPVs in the Large Magellanic Cloud
In our analysis, we use a huge collection of LPVs detected by the OGLE project in the Large Magellanic Cloud (LMC; Soszyński et al., 2009). The stars were observed between 2001 June and 2009 May with the 1.3 m Warsaw telescope at the Las Campanas Observatory in Chile. The telescope was equipped with the eight chip mosaic camera (Udalski, 2003), covering approximately on the sky with the scale of 0.26 arcsec/pixel. Most of the images were obtained in the I band with an exposure time of 180 seconds. The light curves consist typically of 700 points.
The photometry of LPVs in the central region of the LMC was supplemented with the OGLE-II measurements collected between Jan 1997 and Nov 2000. We also added observations obtained in the course of the ongoing OGLE-IV project from 2010 March to 2013 May. Thus, the time baseline of observations in some stars exceeded 16 years, and typically it was 12 years, with over 1000 observing points.
Our sample of LPVs was cross-matched with the 2MASS Point Source Catalog (Cutri et al., 2003). We left on our list only those stars that had both and -band measurements. For each object we derived the reddening-independent near-infrared Wesenheit index, defined as
The distribution of LPVs in the period– and period– diagrams look essentially the same for most SRVs and OSARGs. The main difference between both diagrams concerns Miras with heavy circumstellar extinction, which dominate the long-period end of sequence C. In the period– plane sequence C is significantly broadened by the Miras which are obscured by their circumstellar dust shells and lay far below the linear PL relation (e.g. Ita & Matsunaga, 2011). This effect may be practically cancelled by using the reddening-independent Wesenheit index, . Also the oxygen-rich and carbon-rich giants follow nearly the same PL relations in the period– plane (Soszyński et al., 2007), so our conclusions are valid for both spectral types.
All the I-band light curves were searched for periodicities using the Fourier-based Fnpeaks code by Z. Kołaczkowski (private communication). For each star we detected five periods with an iterative procedure of fitting a third-order Fourier series and subtracting this function from the light curve. For each period we recorded also the amplitude of light variations, defined as a difference between maximum and minimum value of the third-order Fourier series fitted to the observed light curve.
The OGLE-III Catalog of LPVs in the LMC (Soszyński et al., 2009) counts objects, of which were classified as (OSARGs), as SRVs and 1667 as Mira stars. Miras were distinguished from SRVs on the basis of their I-band amplitudes larger than 0.8 mag. In this study we do not separate OSARGs and SRVs, since we are trying to find the continuity between both groups. We also had no effective method to completely separate RGB and AGB OSARGs fainter than the tip of the RGB, so we kept both these populations on the list of objects. RGB LPVs obey PL relations which are somewhat shifted (in ) relative to the AGB giants (Kiss & Bedding, 2003). However this offset does not change the conclusions of this work, and in particular the identification of the pulsation modes is valid for OSARGs on both the RGB and AGB.
3. Analysis
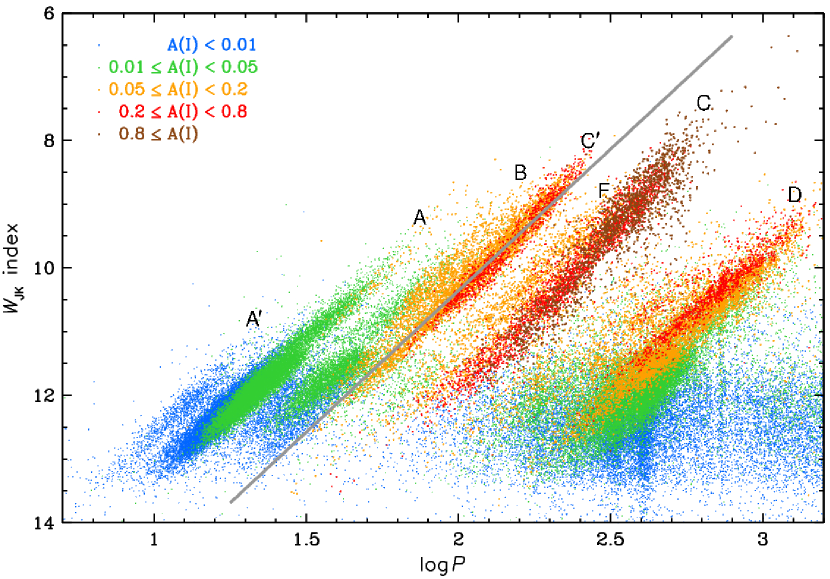
Fig. 1 shows the period–Wesenheit index diagram for LPVs in the LMC. Each star is represented by only one point corresponding to the primary period (first period detected by the Fnpeaks code – usually associated with the largest amplitude). Different colors of the points code different ranges of I-band amplitude – from OSARGs with mag represented by blue symbols to Miras ( mag) indicated by brown points. Sometimes the automatically detected periods are spurious, which is particularly evident for some of the smallest-amplitude variables (blue points), which show pseudo-periods longer than sequence D. However, most of the shorter periods are real and trace in Fig. 1 the clearly visible PL sequences, which are labeled according to the scheme introduced by Wood et al. (1999) and other authors. Mira stars follow sequence C, SRVs – sequences C and C′, OSARGs – sequences A, A′, and B. The grey line overplotted in Fig. 1 has a slope and it is a rough fit to sequence C′.
With the exception of Mira stars, LPVs are known to be multi-periodic variable stars. A widely used tool for studying multi-mode variables is the so-called Petersen diagram, on which the ratio of two selected periods is plotted against the logarithm of the longer period. However, LPVs form a quite fuzzy picture on the classical Petersen diagram, because periods and period ratios corresponding to different PL sequences overlap each other.
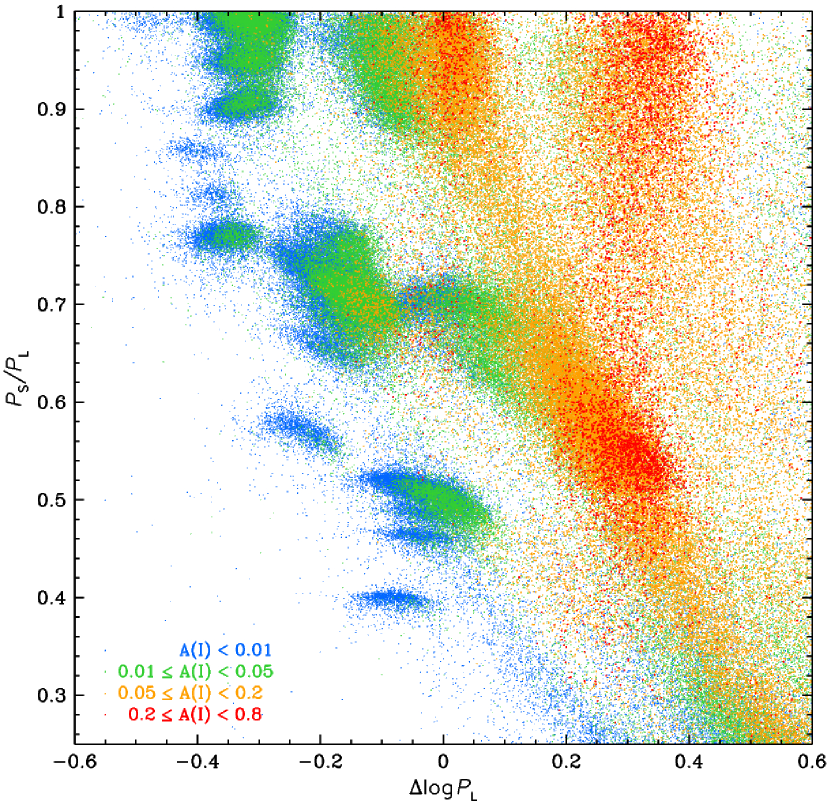
To circumvent this problem, we plotted a somewhat different diagram (Fig. 2) which we called a modified Petersen diagram. In this diagram the ordinate axis shows (as in the classical Petersen diagram) the ratio of shorter to longer periods selected from the five most significant periods determined in every star, while the abscissa axis shows the horizontal distance (in ) of a star from the grey solid line plotted in Fig. 1. In the modified Petersen diagram different pairs of periods corresponding to different PL relations form distinct groups of points. In Fig. 2 colors of the points indicate amplitudes associated with the longer periods. Since Mira stars are usually single-mode pulsators, they are not included in the modified Petersen diagram.

4. Pulsation modes of LPVs
Assignment of the pulsation modes to different PL relations formed by LPVs is a matter of debate (e.g. Wood & Sebo, 1996; Wood et al., 1999; Kiss & Bedding, 2003; Ita et al., 2004; Takayama et al., 2013). There is a consensus today that Mira stars pulsate in the fundamental mode. Miras are generally single-mode variables and lie on sequence C in the PL plane, so other LPVs with one of their periods falling on this sequence are also considered as fundamental-mode pulsators. Most of SRVs are double-mode variables with the fundamental mode and first overtone simultaneously excited. The first-overtone periods of SRVs delineate sequence C′ in the PL diagram. In the modified Petersen diagram (Fig. 2) SRV of type SRa (red points) concentrate at period ratios between 0.45 and 0.6. SRb stars with smaller amplitudes (orange points) exhibit on average larger ratios of the first-overtone to fundamental-mode periods. Their fundamental-mode periods can be found somewhere between sequences C and C′. Soszyński & Wood (2013) labeled this fundamental-mode sequence of SRb stars by letter F, although it seems that sequences C and F constitute a continuity between each other.
The identification of the pulsation modes associated with the shorter-period PL relations obeyed by LPVs remains a subject of controversy. A definite answer would be given by multi-mode LPVs with the fundamental, first-overtone and higher overtone simultaneously excited. However no such objects have been reported so far. LPVs with one of their periods lying on sequence C (fundamental-mode) have been found to be either single-mode Miras or double-mode SRVs.

In this regard, we performed a search for SRVs with at least three radial modes simultaneously excited. We divided the PL plane into three regions: one covering the fundamental-mode periods (sequences C and F), the second comprising the first-overtone periods (sequence C′), and the third region covering the shorter-period sequences (A′, A and B). As mentioned above, we derived five periods for each star from our sample of LPVs in the LMC. From this sample we selected those objects which had at least one period in each of these regions. From our analysis we excluded periods longer than those making up sequence C: still unexplained long secondary periods which comprise sequence D, periods which populate a newly discovered dim sequence located between sequences C and D (Soszyński & Wood, 2013), and sequence E consisting of binary systems.
Since some of the automatically derived periods are spurious, we visually inspected all the selected light curves. For each period we pre-whitened the light curves with four other detected periods and subjectively decided whenever the remaining period is real. Two examples of such light curves are shown in Figs. 3 and 4. In the upper panel of these figures we show unfolded light curves, middle panels show original light curves folded with three periods corresponding to three pulsation modes, and bottom panels present pre-whitened light curves folded with the same periods.
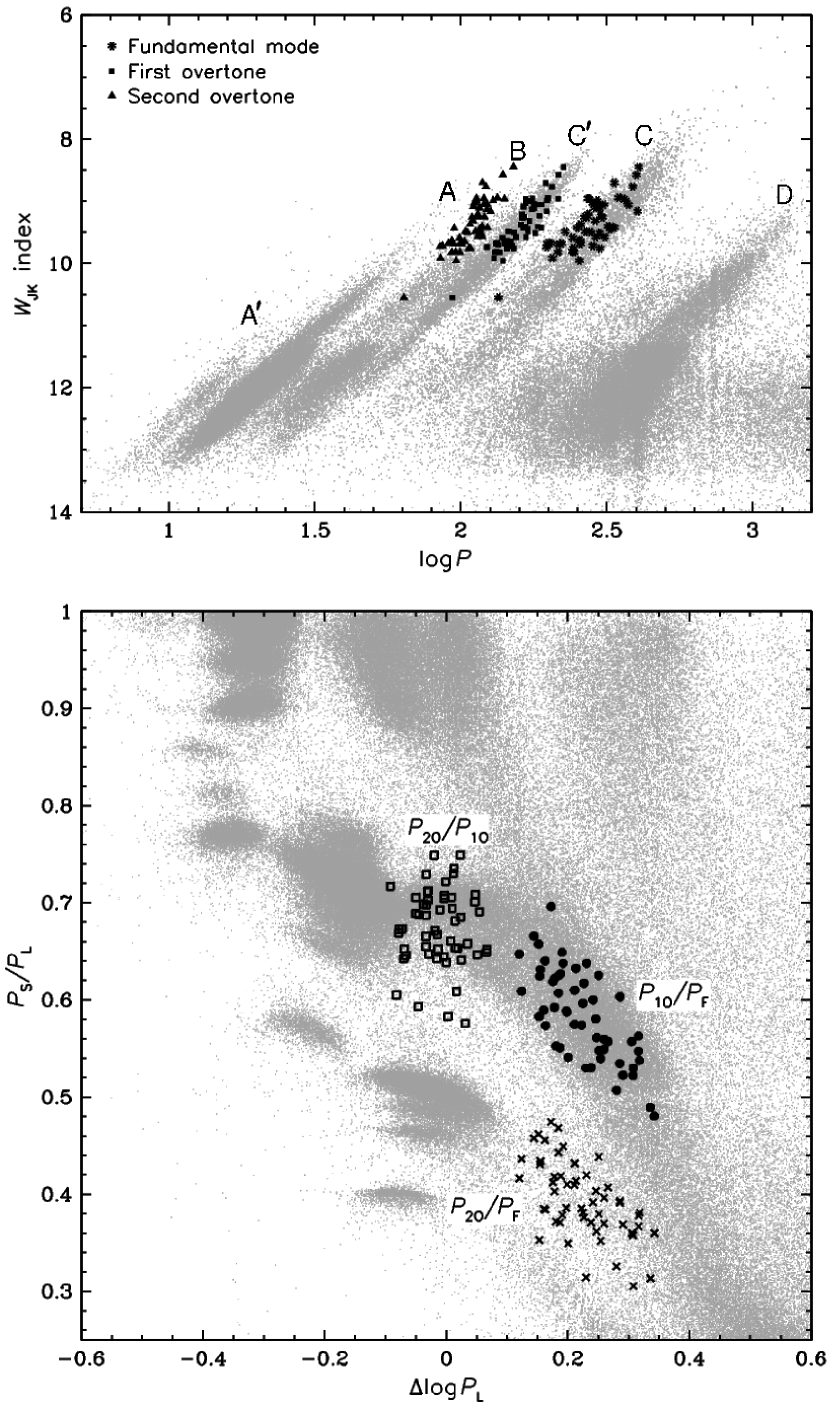
As a result of the visual examination we detected a limited number of about 50 candidates for triple-mode LPVs – with fundamental mode, first and second overtones excited. The location of these stars in the PL diagram and modified Petersen diagram is shown in Fig. 5. The fundamental-, first- and second-overtone modes fall on sequences C, C′ and B, respectively. The most important aspect of this result is that it unambiguously links together the SRVs and Miras from sequences C and C′ and the OSARG variables from sequence B (as well as A and A′).
It is striking that in spite of the fact that we analysed the whole sample of LPVs, we identified reliable candidates for triple-mode pulsators exclusively among brighter stars. Only one star in our sample is fainter than mag. In the lower part of the PL diagram we found a number of LPVs with the longest period falling on sequence C and two closely-spaced periods located roughly on sequence C′. Such a closely-spaced periods were also detected in the OSARG variables populating sequences A and B (Soszyński et al., 2004, 2007). Such a phenomenon may be caused by non-radial pulsation modes or by small variations of the pulsation periods, but not by consecutive radial modes.
Thus, in the lower part of the PL diagram we found no reliable examples of triple-mode pulsators, at least with the longest period falling on sequence C or F. It complicates the identification of the pulsation modes in this region. Most of SRVs have two periods: one falling on sequence C and the second lying on sequence C′.
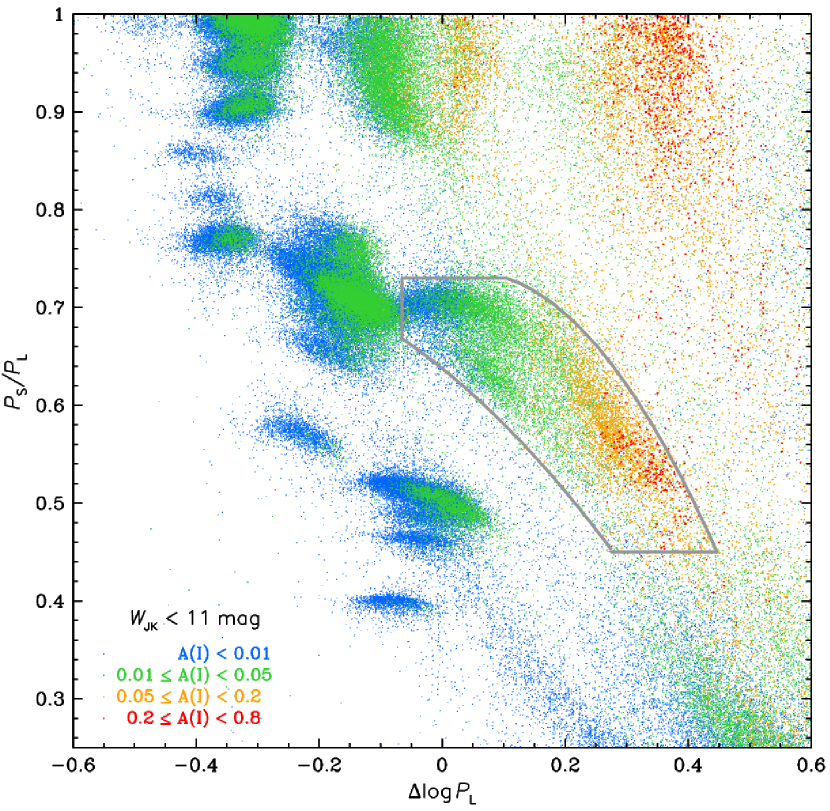
Fig. 6 displays the modified Petersen diagram for LPVs fainter than mag. The grey contour in this diagram roughly surrounds the area where and ratios were observed for brighter SRVs. As can be seen, there is no natural boundary that separates both groups, fundamental-mode/first-overtone and first-overtone/second-overtone pulsators overlap in the modified Petersen diagram. It means that the PL sequence associated with the fundamental mode extends much further toward the shorter periods than shown in the paper by Soszyński & Wood (2013). Probably some of the fundamental-mode periods fall on sequence C′ which had previously been associated with the first-overtone mode.
So, where is the short-period limit of the fundamental pulsation mode of LPVs? The definitive answer cannot be given just on the basis of the photometric observations, because it seems that different modes of pulsations of LPVs may overlap in the PL, Petersen and other empirical diagrams. This is because in the LMC we observe a mixture of red giants with different masses and in different evolutionary stages.
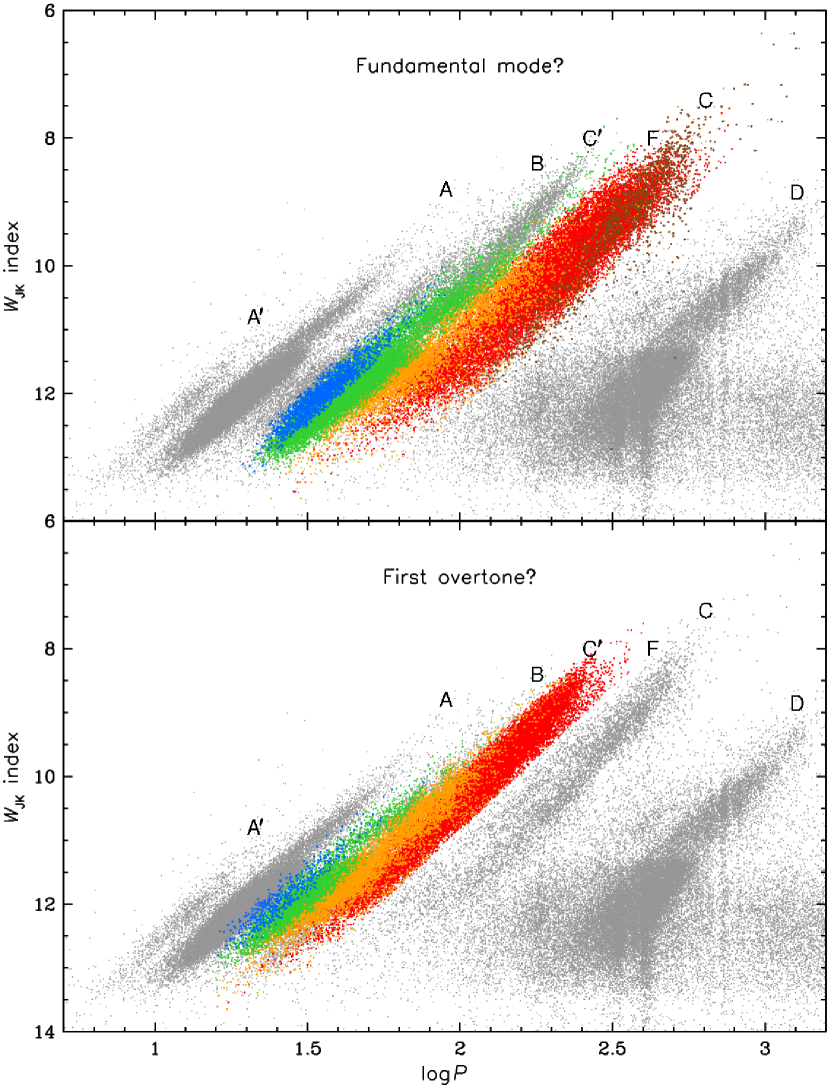
A clue about the range of the fundamental mode (and other modes) in the PL diagram can be given by the analysis of the longest pulsation periods of various LPVs (upper panel of Fig. 7). As previously noted, fundamental-mode periods of SRVs and Miras populate sequence C and space between sequences C and C′ (red and brown points in Fig. 7). OSARG variables obey a series of PL relations, of which the longest-period sequence roughly coincides with sequence C′ (ignoring sequence D which is not associated with any radial pulsation mode). However, the exact position of this PL relation depends on other pulsation periods of these multi-periodic variables. If we select OSARGs that do not have a period falling on either sequence A or sequence A′, and we plot them in the PL diagram, we can see two ridges, of which the longer one is located slightly to the right from sequence C′ (orange points in Fig. 7). OSARG stars which have a detectable period on sequence A, but do not have a detectable period on sequence A′, have their longest period more or less at the location of sequence C′ (green points in Fig. 7). Finally, OSARG variables with at least one of their periods on sequence A′ follow four PL relations, of which the longest one is located to the left from sequence C′ (blue points in Fig. 7). Although we are not sure that the longest period in all these LPVs correspond to the fundamental mode, this continuity in the position of the longest-period sequences suggests that the longest period is the fundamental mode.
In the lower panel of Fig. 7 we plot the PL sequences of the same stars but using the second longest pulsation period (with exception of Miras which are single-mode variables). These are candidates for first-overtone mode pulsation. As one can see, the fundamental mode and first overtone LPVs significantly overlap in the PL diagram.
5. Conclusions
In this paper we tried to assign pulsation modes to LPVs on different PL relations. For brighter SRVs we showed that sequences C, C′, and B are populated by the fundamental mode, first overtone, and second overtone, respectively. For fainter LPVs the fundamental modes of some LPVs overlap with the first-overtones of other pulsating red giants. The region of the PL plane occupied by the longest period of different types of LPVs forms a continuous wide ridge which spreads from OSARG variables (sequence C′), through SRb stars (sequence F of Soszyński & Wood, 2013) to SRa and Mira stars (sequence C). It is likely that all these periods are caused by the fundamental-mode pulsations, which is in agreement with the theoretical investigation of Dziembowski & Soszyński (2010) and is opposite to the mode identifications by Takayama et al. (2013). Similarly, the first-overtone pulsators (second longest periods) fall in a region that covers sequences B and C′. The exact position of different modes in the PL plane depends on the mass, metallicity and evolutionary status of a star. Variations in the mass and metallicity are the likely cause of the broad PL sequences.
One of the most important result of this paper is showing that OSARGs, SRVs and Miras constitute a continuity, with no break between these types of pulsating red giants. As a giant star evolves, it gradually changes from OSARG to SRV and finally to Mira, increasing its pulsating periods, limiting the number of excited modes, and increasing its amplitudes of variability. It seems that the boundary between OSARG variables and SRVs is arbitrary, as it is between SRVs and Miras (where the boundary is defined as the amplitude in the V band equal to 2.5 mag).
Acknowledgments
IS is indebted to Wojciech A. Dziembowski for many fruitful discussions on the topic of this paper. This work has been supported by the Polish Ministry of Science and Higher Education through the program “Ideas Plus” award No. IdP2012 000162. The research leading to these results has received funding from the European Research Council under the European Community’s Seventh Framework Programme (FP7/2007-2013)/ERC grant agreement no. 246678.
References
- Bányai et al. (2013) Bányai, E., Kiss, L. L., Bedding, T. R., et al. 2013, arXiv:1309.1012
- Bedding et al. (2010) Bedding, T. R., Huber, D., Stello, D., et al. 2010, ApJ, 713, L176
- Cutri et al. (2003) Cutri R. M., Skrutskie, M. F., van Dyk, S., et al., 2003, 2MASS All Sky Catalog of point sources (Pasadena, CA: NASA/IPAC)
- Dziembowski & Soszyński (2010) Dziembowski, W. A., & Soszyński, I. 2010, A&A, 524, A88
- Hekker et al. (2009) Hekker, S., Kallinger, T., Baudin, F., et al. 2009, A&A, 506, 465
- Ita & Matsunaga (2011) Ita, Y., & Matsunaga, N. 2011, MNRAS, 412, 2345
- Ita et al. (2004) Ita, Y., Tanabé, T., Matsunaga, N., et al. 2004, MNRAS, 347, 720
- Kiss & Bedding (2003) Kiss, L. L., & Bedding, T. R. 2003, MNRAS, 343, L79
- Soszyński et al. (2004) Soszyński, I., Udalski, A., Kubiak, M., et al. 2004, Acta Astron., 54, 129
- Soszyński et al. (2007) Soszyński, I., Dziembowski, W. A., Udalski, A., et al. 2007, Acta Astron., 57, 201
- Soszyński et al. (2009) Soszyński, I., Udalski, A., Szymañski, M. K., et al. 2009, Acta Astron., 59, 239
- Soszyński & Wood (2013) Soszyński, I., & Wood, P. R. 2013, ApJ, 763, 103
- Takayama et al. (2013) Takayama, M., Saio, H., & Ita, Y. 2013, MNRAS, 431, 3189
- Udalski (2003) Udalski, A. 2003, Acta Astron., 53, 291
- Wood & Sebo (1996) Wood, P. R., & Sebo, K. M. 1996, MNRAS, 282, 958
- Wood et al. (1999) Wood, P. R., Alcock, C., Allsman, R. A., et al. 1999, in IAU Symp. 191, Asymptotic Giant Branch Stars, ed. T. Le Bertre, A. Lebre, & C. Waelkens (Cambridge: Cambridge Univ. Press), 151
- Wray et al. (2004) Wray, J. J., Eyer, L., & Paczyński, B. 2004, MNRAS, 349, 1059