Lattice instabilities in bulk EuTiO3
Abstract
The phase purity and the lattice dynamics in bulk EuTiO3 were investigated both microscopically, using X-ray and neutron diffraction, 151Eu-Mössbauer spectroscopy, and 151Eu nuclear inelastic scattering, and macroscopically using calorimetry, resonant ultrasound spectroscopy, and magnetometry. Furthermore, our investigations were corroborated by theoretical studies. The perovskite symmetry, , is unstable at the - and - points of the Brillouin zone. The lattice instabilities are lifted when the structure relaxes in one of the symetries: , , with relative relaxation energy around. Intimate phase analysis confirmed phase purity of our ceramics. A prominent peak in the Eu specific density of phonon states at can be modeled in all candidate symmetries. A stiffening on heating around room temperature is indicative of a phase transition similar to the one observed in SrTiO3, however, although previous studies reported the structural phase transition to tetragonal phase our detailed sample purity analysis and thorough structural studies using complementary techniques did not confirm a direct phase transition. Instead, in the same temperature range, Eu delocalization is observed which might explain the lattice dynamical instabilities.
1Jülich Centre for Neutron Science JCNS and Peter Grünberg Institut PGI, JARA-FIT, Forschungszentrum Jülich GmbH, D-52425 Jülich, Germany
2Faculté des Sciences, Université de Liège, B-4000 Liège, Belgium
†Present address: European Synchrotron Radiation Facility, F-38043, Grenoble, France
3Peter Grünberg Institut, Quanten-Theorie der Materialien, Forschungszentrum Jülich and JARA, D-52425 Jülich, Germany
4CEITEC Brno University of Technology, 61600, Brno, Czech Republic
5Institut Laue-Langevin, F-38042, Grenoble, France
6Neutron Scattering Science Division, Oak Ridge National Laboratory, TN 37831, Oak Ridge, United States
7Jülich Centre for Neutron Science JCNS, Oak Ridge National Laboratory, TN 37831, Oak Ridge, United States
8Deutsches Electronen-Synchrotron, D-22607 Hamburg, Germany
9Institute of Physics ASCR, 18221, Prague, Czech Republic
1 Introduction
Perovskites exhibit cubic symmetry at high temperature, with space group and a large flexibility of site occupancy by a broad range of elements on the and sites [1] and flexibility in oxygen stoichiometry on the site [2], indicated in the general chemical formula . The oxygen in the perovskite unit cell form interconnected octahedra, the rotation of which are potentially responsible for distortions away from the cubic symmetry and structural transitions [3]. Ba, Sr, and, to a lesser extent, Eu perovskite titanates are interesting owing to their ferroelectric properties and their potential applications in information technology. EuTi is an incipient ferroelectric perovskite, like SrTi, with however magnetic cations on the -site and it undergoes a transition to a G-type antiferromagnetic phase below [4, 5]. Recently, ferroelectric instability in EuTi films [6] under tensile stress was reported. However, in bulk EuTi the cubic structure was till recently supposed to be stable down to LHe temperature [7]. Only lately some hints of an antiferrodistortive phase transition to a tetragonal phase were observed, but the critical temperature varied from to [8, 9, 10, 11]. These results were consistently checked by Goian . [12] and attributed to the sample quality.
Inelastic X-ray scattering on tiny single crystals was only very recently reported [13] and shows that the antiferrodistortive phase transition cannot be of order - disorder type, as was proposed by Bussmann-Holder [8, 14], but is instead displacive with a soft mode at the -point of the Brillouin zone. However, similar zone boundary phonon softening has been identified without the observation of a structural phase transition by Swainson [15] in relaxors.
In this study we present a detailed investigation of the phase purity, the crystallinity and the lattice dynamics in bulk polycrystalline EuTi using both microscopic and macroscopic measurements as well as theoretical calculations. We demonstrate that a lattice instability associated with Eu anharmonic displacements appears close to room temperature.
2 Methods
2.1 Experimental Techniques
Phase pure EuTiO3 polycrystalline samples were prepared using a stoichiometric ratio of precursors (Eu2O3 99.99% and Ti2O3 99.9%). The mixture was homogenised in a planetary ball mill, cold isostatically pressed at , and sintered in pure hydrogen at for 2 hours. The processing details are given elsewhere [16]. The sintered pellets had a relative density of . All measurements were performed on ceramic pieces or powder taken from the same pellet.
The crystallographic phase purity and potential structural transitions were checked by temperature dependent powder diffraction between and using high-energy synchrotron radiation, wavelength , at station 6-ID-D/APS. In order to extend the temperature range up to similar measurements were carried out with wavelength on the same sample at station P02.1/PETRAIII. The overall precision including sample size and detector pixel size was estimated using standard samples to for measurements carried out at 6-ID-D and for measurements carried out at P02.1. The atomic behaviour in EuTi was further studied by neutron diffraction. Europium is a strong neutron absorber [17], thus a thin homogeneous powder layer was prepared using of EuTi and placed between thin vanadium foils (). Neutron scattering data were collected between and using the time-of-flight, T.O.F., instrument POWGEN [18], with precision at , and between and using the T.O.F. instrument NOMAD [19] at the Spallation Neutron Source. The neutron pair distribution function, PDF, analysis was carried out on the data obtain at NOMAD by Fourier transformation of the total scattering function [20].
The phase purity was further investigated using 151Eu-Mössbauer spectroscopy between and on fine powder of EuTi, , mixed with BN, using a calibrated spectrometer.
Heat capacity measurements were recorded in the Quantum Design cryostat (QD-PPMS) utilising the built-in calorimeter. Measurements of both the addenda and sample were performed at the same temperatures between and with a point density in the region of interest. Every data point was measured three times and an average value was extracted.
The macroscopic lattice dynamics was probed by Resonant Ultrasound Spectroscopy (RUS) [21]. Temperature dependent spectra between kHz and a few MHz were recorded on a shaped sample () using an in-house spectrometer made with cylindrical Y-cut LiNbO3 thick transducers (Ø ) inside a QD-PPMS.
Magnetic characterizations was carried out in a Cryogenics Ltd. measurement system using AC susceptibility measurements below ( , at ) as well as DC susceptibility measurements ( , at ).
To support our macroscopical lattice dynamical characterization microscopic investigations based on nuclear inelastic scattering [22], NIS, of in EuTi were performed. Several spectra were recorded at , , and in 16-bunch mode at the nuclear resonance station ID22N/ESRF [23] using a nested monochromator [24] providing resolution.
2.2 Theoretical Techniques
The Eu specific density of phonon states, the spectral distribution of the Eu vibrational amplitude, for , and structures were calculated using the PHON code [25] by integrating the eigenvectors and eigenvalues of the corresponding dynamical matrices over the Brillouin zone. We used a -point mesh and the experimental FWHM for Gaussian convolution. Details on the calculation of the dynamical matrices as well as the crystallographic parameters of the used structures are given in Ref. [26].
3 Results
3.1 Microscopic Characterization
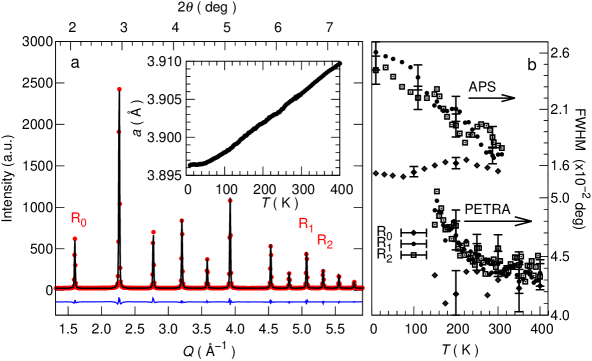
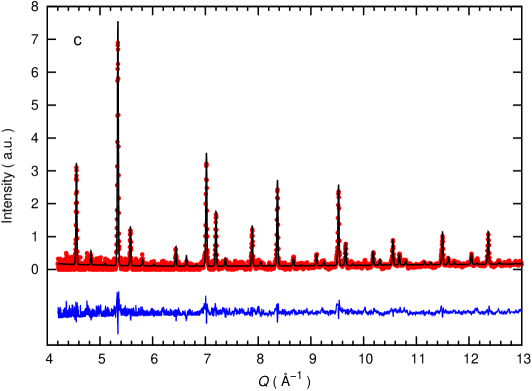
A typical X-ray diffractogram recorded on polycrystalline EuTiO3 is shown in Fig.1a. The range of our scattering data reached approximately using neutrons. A typical T.O.F. neutron diffractogram is given in Fig.1c. All observed reflections were identified in all possible symmetries. No peak splitting characteristic of structural phase transitions was observed in our temperature dependent measurements using both X-rays and neutrons. In order to account for any resolution limited satellite reflection the Full Width Half Maximum, FWHM, of all reflections was studied using a Lorentzian profile. The extracted FWHM of selected reflections between and (indicated in Fig.1a by in or {,} in or {, , } in or {, , , , , } in and in or {, , } in or {, } in or {, , } in ) are shown in to Fig.1b. The FWHM of all the examined reflections which are supposed to split broadens upon cooling below . This is not the case for in or in which shows temperature independent FWHM. Although the observation of temperature dependent FWHM in some particular reflections might be indicating departure from cubic symmetry, new reflections were not observed in our diffractogram. The diffraction data were further refined with Fullprof [27] using the Rietveld method. A typical refinement, with , is shown in Fig.1a. The inset to Fig.1a shows the extracted lattice parameter in cubic symmetry temperature. The extracted lattice parameter is in excellent agreement with reference data [7]. Linear thermal expansion is observed between and . The calculated volume thermal expansion coefficient, , after fitting the lattice parameter with a linear function normalised to the lattice parameter at is .
Minor deviations from linearity are observed between and which might support the claim of instabilities in this region. However, no sign for a phase transition is observed.
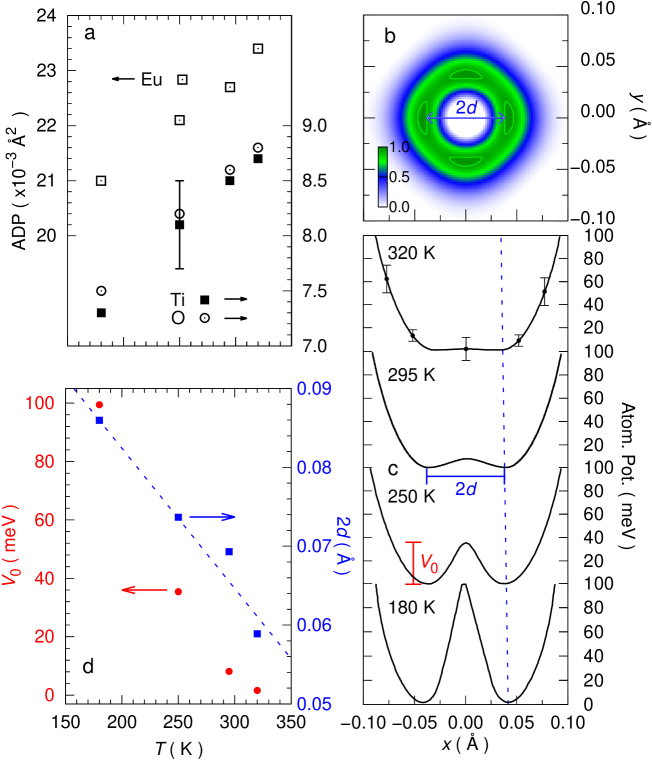
The neutron diffraction data obtained at POWGEN were further refined with JANA2006 [28] using the Rietveld method resulting in . The extracted lattice parameter in cubic symmetry is in excellent agreement with the one extracted using X-rays. In addition, the atomic displacement parameters, ADP, of Eu, Ti and O at extracted in the harmonic approximation are , and respectively and do not show any substantial irregularity temperature. Note that in isostructural SrTiO3 the atomic displacements of Sr and Ti in the antiferrodistortive phase are comparable [29] to that of Eu in EuTiO3.
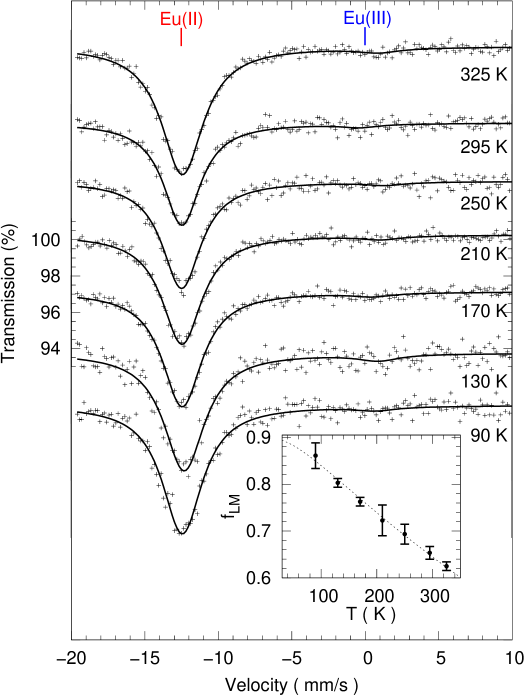
Typical Mössbauer spectra between and are given in Fig.2. The data were fitted with a two component model, the second component contributing by less than to the total area. The extracted isomer shift for the major component is relative to Eu, an isomer shift indicative of Eu(II). Thus, the sample contained purely divalent Eu. The upper limit of Eu(III) which might escape detection is . A Debye temperature of , was calculated within the Debye approximation [30] from the temperature dependent Lamb - Mössbauer factor, . In contrast to the prediction by Bussmann-Holder [8] no line splitting or broadening was found in our temperature dependent Mössbauer spectra.
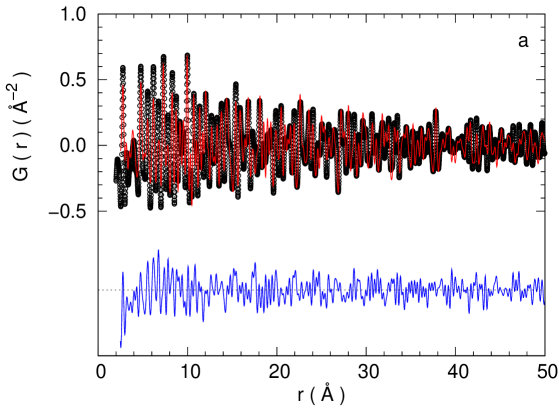
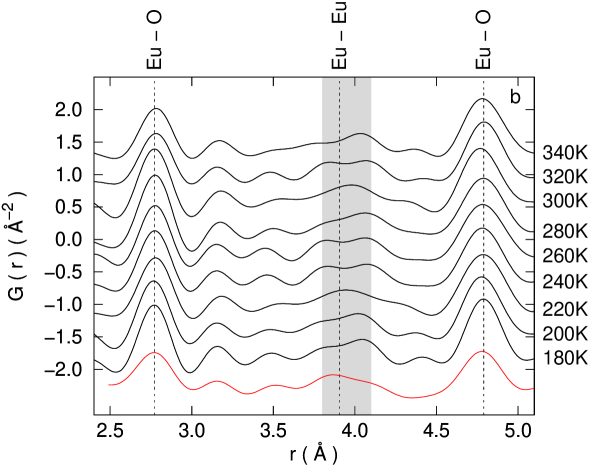
Pair Distribution Function analysis (PDF) probes local disorder in crystalline materials [32, 33]. In contrast to Rietveld refinements, the diffuse scattering and other background contributions are of crucial importance because a Fourier transformation is applied to the total scattering function. In this case, the large neutron absorption combined with the time-of-flight instrument prevent accurate background subtraction and produces oscillations in the extracted PDF thus in this study background contributions are treated phenomenologically. The refinement was conducted using PDFgui [34] between and , see Fig.3a. Within the limited precision of our extracted PDF no clear change with temperature in the interatomic distances of oxygen with europium is observed, see Fig.3b.
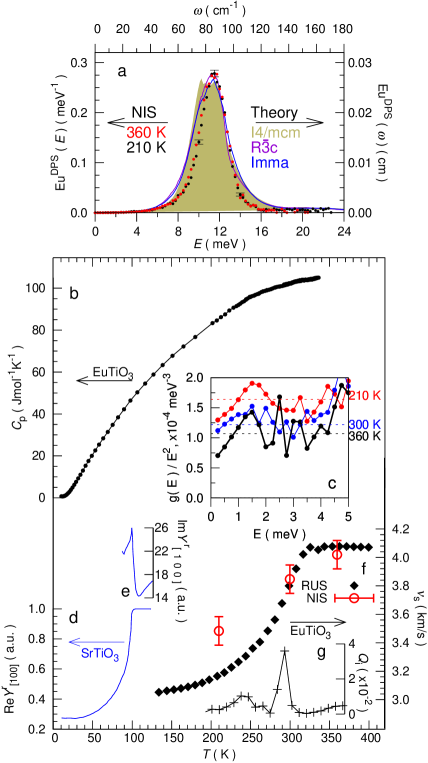
Several experimental methods for probing lattice dynamics exist. However, access to the full Density of Phonon States (DPS), , is feasible only by inelastic neutron [35] or X-ray scattering [36]. In this work, nuclear resonance inelastic measurements which requires the existence of Mössbauer active isotope and synchrotron radiation were carried out. The raw spectra were treated using a modified version [37] of the program DOS [38]. The 151Eu-specific density of phonon states [39], DPS, was extracted between and , see Fig.4a. A single peak around is observed, in agreement with our first principles calculations in all possible symmetries. No resolvable change has been observed in the 151Eu DPS between and . The 151Eu mean force constant can be extracted from our data using the expression , where is the mass of the resonant isotope. Between and the extracted 151Eu mean force constant ranges from to . From our NIS data the Eu ADP, , were extracted using , where is the wavenumber of the resonant photons. are in fair agreement with these extracted from neutron diffraction due to incoherent - coherent origin, respectively [40]. In the long wavelength limit, in this work assumed below , the average speed of sound, s, can be extracted from the DPS using: limE→0 [41] where is the isotopic mass and is the mass density. A linear fit of the , below , between and is given in Fig. 4c. The extracted speed of sound is included in the same figure.
3.2 Macroscopic Characterization
In order to verify claims of a striking phase transition observed in the heat capacity, , of EuTi [8, 42] the same cryostat, Quantum Design, was used. Special attention was taken on the thermal coupling between the measuring platform and the sample [43]. Every data point was measured three times and an average value has been extracted. The averaged data are shown in Fig.4b. The measured heat capacity in EuTi reveals no evidence of a structural phase transition in contrast with what has been observed in Ref. [8, 42] and using similar techniques in SrTi [44]. Hence, we conclude that the observation reported in Ref. [8, 42] is related either to sample purity or inadequate background subtraction.
The isotropic elastic tensor, and , was extracted from the spectrum of resonant ultrasound spectroscopy and the bulk, , and shear, , moduli were calculated. The extracted polycrystal shear wave speed, , is shown in Fig.4f. In Fig.4g the inverse quality factor, [45], of a typical mechanical resonance at is shown. The average speed of sound calculated from the isotropic elastic tensor indicates hardening at relative to . Similar behaviour was observed on a second sample from the same batch.
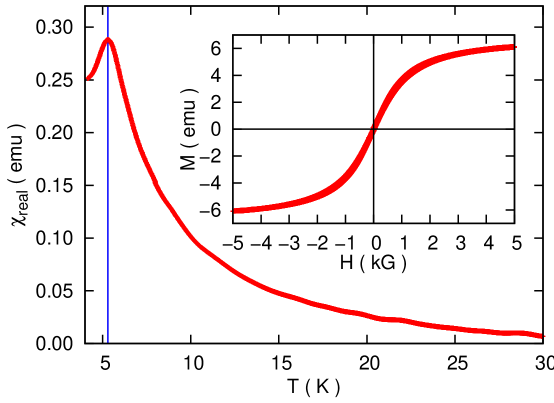
In our magnetic characterization measurements, see Fig. 5, a prominent peak at appears in magnetic susceptibility. No other magnetic transitions were identified below . Below the observed transition, at , dc magnetization was measured up to and neither a hysteretical behavior nor a ferromagnetic contribution were observed.
3.3 Theoretical Investigations
Our first-principle calculations [26] on EuTi show that the symmetry is unstable at the - and - points of the Brillouin zone with respect to the rotation of the oxygen octahedra. The lattice instabilities are removed when the structure relaxes in one of three symmetries: tetragonal (), orthorhombic () or rhombohedral () all with relative relaxation energies between and to the cubic symmetry. The energy difference between the distorted structures is very small and allows in fact polymorphism. The Eu specific density of phonon states in all calculated structures is in excellent agreement with the measured one, see Fig.4a. We note that although in phase a Eu atomic displacement is allowed and its calculated size [26] is .
4 Discussion
Although no obvious structural instability was identified by diffraction or calorimetry, a prominent acoustical stiffening upon heating is nevertheless observed between and , a stiffening which is coroborated by a peak in the quality factor, , at . In the same temperature range the diffraction peaks which are suppose to split upon phase transition broaden on cooling, see Fig.1. Above the FWHM of the same reflections as well as the speed of sound are found to be essentially temperature independent. A similar behaviour was observed in the real and imaginary part of Young’s modulus around in SrTi [31], see Fig. 4d and Fig. 4e, however, in SrTi a well known structural transition around takes place [46]. Based on ultrasonic experiments Rehwald [47] qualifies the observed phase transition in SrTi as a second order and not as order-disorder but as soft mode type. In order to understand the nature of the accoustical stiffening in EuTi which appears rather similar to the one observed in SrTi detailed structural and phase purity analysis was carried out.
Divalent Eu based titanium compounds, such as EuTi, have been investigated extensively by McGuire [48] owing to their remarkable variety in magnetic properties. Among them, pyrochlore compound Eu3Ti2O7 and Eu2TiO4 perovskite are impurity candidates in any EuTiO3 sample. According to literature[49], both compounds show ferromagnetic transitions around . However, in our magnetization data, see Fig.5, neither ferromagnetic transition appeared around nor is a ferromagnetic contribution present in the curve below the antifferomagnetic transition temperature. As a result, within our instrumental resolution and with the combined use of several characterization methods, neither Eu3Ti2O7 nor Eu2TiO4 are present in our sample. Thus combining the results of magnetic characterization with the Mössbauer spectroscopy our sample properties are consistent with the reported antiferromagnetic properties of EuTi [49] and preclude other europium titanates [50, 51, 52].
Mössbauer spectroscopy and nuclear inelastic spectroscopy are complementary methods since they are based on the same principle. This is illustrated once more by the fact that the NIS extracted agrees within with the one extracted by Mössbauer spectroscopy. From the long wavelength limit, below , of the DPS the speed of sound, s, was calculated. The DPS extracted speed of sound indicates hardening of EuTi versus temperature, as observed also using RUS, see Fig. 4f. Both microscopic and macroscopic measurements are in good agreement. The deviation at is reproducible and can be associated with isothermal speed of sound measured via scattering, and adiabatic sound measured with RUS. As a result, the increase in speed of sound upon heating is verified both by microscopic and macroscopic techniques and is in contrast to the usual softening of elastic constants upon heating [53] confirming lattice instability of EuTi between and . The temperature behaviour of the adiabatic speed of sound is not consistent with an order - disorder transition[47].
Pair Distribution Function analysis (PDF) probes local disorder in crystalline materials [32, 33]. The PDF can be derived either from X-ray or neutron total scattering data with advantages and disadvantages described extensively by Egami and Billinge [20]. In this study we carried out PDF analysis on our neutron data because if there was any potential oxygen displacement it would be more visible using neutrons due to the enhanced neutron cross section with respect to X-rays. The main information extracted from PDF without further modeling is the interatomic distances, see Fig.3b. Ti has a negative coherent scattering length which results in negative peaks for the ,-Ti correlations, where and are the perovskite sites. Europium neutron absorption introduces anomalous background in the total scattering as function of the scattering angle. Hence, the Fourier transformation of the total scattering function might introduce artifacts in the PDF which cannot be modeled. Fig.3a shows the room temperature PDF of EuTiO3. Although all interatomic distances were modelled sucessfully and the extracted parameters (lattice parameters, atomic displacement parameters) agree with those extracted from Rietveld refinement, the goodness of fit is relatively poor. In case there was a pronounced phase transition, the interatomic distance between Eu - Eu, Ti - Ti and O - O it would change and a doublet instead of single peak is expected at the corresponding interatomic distance. However, the highlighted part of Fig.3b does not show any consistent variation. The expected Eu - Eu correlation peak, and similarly the Ti - Ti and O - O, is not observed probably because the variations in PDF introduced by Eu absorption was not modelled correctly.
| Temperature ( K ) | ||||
|---|---|---|---|---|
Although absolute values of ADP extracted using coherent techniques such as diffraction might be affected by occupancies, relative changes of the ADP extracted from such measurements are still valid. Although all extracted ADP have smooth dependence on temperature the Eu ADP is large as compared to Ti and O, see Fig. 6a. Hence, a Fourier map study in the vicinity of Eu was carried out. The Gram-Charlier expansion of anharmonic atomic displacement parameters is extensively described in Ref. [54] and has been followed in several cases of perovskite structure [55, 56] with reported anharmonic atomic displacements. In this study, the Eu atomic displacement parameters extracted from neutron diffraction assuming cubic symmetry, , was modeled using a Gram-Charlier expansion of the probability density function, p.d.f., , up to fourth-rank tensor[57] given in Eq. 1.
| (1) |
where is the atomic displacement vector relative to the equilibrium position, is the Hermite polynomial of fourth order and are anharmonic refined parameters (the third-order cumulants, are zero, based on the site symmetry). The use of a fourth order Gram-Charlier expansion [54] for the Eu ADP improves the refinement. A reduction of the reliability factor from to just by adding a single parameter has been observed. The refined Eu anharmonic parameters at , , and are given in the Table 1. Indeed, the Gram-Charlier tensor is following the symmetry restriction and therefore for the Eu at ; are zero and are non zero only for and . To justify the existence of such anharmonic behavior on the Eu site similar treatment has been attempted on the Ti and O sites. No major refinement improvement has been observed and thus we have no evidence for strong anharmonic behavior on the Ti and O sites. In Fig.6b the europium p.d.f. after final refinement at is illustrated. Eu exhibits off-centering in and directions (and equivalently in the direction) with significant residual probability density in the azimuthal direction. The effective one-particle atomic potential, , is related to the p.d.f. by:
| (2) |
where is the Boltzmann constant and is temperature. In Fig.6 a section of the Eu one-particle potential extracted according to the Eq. 2 is depicted along the direction. These sections reveal that Eu exhibits temperature dependent off-centering, see Fig.6d, with at . In addition, the potential barrier along the azimuthal direction flattens well before , whereas at a double well potential is already formed. Note that this is the same temperature region in which specific diffraction peaks, see Fig. 1, start to broaden upon cooling. Above , the Eu p.d.f forms a plateau. An analogous double-well potential for EuTiO3 was suggested theoretically by Bettis [14] although for oxygen displacement.
The plateau in the p.d.f. indicates increased Eu anharmonicity. In order to quantify anharmonicity, we estimated using our macroscopic measurements of , , and the Grüneisen rule [58] the Grüneisen parameter. Our estimation of at is, , in the same range with typical metallic compounds, . To elucidate the impact of the Grüneisen parameter on our measured DPS we used the vibrational frequency definition of the Grüneisen parameter, , which relates the change in phonon mode energy to the change in volume. The estimated phonon mode energy shift, between and using our measured and our extracted average Grüneisen parameter of results in . Therefore, the prominent peak, around will not shift due to anharmonicity by more than . Such energy mode shift is currently resolution limited.
EuTiO3 is an incipient ferroelectric, which means that its lattice is close to a ferroelectric instability at low temperatures. Note that theoretical calculations[26] indicate that the Eu displacement from its high-symmetry position is possible in tilted structures, , however, this displacement is static. Significant dynamical displacement of Eu was observed in cubic structure even for the low-energy optical mode TO1, which eigenvector constitutes of Last mode and of the Slater, see Ref. [26]. This observation was used to design ferroelectirc ceramics with significant off-centering on the magnetic cation site [59]. Also magnetoelectric coupling in EuTiO3 is exceptionally high [60] due to strong contribution of magnetic Eu cation in low energy polar mode. Note that in other multifferroics non-magnetic ions are displaced, Bi in BiFeO3 or Y in YMnO3, therefore the magnetoelectric coupling is usually smaller in such materials. Microscopic origin of the mixing character of the low-energy polar mode in cubic is the coupling of the 4f orbitals of Eu2+ with the 3d states of nonmagnetic Ti4+[61]. The influence of this coupling on the lattice instabilities of was recently studied by Birol and Fennie [62]. It was found that partial occupation of the d-states on Ti due to hybridization drives away from ferroelectric instability. This conclusion is compatible with results of Ref. [26], where it was shown that increasing volume of cubic , decreasing f-d hybridization, turns the low-energy mode to be unstable, with Slater type atomic displacement. Nevertheless, it is still not clear what is the effect of the oxygen vacancy on the structural stability of . Recently, it was shown [63] that doping by N favors the tilted structure also at high temperatures. By means of hybrid functional calculations of electronic structure it was shown that the presence of impurities as well as the tilting of oxygen octahedra lead to delocalization of the Eu f-states, which modifies f-d coupling between A and B sites and, therefore, changes the lattice stability conditions. Note, that is subgroup of the considered in Ref. [26], and is the one with off-centered Eu position. Thus, this particular field is still open to research and further theoretical and experimental studies are yet to come which will clarify the microscopic origin of the observed Eu shift in EuTiO3.
The lattice dynamics in EuTi resembles that of SrTi, the atomic delocalization in phase change materials [64] as well as the lattice dynamics in PbTe [65, 66]. In such cases the associated potential energy is considered as a multi-valley surface with drastical impact on thermal conductivity [67]. The observed phenomenon resembles rattling between minima in the potential energy and could be harnessed to lower the lattice thermal conductivity.
5 Conclusion
In summary, the combination of the extracted speed of sound by RUS and NIS, the Gram - Charlier expansion of Eu atomic displacements based on neutron diffraction and the feedback from theoretical studies based on calculations provides evidence for europium delocalization which originate in a lattice instabilities in the system. Short range coexistence of crystallographic phases with candidate symmetries , and in EuTi might be related to the fact that Eu delocalization does not lead to a structural transition. Experimental studies under high pressure on phase pure EuTiO3 single crystals or thermal diffuse scattering experiments using synchrotron radiation might shed further light on this scenario. In addition, according to theoretical calculations a Eu atomic displacement is allowed in the phase and its calculated size [26], , corresponds roughly to the one measured in our experiment, however, phase transition with long range order is not observed. Reasonable scenarios might be nucleation of nanoclusters with symmetry and different distortion direction which fail to extend to a reasonable corellation length or dynamical fluctuation of the distortion. Measurements of acoustic emission as it was presented [68] on BaTiO3 might clarify this scenario. Similar atomic off-centering has been observed in a series of ferroelectric compounds such as and [69].
6 Acknowledgements
The Helmholtz Association of German research centers is acknowledged for funding (VH NG-407 “Lattice dynamics in emerging functional materials” and VH NG-409 "Computational Nanoferronics Laboratory"). The European Synchrotron Radiation Facility, the Advanced Photon Source, the PETRAIII and the Spallation Neutron Source are acknowledged for provision of synchrotron radiation and neutron beam time at ID22N, 6-ID-D, P02.1, POWGEN and NOMAD respectively. The work in the Czech Republic has been supported by the Czech Science Foundation (Project No. P204/12/1163), MEYS (LD 11035 and LD 12026 - COST MP0904) and the ERDF (CEITEC - CZ.1.05/1.1.00/02.0068). We are grateful to Dr. D. Robinson, Dr. M. Feygenson and Dr. J. Neuefeind for help during data acquisition and Jülich Supercomputing Center for support.
References
- Li et al. [2004] C. Li, K. C. K. Soh, and P. Wu, J. Alloys Compd. 372, 40 (2004).
- Zhou and Goodenough [2005] H. D. Zhou and J. B. Goodenough, J. Phys. Condens. Matter 17, 7395 (2005).
- Glazer [1972] A. M. Glazer, Acta Crystallogr., Sect. B 28, 3384 (1972).
- McGuire et al. [1966] T. R. McGuire, M. W. Shafer, R. J. Joenk, H. A. Alperin, and S. J. Pickart, J. Phys. Condens. Matter 37, 981 (1966).
- Katsufuji and Takagi [2001] T. Katsufuji and H. Takagi, Phys. Rev. B 64, 054415 (2001).
- Lee et al. [2010] J. H. Lee et al., Nature 466, 954 (2010).
- Brous et al. [1953] J. Brous, I. Fankuchen, and E. Banks, Acta Cryst. 6, 67 (1953).
- Bussmann-Holder et al. [2011] A. Bussmann-Holder, J. Köhler, R. K. Kremer, and J. M. Law, Phys. Rev. B 83, 212102 (2011).
- Allieta et al. [2012] M. Allieta, M. Scavini, L. J. Spalek, V. Scagnoli, H. C. Walker, C. Panagopoulos, S. S. Saxena, T. Katsufuji, and C. Mazzoli, Phys. Rev. B 85, 184107 (2012).
- Köhler et al. [2012] J. Köhler, R. Dinnebier, and A. Bussmann-Holder, Phase Transitions 85, 949 (2012).
- Kim et al. [2013] J.-W. Kim, P. Thompson, S. Brown, P. S. Normile, J. A. Schlueter, A. Shkabko, A. Weidenkaff, and P. J. Ryan, Phys. Rev. Lett. 110, 027201 (2013).
- Goian et al. [2012] V. Goian, S. Kamba, O. Pacherová, J. Drahokoupil, L. Palatinus, M. Dušek, J. Rohlíček, M. Savinov, F. Laufek, W. Schranz, et al., Phys. Rev. B 86, 054112 (2012).
- Ellis et al. [2012] D. S. Ellis, H. Uchiyama, S. Tsutsui, K. Sugimoto, K. Kato, D. Ishikawa, and A. Q. R. Baron, Phys. Rev. B 86, 220301 (2012).
- Bettis et al. [2011] J. L. Bettis, M.-H. Whangbo, J. Köhler, A. Bussmann-Holder, and A. R. Bishop, Phys. Rev. B 84, 184114 (2011).
- Swainson et al. [2009] I. P. Swainson, C. Stock, P. M. Gehring, G. Xu, K. Hirota, Y. Qiu, H. Luo, X. Zhao, J.-F. Li, and D. Viehland, Phys. Rev. B 79, 224301 (2009).
- Kachlik et al. [2012] M. Kachlik, K. Maca, V. Goian, and S. Kamba, Mater. Lett. 74, 16 (2012).
- Ross and Story [1949] M. Ross and J. S. Story, Rep. Prog. Phys. 12, 291 (1949).
- Huq et al. [2011] A. Huq, J. Hodges, L. Huke, and O. Gourdon, Z. Kristallogr. Proc. 1, 127 (2011).
- J. Neuefeind and Chipley [2012] J. C. R. H. J. Neuefeind, M. Feygenson and K. K. Chipley, Nucl. Instrum. Methods Phys. Res., Sect. B 287, 68 (2012).
- Egami and Billinge [2003] T. Egami and S. J. L. Billinge, Underneath the Bragg Peaks: Structural Analysis of Complex Materials (Pergamon Press, 2003).
- Migliori et al. [1993] A. Migliori, J. Sarrao, W. M. Visscher, T. Bell, M. Lei, Z. Fisk, and R. Leisure, Physica B 183, 1 (1993).
- Alp et al. [2002] E. Alp, W. Sturhahn, T. Toellner, J. Zhao, M. Hu, and D. Brown, Hyperfine Interact. 144-145, 3 (2002).
- Rüffer and Chumakov [1996] R. Rüffer and A. Chumakov, Hyperfine Interact. 97-98, 589 (1996).
- Leupold et al. [1996] O. Leupold, J. Pollmann, E. Gerdau, H. D. Rüter, G. Faigel, M. Tegze, G. Bortel, R. Rüffer, A. I. Chumakov, and A. Q. R. Baron, Europhys. Lett. 35, 671 (1996).
- Alfè [2009] D. Alfè, Comput. Phys. Commun. 180, 2622 (2009).
- Rushchanskii et al. [2012] K. Z. Rushchanskii, N. A. Spaldin, and M. Lezaic, Phys. Rev. B 85, 104109 (2012).
- Rodríguez-Carvajal [1993] J. Rodríguez-Carvajal, Physica B 192, 55 (1993).
- Petříček et al. [2006] V. Petříček, M. Dušek, and L. Palatinus, Jana 2006. The crystallographic computing system. (2006).
- Kopecký et al. [2012] M. Kopecký, J. Fábry, and J. Kub, J. Appl. Cryst. 45, 393 (2012).
- Herber [1984] R. H. Herber, Chemical Mössbauer Spectroscopy (Plenum Press, 1984).
- Kityk et al. [2000] A. V. Kityk, W. Schranz, P. Sondergeld, D. Havlik, E. K. H. Salje, and J. F. Scott, Europhys. Lett. 50, 41 (2000).
- Qiu et al. [2005] X. Qiu, T. Proffen, J. F. Mitchell, and S. J. L. Billinge, Phys. Rev. Lett. 94, 177203 (2005).
- Jeong et al. [2005] I.-K. Jeong, T. W. Darling, J. K. Lee, T. Proffen, R. H. Heffner, J. S. Park, K. S. Hong, W. Dmowski, and T. Egami, Phys. Rev. Lett. 94, 147602 (2005).
- Farrow et al. [2007] C. L. Farrow, P. Juhas, J. W. Liu, D. Bryndin, E. S. Boin, J. Bloch, T. Proffen, and S. J. L. Billinge, J. Phys. Condens. Matter 19, 335219 (2007).
- Christensen et al. [2006] M. Christensen, N. Lock, J. Overgaard, and B. B. Iversen, J. Am. Chem. Soc. 128, 15657 (2006).
- Burkel [2000] E. Burkel, Rep. Prog. Phys. 63, 171 (2000).
- [37] The DOS program was modified for reconvoluting the extracted DPS with a Gaussian function with the same FWHM as the measured instrumental function.
- Kohn and Chumakov [2000] V. Kohn and A. Chumakov, Hyperfine Interact. 125, 205 (2000).
- [39] The natural abundance of is 47.8% and no further isotopic enrichment was needed.
- Sales et al. [2001] B. C. Sales et al., Semiconductors and Semimetals (Academic Press, 2001).
- Ashcroft and Mermin [1976] N. W. Ashcroft and N. D. Mermin, Solid State Physics (Brooks / Cole, 1976).
- Petrović et al. [2013] A. P. Petrović, Y. Kato, S. S. Sunku, T. Ito, P. Sengupta, L. Spalek, M. Shimuta, T. Katsufuji, C. D. Batista, S. S. Saxena, et al., Phys. Rev. B 87, 064103 (2013).
- QD-PPMS [2002] QD-PPMS, Heat Capacity Application Note (2002).
- Gallardo et al. [2002] M. C. Gallardo, R. Burriel, F. J. Romero, F. J. Gutiérrez, and E. K. H. Salje, J. Phys. Condens. Matter 14, 1881 (2002).
- [45] The inverse quality factor quantifies the dampness of an oscillator.
- Lytle [1964] F. W. Lytle, J. Appl. Phys. 35, 2212 (1964).
- Rehwald [1973] W. Rehwald, Adv. Phys. 22, 721 (1973).
- McGuire et al. [1963] T. R. McGuire, B. E. Argyle, M. W. Shafer, and J. S. Smart, J. Appl. Phys. 34, 1345 (1963).
- Greedan and McCarthy [1972] J. E. Greedan and McCarthy, Mat. Res. Bull. 7, 531 (1972).
- Henderson et al. [2007] N. L. Henderson, J. Baek, P. S. Halasyamani, and R. E. Schaak, Chem. Mater. 19, 1883 (2007).
- Syamala et al. [2008] K. Syamala, G. Panneerselvam, G. Subramanian, and M. Antony, Thermochim. Acta 475, 76 (2008).
- McCarthy et al. [1969] G. McCarthy, W. White, and R. Roy, J. Inorg. Nucl. Chem. 31, 329 (1969).
- Varshni [1970] Y. P. Varshni, Phys. Rev. B 2, 3952 (1970).
- Kuhs [1992] W. F. Kuhs, Acta Crystallogr., Sect. A: Found. Crystallogr. 48, 80 (1992).
- Etschmann et al. [2001] B. Etschmann, N. Ishizawa, V. Streltsov, and S. Oishi, Z. Kristallogr. 216, 455 (2001).
- Zhurova et al. [2000] E. A. Zhurova, Y. Ivanov, V. Zavodnik, and V. Tsirelson, Acta Crystallogr., Sect. B: Struct. Sci 56, 594 (2000).
- ITf [1995] International Tables for Crystallography (International Union of Crystallography, 1995).
- Gopal [1966] E. S. R. Gopal, Specific Heats at Low Temperatures (Heynwood Books, 1966).
- Rushchanskii et al. [2010] K. Rushchanskii, S. Kamba, V. Goian, P. Vaněk, M. Savinov, J. Prokleška, D. Nuzhnyy, K. Knížek, F. Laufek, S. Eckel, et al., Nat. Mater. 9, 649 (2010).
- Shvartsman et al. [2010] V. V. Shvartsman, P. Borisov, W. Kleemann, S. Kamba, and T. Katsufuji, Phys. Rev. B 81, 064426 (2010).
- Akamatsu et al. [2011] H. Akamatsu, Y. Kumagai, F. Oba, K. Fujita, H. Murakami, K. Tanaka, and I. Tanaka, Phys. Rev. B 83, 214421 (2011).
- Birol and Fennie [2013] T. Birol and C. J. Fennie, Phys. Rev. B 88, 094103 (2013).
- Sagarna et al. [2013] L. Sagarna, K. Z. Rushchanskii, A. Maegli, S. Yoon, S. Populoh, A. Shkabko, S. Pokrant, M. Lezaic, R. Waser, and A. Weidenkaff, J. Appl. Phys. 114, 033701 (2013).
- Matsunaga et al. [2011] T. Matsunaga, N. Yamada, R. Kojima, S. Shamoto, M. Sato, H. Tanida, T. Uruga, S. Kohara, M. Takata, P. Zalden, et al., Adv. Funct. Mater. 21, 2232 (2011).
- Jensen et al. [2012] K. M. Jensen, E. S. Božin, C. D. Malliakas, M. B. Stone, M. D. Lumsden, M. G. Kanatzidis, S. M. Shapiro, and S. J. L. Billinge, Phys. Rev. B 86, 085313 (2012).
- Božin et al. [2010] E. S. Božin, C. D. Malliakas, P. Souvatzis, T. Proffen, N. A. Spaldin, M. G. Kanatzidis, and S. J. L. Billinge, Science 330, 1660 (2010).
- Christensen et al. [2010] M. Christensen, S. Johnsen, and B. B. Iversen, Dalton Trans. 39, 978 (2010).
- Dul’kin et al. [2010] E. Dul’kin, J. Petzelt, S. Kamba, E. Mojaev, and M. Roth, Appl. Phys. Lett. 97, 032903 (2010).
- Egami [2007] T. Egami, in Ferro- and Antiferroelectricity, edited by N. Dalal and A. Bussmann-Holder (Springer, 2007), vol. 124, pp. 69–88, ISBN 978-3-540-49602-1.