Morphologies of protostellar outflows: An ALMA view
Abstract
The formation of stars is usually accompanied by the launching of protostellar outflows. Observations with the Atacama Large Millimetre/sub-millimetre Array (ALMA) will soon revolutionalise our understanding of the morphologies and kinematics of these objects. In this paper, we present synthetic ALMA observations of protostellar outflows based on numerical magnetohydrodynamic collapse simulations. We find significant velocity gradients in our outflow models and a very prominent helical structure within the outflows. We speculate that the disk wind found in the ALMA Science Verification Data of HD 163296 presents a first instance of such an observation.
1 Introduction
Protostellar outflows are generally byproducts of star formation in the full range from low- to high-mass star-forming regions (Cabrit & André, 1991; Bachiller, 1996; Reipurth & Bally, 2001; Shepherd, 2005; Beuther & Shepherd, 2005; Arce et al., 2007; Bally et al., 2007; Bally, 2007, 2008). Here we focus our attention on outflows from intermediate-mass protostars of a few solar masses, with typical mass-loss rates of to a few yr-1 (Beuther et al., 2002b; Zhang et al., 2005; Ren et al., 2011; Wang et al., 2011) and outflow momentum rates from to several km s-1 yr-1 (Beuther et al., 2002b; Zhang et al., 2005; Shi et al., 2010; Wang et al., 2011). Intermediate-mass outflows are typically elongated with collimation factors between 1 and 10 (Ridge & Moore, 2001; Wu et al., 2004; Beuther et al., 2002a, 2004), but recent observations in W75N have revealed an apparently very young, spherical outflow (Torrelles et al., 2003; Surcis et al., 2011; Kim et al., 2013).
There are two essentially independent mechanisms that can drive protostellar outflows with the help of magnetic fields. First, the disk material can be accelerated centrifugally and launch a disk wind (e.g. Blandford & Payne, 1982; Pudritz & Norman, 1983; Pelletier & Pudritz, 1992). Or second, the gas in the disk can be lifted by the pressure of the toroidal magnetic field in a magnetic tower flow (e.g. Lynden-Bell, 1996, 2003). Based upon the Lorentz force, these mechanisms are not mutually exclusive and can well act in concert. Seifried et al. (2012b) derived an analytic description able to distinguish both types of driving mechanisms along the outflow region which were also tested with numerical simulations. Additionally, outflows around high-mass stars can be driven by radiation pressure (Krumholz et al., 2009; Kuiper et al., 2012) and ionization feedback (Peters et al., 2010a, 2012; Klaassen et al., 2013a). However, these types of outflows have a very different morphology and kinematics that are on the lower end of observed outflow properties (Peters et al., 2012; Klaassen et al., 2013a).
Three-dimensional magnetohydrodynamic models of protostellar outflows (Seifried et al., 2011, 2012b) show that magnetically-driven outflows can have strongly varying morphologies, ranging from collimated, elongated outflows to almost spherical bubbles. Seifried et al. (2012b) found that collimated outflows are only formed when a nearly Keplerian disk is present. In idealized numerical simulations of protostellar collapse (i.e. simulations without initial turbulence) Keplerian disks build up only in cases of weak magnetic fields (Hennebelle & Teyssier, 2008; Hennebelle & Ciardi, 2009), whereas Keplerian disks naturally arise in simulations that include some initial velocity or density perturbations independent of the magnetic field strength (Seifried et al., 2012a, 2013; Santos-Lima et al., 2012; Myers et al., 2013). The morphologies of the outflows launched from those turbulence-generated disks are not yet studied in detail. It seems likely that that the associated outflows will be launched by magnetic pressure gradients as well as by magneto-centrifugal forces and will take on different shapes depending on the environment and evolutionary state of the underlying disk.
In more massive initial cloud cores, Peters et al. (2011) found that magnetic bubbles can also be produced from common disks around multiple systems by fragmentation-induced outflow disruption. Here, spherical, low-velocity outflows are generated by a large-scale pseudodisk or toroid that forms around the central high-mass star, which then becomes gravitationally unstable and fragments. This fragmentation process destroys any coherent rotation and renders both magnetic launching mechanisms impossible. Hence, as more gas falls onto the disk, the radius at which gravitational instability sets in increases and the outflow stalls inside of this radius. Since the toroid itself grows in radius as well and the outer parts of the disk still rotate coherently, the outflow becomes more spherical in shape. Girart et al. (2013) have recently reported the discovery of such a large-scale spherical tower flow. Fragmentation-induced outflow disruption thus naturally relates to the idea of fragmentation-induced starvation (Peters et al., 2010a, b; Girichidis et al., 2012). Even if individual outflows are launched from the disks around single low- and high-mass protostars (which are not resolved in the simulations by Peters et al., 2010a) within the young multiple system, it might be difficult to observe collimated outflows due to the mutal interaction of those outflows and the influence of the H ii regions around the massive protostars.
In all cases, the outflows found in numerical simulations show a complex internal structure where knots are generated and different instabilities occur. Often prominent are corkscrew and helical structures due to kink instability or outflow precession (e.g. Ouyed et al., 2003; Staff et al., 2010). Although those internal structures are commonly observed in jets from low-mass stars (see e.g., review by Ray et al., 2007), the outflow structure from intermediate- and high-mass stars is more obscure. Yet, the recent observation of an outflow from the young A-type star HD 163296 by Klaassen et al. (2013b) reveals a double sided corkscrew structure that is interpreted as the internal structure of a disk wind launched from around this star. In this present study we confront those observations with numerical simulations.
To avoid the complexities of feedback and fragmentation in high-mass star formation, we here focus on outflows from intermediate-mass stars. We make predictions for how the different outflow morphologies found by Seifried et al. (2012b) would appear to the observer, in particular focusing on the recent observations by Klaassen et al. (2013b). In Section 2, we describe the simulation snapshots that were observed following the procedure outlined in Section 3. We present the results of our analysis in Section 4 and compare our findings with observations in Section 5. We conclude in Section 6.
2 Description of the simulation snapshots
The simulations are performed with the astrophysical code FLASH (Fryxell et al., 2000) using the MHD solver devised by Bouchut et al. (2007). To follow the long-term evolution of the protostellar disks and their associated outflows we make use of sink particles (Federrath et al., 2010). For details of the numerical methods applied we refer to Seifried et al. (2011). Since these simulations to not include radiative feedback, the gas can only heat up through hydrodynamic processes, such as compression and the development of shocks.
In the following we analyse the results of two simulations which differ only in the strength of the initial magnetic field. Both simulations start with a 100 molecular cloud core, 0.25 pc in diameter and rotating rigidly around the -axis with a rotation frequency of s-1. The magnetic field is initially aligned with the rotation axis, i.e. parallel to the -axis. In run 26-4 the magnetic field strength is chosen such that the normalized mass-to-flux ratio is
and the ratio of rotational to gravitational energy is (the run number encodes these two fundamental quantities of the initial conditions). Hence, the core is magnetically supercritical and the magnetic field does not have a strong impact on the collapse of the core. In the second run 5.2-4, the magnetic field strength is increased by a factor of 5 resulting in a mass-to-flux ratio of 5.2. Again, we refer to Seifried et al. (2011) for more details on the initial conditions.
During the collapse of the core in run 26-4, a rotationally supported disk builds up around the first protostar, starting to fragment after 2600 yr. In contrast, in run 5.2-4 a sub-Keplerian disk with strong radial infall motions forms, showing no signs of fragmentation until the end of the simulation. This is a consequence of the efficient removal of angular momentum from the inner parts of the core by magnetic braking (Mouschovias & Paleologou, 1980). On the other hand, for run 26-4 magnetic braking is too weak so that a Keplerian disk can build up.
In both simulations a magneto-centrifugally driven protostellar outflow is launched after the formation of the first sink particle. The outflow in run 26-4 has a well-collimated morphology with a collimation factor of 4 by the end of the simulation. The outflowing gas reaches velocities of up to 20 km s-1, well above the escape speed. In contrast, in run 5.2-4 a poorly collimated, almost spherical outflow with relatively low outflow velocities up to 7 km s-1 is formed. Both outflows keep expanding in a roughly self-similar fashion keeping the overall morphological properties.
While only a single sink particle forms in run 5.2-4, a small cluster develops in run 26-4. The mass spectrum in this cluster is, however, by far dominated by the central sink particle in our snapshots.
We analyse three snapshots in total, two snapshots for run 26-4 (Elon-A and Elon-B) and one snapshot of run 5.2-4 (Spher). The masses of the central sink particles in these snapshots are 2.02 , 2.89 and 2.29 , respectively. Table 1 shows the mass, momentum and kinetic energy of the outflows. The values are determined directly from the simulation data by measuring all the outflowing gas more than 50 AU above and below the midplane. Unlike observational measurements, we do not restrict contributions to the summed values to a certain velocity range along a particular line of sight.
The outflow Elon-A of run 26-4 has an average outflow lobe height of 3200 AU and an age of 5000 yr, but during the first 1500 yr the outflow grows only very slowly. The volume-weighted mean temperature is 60 K (41 K mass-weighted), averaged spatially over the outflow region. These larger values compared to the initial temperature (20 K) are primarily due to compressive motion and shock heating. The maximum outflow speed is 19 km s-1. Note that this maximal velocity is attained close to the disk and that most of the gas in the outflow is a few km s-1 slower.
In snapshot Elon-B of run 26-4, the maximal velocity is only 14 km s-1 because disk fragmentation at 5500–6000 yr reduces the outflow activity. The outflow is now 10000 yr old (or 8500 yr, disregarding the initial slow starting phase) and has an average outflow lobe height of 9600 AU, consistent with a linear extrapolation from the previous snapshot with a typical outflow velocity of 14 km s-1. By comparing the masses and kinematics of Elon-A and the later time Elon-B in Table 1, we find that the momentum and energy of the outflow do not grow by the same factor as the outflow mass. In fact, the outflow energy even decreases slightly for the blue-shifted component. The volume-weighted mean temperature is a bit smaller than before and now has the value 52 K (39 K mass-weighted). All of these effects are results of the disk fragmentation.
Snapshot Spher of run 5.2-4, with an average height of one outflow lobe of 1100 AU, is 4000 yr old. The maximum outflow speed is 6.9 km s-1, less than half the velocity observed in the other simulation. The volume-weighted mean temperature is 33 K (28 K mass-weighted). It is expected that the gas temperature here is lower compared to the other simulations because the smaller outflow velocities compress the gas to a lesser extent. Run 5.2-4 has not been followed for longer times, so that we cannot analyse another snapshot from a later stage.
| () | ( km s-1) | (1043 erg) | () | (yr-1) | ||
|---|---|---|---|---|---|---|
| Elon-A | blue | 0.46 | 1.34 | 6.65 | 0.11 | 0.092 |
| red | 0.38 | 1.02 | 5.48 | 0.09 | 0.076 | |
| Elon-B | blue | 0.76 | 1.59 | 6.12 | 0.05 | 0.076 |
| red | 0.73 | 1.42 | 6.11 | 0.05 | 0.073 | |
| Spher | blue | 0.32 | 0.35 | 0.56 | 0.01 | 0.080 |
| red | 0.33 | 0.37 | 0.61 | 0.01 | 0.083 |
Outflow mass , momentum , kinetic energy , luminosity and mass-loss rate as determined directly from the simulation data.
| () | ( km s-1) | (1043 erg) | () | (yr-1) | ||
|---|---|---|---|---|---|---|
| Elon-A | blue | 0.59 | 2.40 | 11.2 | 0.37 | 0.24 |
| red | 0.45 | 2.16 | 12.3 | 0.41 | 0.18 | |
| Elon-B | blue | 1.69 | 5.31 | 19.5 | 0.32 | 0.34 |
| red | 0.59 | 2.68 | 13.4 | 0.22 | 0.12 | |
| Spher | blue | 0.28 | 0.64 | 1.63 | 0.17 | 0.34 |
| red | 0.11 | 0.32 | 0.95 | 0.10 | 0.14 |
Outflow mass , momentum , kinetic energy , luminosity and mass-loss rate as determined from the synthetic CO observations.
3 Synthetic observations
We use the three-dimensional adaptive-mesh radiative transfer code RADMC-3D111http://www.ita.uni-heidelberg.de/dullemond/software/radmc-3d/ to make synthetic CO line observations. We model the molecular line emission of the transition of the isotopologues 12CO, 13CO and C18O with abundances relative to H2 of , and , respectively (Wilson & Rood, 1994). The critical density of the CO transition is cm-3. Figure 2 and 7 of Seifried et al. (2012b) show that the minimum density in the outflow is more than two orders of magnitude higher than this value. Because of the high density of the outflow material we can assume local thermodynamic equilibrium (LTE). The Einstein coefficients of the transitions were taken from the Leiden Atomic and Molecular Database (Schöier et al., 2005).
The outputs from RADMC-3D were converted into skymaps assuming a distance to source of 128 pc for setting the angular scale and converting the fluxes to Jy beam-1. Noiseless ALMA observations were simulated using the CASA tasks “simobserve” and “simanalyze”. Simulations were carried out in CASA version 4.0.0 (McMullin et al., 2007).
We simulated full ALMA observations of the transition of 12CO, 13CO and C18O with a spatial resolution of 0.680.59′′, or 83 AU. We have chosen this beam size because it is an average value for the full ALMA configurations. The outflows are observed at an inclination of 30∘ with respect to the disk normal direction, which is a representative outflow orientation (Cabrit & Bertout, 1986). The resulting images had spectral resolutions of 390 kHz ( 0.5 km s-1), with the data cubes for the three isotopologues centered at 230.538, 220.399 and 219.560 GHz respectively. The simulated fields of view fit within a single ALMA Band 6 pointing, and we used a total integration time of 4 hours. Cleaning was done non-interactively, using natural weighting, and a threshold of 18 mJy. This limit was chosen to best represent the emission in the maps, as we did not simulate atmospheric noise.
We calculated outflow properties from the 12CO map, after having corrected for the opacity of the line using the less optically thick 13CO and C18O isotopologues. We used Equation 1 of Choi et al. (1993) to derive the optical depth of 12CO using the least abundant isotoplogue (C18O) towards the line center, and 13CO at higher velocities when the C18O emission fell below our threshold of 18 mJy.
To determine the gas mass in each velocity bin, we first calculated the column density from the flux in the given velocity bin scaled by the average line opacity at that velocity,
| (1) |
where is the column density of H2 and is the partition function for converting the column density in the =2 level to the overall level populations assuming LTE and using a temperature of 50 K (a compromise between the temperatures derived above in Section 2), is the integrated intensity of the line (in units of K km s-1), and is the abundance of 12CO with respect to H2. The gas mass in each channel was then derived by multiplying the column density by the size of the emitting region to obtain the total number of H2 molecules. This was then multiplied by the mass of hydrogen, and the mean molecular weight of 2.3. These individual masses were summed for all velocities greater than 2 km s-1, -2.5,+2 km s-1, and 2.0 km s-1 for the three simulations (Elon-A, Elon-B and Spher, respectively) to find the total mass in each outflow lobe. These velocities were chosen based on visual inspection of the processed spectra. The limits were chosen individually for each simulation, and were set where the spectra first appear Gaussian.
To derive the kinematics of the outflows, we multiplied the gas mass in each channel by the velocity of that channel to derive the outflow momentum () and mechanical energies in the outflows (). The outflow luminosities and mass-loss rates were obtained by dividing the mechanical energies and masses, respectively, by the kinematically derived ages of the outflows. Using the spatial extents of the outflows, and the mass-weighted velocities at the end of the outflows, we determined outflow ages of 2400, 5000 and 800 yr for Elon-A, Elon-B and Spher. We note that, especially for Spher, this is an underestimate of the true outflow age as we are looking down the outflow cavity instead of across it in the plane of the sky.
The derived outflow masses and kinematics are presented in Table 2. We note that atmospheric noise is not included in our images. The uncertainty in our simulated observation comes from the uv coverage and integration time only. We find typical errors of the order for , km s-1 for , erg for , for and yr-1 for . These quantities reflect the noise levels in the synthetic observations which have been propogated through in quadrature. We used a beam uncertainty of 0.25′′ and velocity uncertainty of 0.25 km s-1, which represent one third of our spatial and one half of our spectral resolution, respectively. If we were to take atmospheric noise into account, the ALMA Sensitivity Calculator expects we would have a noise level of 6 mJy beam-1, instead of the measured root-mean-square noise level of 1.3 mJy beam-1. When cleaning the data, we used a threshold based on 6 mJy beam-1.
4 Results
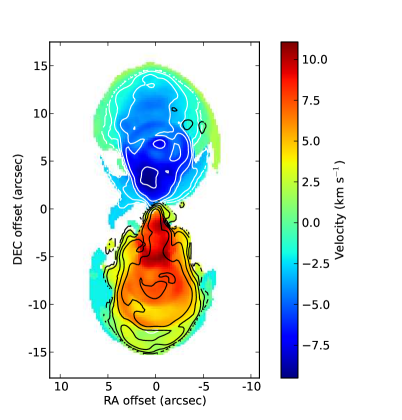
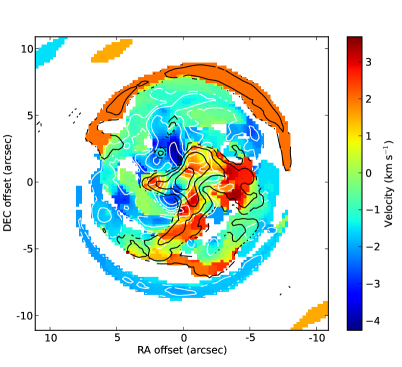
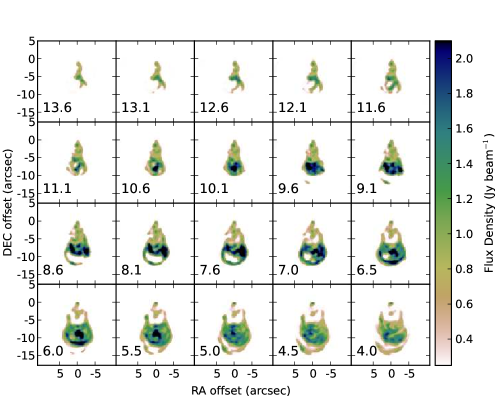
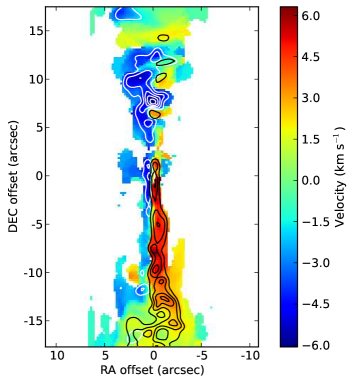
The first moment and channel maps for Elon-A, Elon-B and Spher are shown in Figures 1, 2 and 3, respectively. Figure 1 illustrates that the outflow velocities closer to the star are generally larger. This is because the material at a location near the star was launched at a later time than material further away. At these later times, the star is more massive and the Keplerian velocity greater, increasing the outflow velocity. In general, the velocities in the first moment map well represent the average velocities in the outflow.
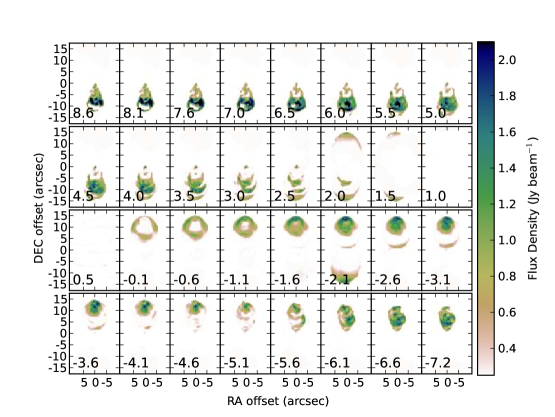
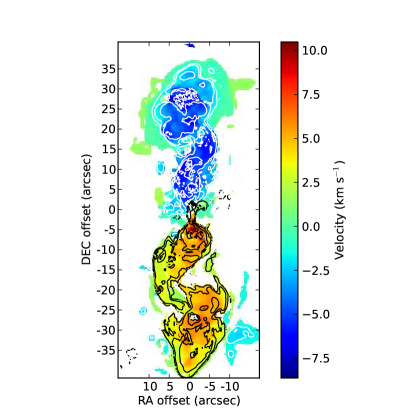
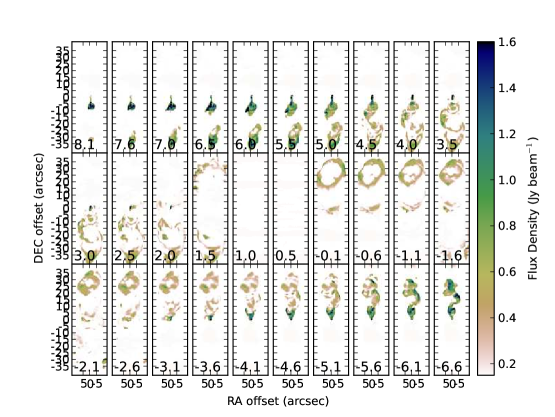
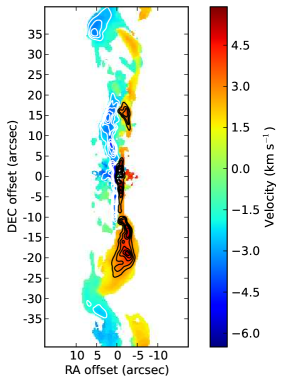
In Figure 2, the outflow of Elon-B is shown at a larger scale than Elon-A. The first moment map displays a very prominent helical structure. This helix is the result of an MHD instability occuring for axisymmetric jets, the so-called kink instability (e.g. Ray, 1981; Appl & Camenzind, 1992). The kink instability describes a helical () displacement of the jet from the symmetry axis without any distortion of the jet profile. The instability is stabilised by the magnetic field of the jet. The development of such a kink (or helical) instability over time was studied numerically by Ouyed et al. (2003) who find a successive growth over time. Here we find that the instability starts to grow significantly only after the time at which snapshot Elon-A is taken, which is why it is seen more prominently in Elon-B. In the maps of Elon-A, there are velocity structures in the individual channel maps which may be hinting at the existence of a tightly wound rotating structure within the outflow (see Figure 4), however it is only at later times (in Elon-B), that the helical structure in the outflow becomes identifiable in the first moment map. The bow shock of the outflow in Elon-B is visible as a low-velocity shell around the tips of the two outflow lobes in Figure 2.
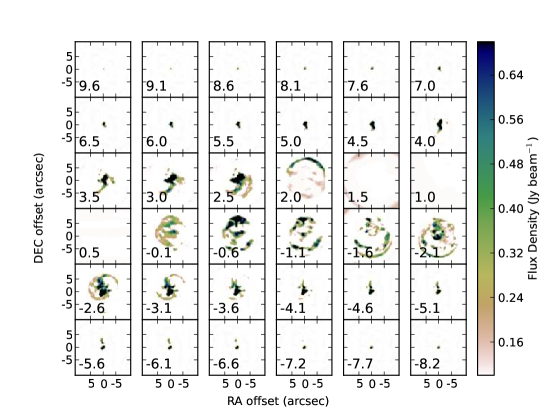
The velocities and flux densities measured from Spher (Figure 3) are much smaller than those obtained from Elon-A and Elon-B. This is not surprising since the velocity component along the line of sight is much smaller for the spherical outflow than for the elongated one. Quantitatively, the outflow velocities in Spher are a factor of a few smaller than the maser spots in W75N (Kim et al., 2013), on the other hand the size of Spher is also larger by a similar factor. Seifried et al. (2012b) speculated that the spherical outflow seen in snapshot Spher might be a transient feature because the outflow velocity is so small that the outflow could fall back onto the disk. With time, a small Keplerian disk around the central star could then build up and make the launching of a collimated outflow possible. If this scenario is true, then spherical outflows around intermediate-size stars of a size much larger than Spher should not be observed. However, an outflow similar to the one in W75N has been observed around a massive star in Cepheus A (Torrelles et al., 2001). A source in HL Tauri that is likely more evolved than the Seifried et al. (2012b) simulations is surrounded by a spherical bubble as well (Welch et al., 2000). These observations might suggest that spherical outflows can occur repeatedly during the disk evolution, and not only in an initial transient phase. Since Figure 3 does not resemble a typical protostellar outflow, we think that it might be useful as a reference for observers in case they find a similarly looking object.
The outflow mass and kinematics derived from the simulated observations (see Table 2) are directly comparable to those derived from the modelled outflows themselves (see Table 1). The values for mass, momentum and energy are mostly within a factor of two of each other. The majority of the directly measured values are smaller than the observed ones. The origin of this behaviour is unclear, and we have seen the opposite trend in previous work (Peters et al., 2012). The luminosity and mass-loss rate are slightly less accurate because the observationally determined outflow ages are generally less than half of the true values measured directly from the simulations. For Elon-A and Elon-B the mass measurements are most consistent, while the measurements of the outflow momentum and energy show larger deviations. For snapshot Spher, the mass and kinematics derived from the simulated observations are most uncertain because of the spherical outflow morphology. Although we have made every attempt to recover all of the flux in the observed maps and thoroughly cover the uv plane, there may be some missing or enhanced structure which is biasing our derived masses and kinematics. Uncertainties also arise in the derivation of the optical depth of the lines which could bias our derivations, which then over- or underestimates the correction factor in Equation (1). We used standard observational methods for deriving the outflow masses and kinematics from the simulated observations. That our results are so strikingly similar to the masses and kinematics derived from the models themselves is a testament to the robustness of the methods used.
5 Comparison with observations
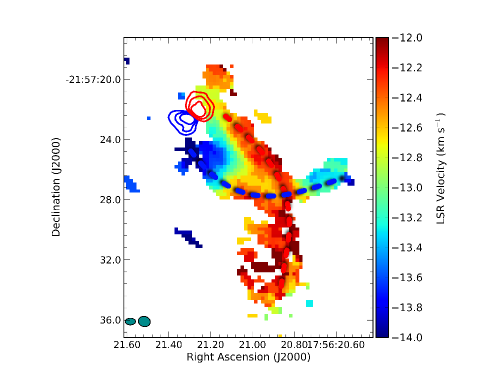
The helical structure in snapshot Elon-B can be compared to recent ALMA observations of a disk wind222Here we use the words “disk wind” and “outflow” synonymously. The former term is used in Klaassen et al. (2013b) because the outflow can be traced unequivocally to the disk from which it is launched. around the Herbig Ae star HD 163296 (Klaassen et al., 2013b). We show the first moment CO map of HD 163296 in Figure 5. For reference, the HCO+ emission from the disk is also shown as blue and red contours. HD 163296 is located at a distance of 122 pc, and therefore the angular scales in Figure 5 are directly comparable to those in Figure 2. One can see that the spatial scale of the observed helically twisted arcs fits very nicely to our model prediction. In fact, the kink of the helix is at the same distance from the central star. The velocities of the HD 163296 wind are, however, much faster than those seen in Elon-B (averaging at 18.6 km s-1 from the source rest velocity). The limits of the observations mean that the large-scale morphology of this wind has yet to be observed, but it is possible that the observed structures in HD 163296 do wind up to a spiral on larger scales. Even though HD 163296 is about 4 Myr old, we compare it to Elon-B (where the protostar is about 10 kyr old) because observations of HD 163296 show for the first time the corkscrew structure that our simulations predict.
If we degrade the resolution and sensitivity in the maps of Elon-B, we would still be able to see velocity gradients within the outflow, such as in Elon-A. Pech et al. (2012) have reported velocity gradients in CO observations of HH 797 with the SMA. They report velocity differences of 2 km s-1 over distances of 1000 AU, which are roughly consistent with the velocity gradient in Elon-A. ALMA, with more than 10 times the linear resolution of the SMA, will likely see more than a velocity gradient in each lobe of HH 797, but the precessing gas itself.
The rotation of the protostellar outflow can be seen at larger inclination angles. Figure 6 and 7 show CO observations of Elon-A and Elon-B, respectively, at an inclination of 80∘. We have chosen a small deviation from 90∘ since observations exactly edge-on are very unlikely. These maps show velocity gradients across the outflow that are clear evidence for outflow rotation. Additionaly, there are velocity gradients along the outflow axis. These secondary gradients are caused by the growth of the Keplerian velocity with time as well as the complex gas motion along the helical structure, exactly the same reasons as for the 30∘ maps. Similar gradients have been found in CO observations of an outflow in CB 26 with the PdBI by Launhardt et al. (2009).
In their study of 16 Class 0 sources, Tobin et al. (2011) found that in addition to the outflow motions from these sources, in more than half of them (11), there were extra velocity gradients more than 45∘ from the outflow direction. They suggested that this was either due to contamination by infall, or due to rotation of the outflowing gas itself. However, our models Elon-A and Elon-B also show significant velocity gradients not aligned with the outflow axis. These gradients are created by the complex dynamics of the outflowing gas and by shocked gas in the outflow, not by infall.
In HD 163296, the outflow can be traced to the disk from which it is launched. There are other recent ALMA observations of protostellar outflows in which this connection has not been made. Zapata et al. (2012) have imaged an outflow around a young massive star in Orion-KL in SiO. Since SiO is a shock tracer and the observations do not have many resolution elements across the outflow, we cannot expect to see a helical structure. Merello et al. (2013) have reported ALMA observations of one of the most energetic and luminous outflows in the Milky Way, G331.512-0.103. This outflow is also not well resolved, and our outflows are certainly much weaker. Arce et al. (2013) have presented ALMA CO observations of the HH 46/47 molecular outflow. This outflow is much smaller in mass, momentum and energy than any of our outflows, and the associated star appears to be a little bit smaller, too. However, there appears to be no evidence for a helical structure in the outflow.
6 Conclusions
We have presented synthetic ALMA observations of intermediate-mass outflows, derived from the self-consistent magnetohydrodynamic protostellar collapse calculations of Seifried et al. (2012b). We find generally good agreement between outflow properties measured from CO lines and the simulation data. Elongated outflows are much easier to detect than spherical outflows because of their larger line-of-sight velocities. However, the dearth of evidence for spherical outflows could also be explained on statistical grounds if they are just transient objects. More observations of spherical outflows and simulations that follow the disk and outflow evolution for a longer period are necessary to settle the question. Edge-on views of the elongated outflows show velocity gradients consistent with observations. We find a helical structure in the CO maps that is caused by an instability during the outflow launching. This helix is already present in the early outflow phases (5000 yr) but becomes very prominent at later times (10000 yr). We speculate that the recent observation of a disk wind in HD 163296 is the first instance of the detection of such a helix, which needs to be backed up by follow-up studies.
Acknowledgements
We thank the anonymous referee for useful comments that helped to improve the paper. T.P. acknowledges financial support through SNF grant 200020_137896 and a Forschungskredit of the University of Zürich, grant no. FK-13-112. D.S. acknowledges funding from the Deutsche Forschungsgemeinschaft DFG via the grant BA 3706/1-3 within the Priority Program SPP 1573 Physics of the Interstellar Medium. R.B. acknowledges funding from the DFG via the grant BA 3706/1-1. R.S.K. acknowledges funding from the DFG via grants KL 1358/14-1 as part of the SPP 1573 as well as via the Collaborative Research Project SBB 811 The Milky Way System in subprojects B1, B2, and B4. The FLASH code was in part developed by the DOE-supported Alliances Center for Astrophysical Thermonuclear Flashes (ASCI) at the University of Chicago.
References
- Appl & Camenzind (1992) Appl, S., & Camenzind, M. 1992, A&A, 256, 354
- Arce et al. (2013) Arce, H. G., Mardones, D., Corder, S. A., et al. 2013, ApJ, 774, 39
- Arce et al. (2007) Arce, H. G., Shepherd, D., Gueth, F., et al. 2007, in Protostars and Planets V, ed. B. Reipurth, D. Jewitt, & K. Keil (Tucson: The University of Arizona Press), 245
- Bachiller (1996) Bachiller, R. 1996, ARA&A, 34, 111
- Bally (2007) Bally, J. 2007, Ap&SS, 311, 15
- Bally (2008) Bally, J. 2008, in Astronomical Society of the Pacific Conference Series, Vol. 387, Massive Star Formation: Observations Confront Theory, ed. H. Beuther, H. Linz, & T. Henning, 158
- Bally et al. (2007) Bally, J., Reipurth, B., & Davis, C. J. 2007, in Protostars and Planets V, ed. B. Reipurth, D. Jewitt, & K. Keil (Tucson: The University of Arizona Press), 215
- Beuther et al. (2004) Beuther, H., Schilke, P., & Gueth, F. 2004, ApJ, 608, 330
- Beuther et al. (2002a) Beuther, H., Schilke, P., Gueth, F., et al. 2002a, A&A, 387, 931
- Beuther et al. (2002b) Beuther, H., Schilke, P., Sridharan, T. K., et al. 2002b, A&A, 383, 892
- Beuther & Shepherd (2005) Beuther, H., & Shepherd, D. 2005, in Cores to Clusters: Star Formation with Next Generation Telescopes, ed. M. S. N. Kumar, M. Tafalla, & P. Caselli (Springer-Verlag), 105
- Blandford & Payne (1982) Blandford, R. D., & Payne, D. G. 1982, MNRAS, 199, 883
- Bouchut et al. (2007) Bouchut, F., Klingenberg, C., & Waagan, K. 2007, Numerische Mathematik, 108, 7
- Cabrit & André (1991) Cabrit, S., & André, P. 1991, ApJ, 379, L25
- Cabrit & Bertout (1986) Cabrit, S., & Bertout, C. 1986, ApJ, 307, 313
- Choi et al. (1993) Choi, M., Evans, II, N. J., & Jaffe, D. T. 1993, ApJ, 417, 624
- Federrath et al. (2010) Federrath, C., Banerjee, R., Clark, P. C., & Klessen, R. S. 2010, ApJ, 713, 269
- Fryxell et al. (2000) Fryxell, B., Olson, K., Ricker, P., et al. 2000, ApJS, 131, 273
- Girart et al. (2013) Girart, J. M., Frau, P., Zhang, Q., et al. 2013, ApJ, 772, 69
- Girichidis et al. (2012) Girichidis, P., Federrath, C., Banerjee, R., & Klessen, R. S. 2012, MNRAS, 420, 613
- Hennebelle & Ciardi (2009) Hennebelle, P., & Ciardi, A. 2009, A&A, 506, L29
- Hennebelle & Teyssier (2008) Hennebelle, P., & Teyssier, R. 2008, A&A, 477, 25
- Kim et al. (2013) Kim, J.-S., Kim, S.-W., Kurayama, T., et al. 2013, ApJ, 767, 86
- Klaassen et al. (2013a) Klaassen, P. D., Galván-Madrid, R., Peters, T., Longmore, S. N., & Maercker, M. 2013a, A&A, 556, A107
- Klaassen et al. (2013b) Klaassen, P. D., Juhasz, A., Mathews, G. S., et al. 2013b, A&A, 555, A73
- Krumholz et al. (2009) Krumholz, M. R., Klein, R. I., McKee, C. F., Offner, S. S. R., & Cunningham, A. J. 2009, Science, 323, 754
- Kuiper et al. (2012) Kuiper, R., Klahr, H., Beuther, H., & Henning, T. 2012, A&A, 537, A122
- Launhardt et al. (2009) Launhardt, R., Pavlyuchenkov, Y., Gueth, F., et al. 2009, A&A, 494, 147
- Lynden-Bell (1996) Lynden-Bell, D. 1996, MNRAS, 279, 389
- Lynden-Bell (2003) —. 2003, MNRAS, 341, 1360
- McMullin et al. (2007) McMullin, J. P., Waters, B., Schiebel, D., Young, W., & Golap, K. 2007, in Astronomical Data Analysis Software and Systems XVI, ed. R. A. Shaw, F. Hill, & D. J. Bell (San Francisco: ASP), 127
- Merello et al. (2013) Merello, M., Bronfman, L., Garay, G., et al. 2013, ApJ, 774, L7
- Mouschovias & Paleologou (1980) Mouschovias, T. C., & Paleologou, E. V. 1980, ApJ, 237, 877
- Myers et al. (2013) Myers, A. T., McKee, C. F., Cunningham, A. J., Klein, R. I., & Krumholz, M. R. 2013, ApJ, 766, 97
- Ouyed et al. (2003) Ouyed, R., Clarke, D. A., & Pudritz, R. E. 2003, ApJ, 582, 292
- Pech et al. (2012) Pech, G., Zapata, L. A., Loinard, L., & Rodríguez, L. F. 2012, ApJ, 751, 78
- Pelletier & Pudritz (1992) Pelletier, G., & Pudritz, R. E. 1992, ApJ, 394, 117
- Peters et al. (2011) Peters, T., Banerjee, R., Klessen, R. S., & Mac Low, M.-M. 2011, ApJ, 729, 72
- Peters et al. (2010a) Peters, T., Banerjee, R., Klessen, R. S., et al. 2010a, ApJ, 711, 1017
- Peters et al. (2012) Peters, T., Klaassen, P. D., Mac Low, M.-M., Klessen, R. S., & Banerjee, R. 2012, ApJ, 760, 91
- Peters et al. (2010b) Peters, T., Klessen, R. S., Mac Low, M.-M., & Banerjee, R. 2010b, ApJ, 725, 134
- Pudritz & Norman (1983) Pudritz, R. E., & Norman, C. A. 1983, ApJ, 274, 677
- Ray et al. (2007) Ray, T., Dougados, C., Bacciotti, F., Eislöffel, J., & Chrysostomou, A. 2007, in Protostars and Planets V, ed. B. Reipurth, D. Jewitt, & K. Keil (Tucson: The University of Arizona Press), 231
- Ray (1981) Ray, T. P. 1981, MNRAS, 196, 195
- Reipurth & Bally (2001) Reipurth, B., & Bally, J. 2001, ARA&A, 39, 403
- Ren et al. (2011) Ren, J. Z., Liu, T., Wu, Y., & Li, L. 2011, MNRAS, 415, L49
- Ridge & Moore (2001) Ridge, N. A., & Moore, T. J. T. 2001, A&A, 378, 495
- Santos-Lima et al. (2012) Santos-Lima, R., de Gouveia Dal Pino, E. M., & Lazarian, A. 2012, ApJ, 747, 21
- Schöier et al. (2005) Schöier, F. L., van der Tak, F. F. S., van Dishoeck, E. F., & Black, J. H. 2005, A&A, 432, 369
- Seifried et al. (2011) Seifried, D., Banerjee, R., Klessen, R. S., Duffin, D., & Pudritz, R. E. 2011, MNRAS, 417, 1054
- Seifried et al. (2012a) Seifried, D., Banerjee, R., Pudritz, R. E., & Klessen, R. S. 2012a, MNRAS, 423, L40
- Seifried et al. (2013) —. 2013, MNRAS, 432, 3320
- Seifried et al. (2012b) Seifried, D., Pudritz, R. E., Banerjee, R., Duffin, D., & Klessen, R. S. 2012b, MNRAS, 422, 347
- Shepherd (2005) Shepherd, D. 2005, in Massive star birth: A crossroads of Astrophysics, ed. R. Cesaroni, M. Felli, E. Churchwell, & M. Walmsley (Cambridge University Press), 237
- Shi et al. (2010) Shi, H., Zhao, J.-H., & Han, J. L. 2010, ApJ, 718, L181
- Staff et al. (2010) Staff, J. E., Niebergal, B. P., Ouyed, R., Pudritz, R. E., & Cai, K. 2010, ApJ, 722, 1325
- Surcis et al. (2011) Surcis, G., Vlemmings, W. H. T., Curiel, S., et al. 2011, A&A, 527, A48
- Tobin et al. (2011) Tobin, J. J., Hartmann, L., Chiang, H.-F., et al. 2011, ApJ, 740, 45
- Torrelles et al. (2001) Torrelles, J. M., Patel, N. A., Gómez, J. F., et al. 2001, Nature, 411, 277
- Torrelles et al. (2003) Torrelles, J. M., Patel, N. A., Anglada, G., et al. 2003, ApJ, 598, L115
- Wang et al. (2011) Wang, Y., Beuther, H., Bik, A., et al. 2011, A&A, 527, A32
- Welch et al. (2000) Welch, W. J., Hartmann, L., Helfer, T., & Briceño, C. 2000, ApJ, 540, 362
- Wilson & Rood (1994) Wilson, T. L., & Rood, R. T. 1994, ARA&A, 32, 191
- Wu et al. (2004) Wu, Y., Wei, Y., Zhao, M., et al. 2004, A&A, 426, 503
- Zapata et al. (2012) Zapata, L. A., Rodríguez, L. F., Schmid-Burgk, J., et al. 2012, ApJ, 754, L17
- Zhang et al. (2005) Zhang, Q., Hunter, T. R., Brand, J., et al. 2005, ApJ, 625, 864