Excitable human dynamics driven by extrinsic events in massive communities
Joachim Mathiesen1,∗, Luiza Angheluta2, Peter T. H. Ahlgren1 and Mogens H. Jensen1
1Niels Bohr Institute, University of Copenhagen, Copenhagen, Denmark
2 Department of Physics, Physics of Geological Processes, University of Oslo, Oslo, Norway
E-mail: mathies@nbi.dk
Abstract
Using empirical data from a social media site (Twitter) and on trading volumes of financial securities, we analyze the correlated human activity in massive social organizations. The activity, typically excited by real-world events and measured by the occurrence rate of international brand names and trading volumes, is characterized by intermittent fluctuations with bursts of high activity separated by quiescent periods. These fluctuations are broadly distributed with an inverse cubic tail and have long-range temporal correlations with a power spectrum. We describe the activity by a stochastic point process and derive the distribution of activity levels from the corresponding stochastic differential equation. The distribution and the corresponding power spectrum are fully consistent with the empirical observations.
Introduction
Online social networks have emphatically changed the way people interact. The development of network theories and growth in available data on human behaviour [1, 2, 3, 4] have prompted an explosive interest in research on the evolution of behaviors [5, 6, 7] and social structures [8, 9]. Among the many forms of online social media, microblogging services, such as Twitter [10, 11, 12], are characterized by a real-time dynamics with large numbers of user broadcasts related to real-world events. Twitter is a popular microblogging platform where a registered user can submit small pieces of information, named “tweets”, that are either private or made public to the user’s followers. The length of a tweet is limited to 140 characters and its content ranges widely from personal updates to massively distributed advertisements or political messages. Twitter has a global outreach and, hence, is used by an increasing number of companies and political organizations to disseminate news. To a large extent, Twitter users can be seen as direct social sensors to measure the popularity of various topics. A large part of recent research on Twitter utilizes user activity as predictor for real world events including the dynamics of stock-market prices [15], box-office revenues [16], real-time detection of the location of earthquakes hitting populated areas [13] and for opinion mining and political sentiment analysis [14]. Large-scale behavioral data from other online media have been shown to have a similar predicting power, e.g. Google query volumes, have been used to detect early signs of stock market moves [17] or more general movements in society [18].
While behavioral data from Twitter have been suggested to predict many real world events or have been used in mapping out social networks, the statistics of the combined user activity are not well understood. Here we suggest a stochastic model for the user activity in massive online communities. Our model sheds light on the statistical properties of the large-scale user activity on Twitter as well as the underlying correlations. Similar to the user activity on Twitter, trading volumes on the stock market reflect the interest that investors have in particular securities or products at given prices. Interestingly, as we will point out below, we find that the trading activity on financial securities is quite similar to the large-scale user activity on Twitter.
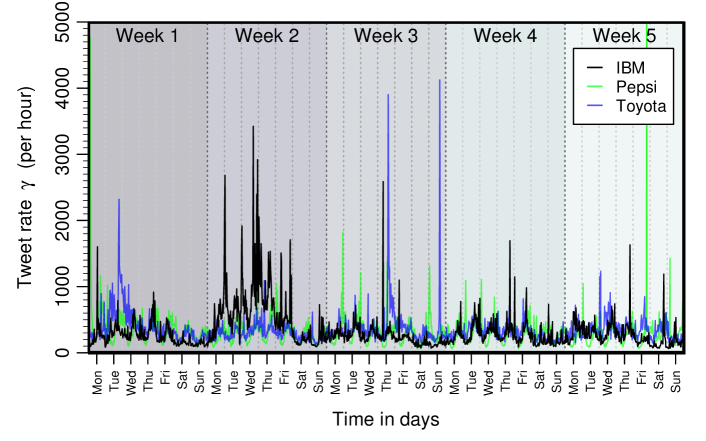
We have automatically queried Twitter for tweets containing one or more international brand names. These tweets appear at highly irregular time intervals, see Fig. 1, reflecting intermittent user activity levels. We consider the broadcasting of tweets to be a random point process with large fluctuations in the time intervals between the online appearances of messages. The number of tweets containing a certain brand, ”A”, as a function of is therefore given by a time signal composed of isolated events occurring at random times , where the index refers to a specific posting event. For each query, a number of the latest tweets is returned. Thus, we determine an average tweet rate for a given query as
| (1) |
where and correspond to the time of the oldest, respectively latest tweet returned by the query . The time interval for a fixed number of tweets is a highly fluctuating variable from one query to another. We notice that the appearance of tweets on Twitter resembles a non-homogeneous Poisson process with random fluctuations in the average tweet rate .
We have further collected data for the trading volume of selected equities over a period similar to that covered by the Twitter data. In particular, we consider the trading volume in the three shares Apple Inc. (AAPL), Nokia Corporation (NOK), and Green Mountain Coffee Roasters Inc. (GMCR). The number of shares traded for each security was accumulated and sampled in one-minute intervals. Changes in trading volume and price are known to be highly leptokurtic [19], have long range correlations [20] and intriguing scaling properties [21, 22]. We consider the volume as a simple proxy for the temporal interest that the market has in a given security disregarding more complex effects that might influence the price formation process.
In the Twitter data, we distinguish two types of user activity, one where users post messages independently of other tweets and one where users interact directly, e.g. by re-posting information from other users in so-called retweets or by submitting responses to existing tweets. In general, a retweet contains text from the original tweet together with a reference to the author who posted it. Retweets typically form a smaller subset of all tweets and the frequency by which individual tweets are retweeted follows a power law with an exponent similar to the out-degree distribution of Twitter users. The out-degree is here measured by the number of followers of a user, i.e. the number of people that receives directly tweets posted by that user. This suggests that the rate of information spread by re-posting goes proportional with the number of followers and is limited by the local network topology. However, since there are only few tweets that generate a large flux of retweets, this may not be the most efficient way to diffuse information between Twitter’s users. There are information pathways that are not only related to the network topology, but, to a larger degree, correspond to many users tweeting at the same time about the same thing triggered by events outside the network.
The intermittent dynamics of individuals has previously been modelled in terms of a timing selection mechanism between different tasks [23]. The prioritization of various tasks is suggested to lead to a bursty dynamics with power-law distributed waiting times. This is in contrast to a homogeneous Poisson process, where the waiting time between tasks that are being selected at random follows an exponential distribution. Here, we propose a global measure of collective human behavior and introduce a stochastic model for the global activity rate associated with many interacting individuals in a large social organization. The activity rate is characterized by long-term memory effects as well as non-exponential distributed waiting times.
Results
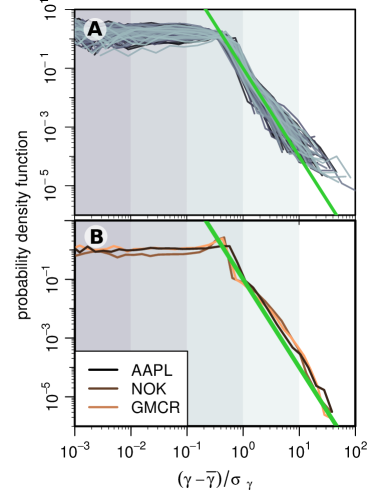
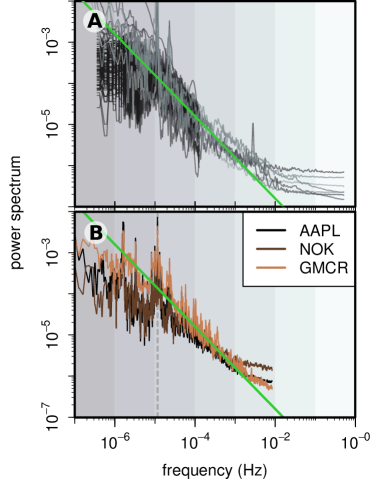
Interestingly, the intermittent tweet rates of specific brands follow a distribution with a power-law tail with an exponent close to an inverse cube, (s.d.), as seen in Fig. 2. For the trading volumes, we achieve values for the exponent , , and . Moreover, the fluctuations in the flux of tweets are long-range correlated with a power spectrum that decays as , where is the frequency and (s.d.), ind an intermediate frequency window corresponding to timescales from 20 minutes to 24 hours as shown in Fig. 3. This means that tweets posted at a given time are influenced with an equal strength by tweets on all time scales ranging back as far as hours. At the same time, high bursts of new tweets, extreme events, occur in the tail of . The -noise is a widespread phenomenon observed in a variety of different systems, including voltage fluctuations [24], heartbeats [25], free-way traffic [26], music [27], trades in financial securities [20], along with many other examples. Although, there is not a unified theory that would apply to all systems exhibiting -noise, there are numerous models that reproduce the -fluctuations in temporal signals with fluctuations drawn from different distributions. On the other hand, there are also plenty of studies that focus on the non-Gaussian, power-law statistics of time signals, , independent of their power spectrum. More recent studies on stochastic point processes investigated the relationship between Pareto-type distributions of the variables and their power spectrum, e.g. [28, 29, 30]. The idea behind a stochastic point process is to model the average waiting time between random, discrete events by a multiplicative noise process. Essentially, the complexity of scale-free distributed variables with a spectral density emerges from the multiplicative noise. Here we present a stochastic point process that captures both the and -noise features. Other models of correlated human behavior [31] predict similarly a power law distribution of the activity rates. However, these models possess a weaker memory effect and do not reproduce the scaling exponent for the power spectrum that we observe.
We assume a scenario where the human activity in the case of no external input is determined by a natural drift towards inactivity. That is the waiting time since the last activity increases with time . On the other hand, excitation by external events drive the system towards higher activity levels. Without correlations in the user activity, the rate is determined by a balance between the drift towards inactivity and repeated excitation. We assume that the correlation in the human dynamics is controlled by a current waiting time between events in the shape of a multiplicative noise with an amplitude given by . The stochastic process for the average waiting time is therefore determined by a stochastic differential equation on the form
| (2) |
where the is Gaussian noise with zero mean and unit variance and the deterministic part is chosen such that the process attains a non-trivial stationary distribution. Collective interactions between users sending messages on Twitter is effectively modeled by the intrinsic, multiplicative noise. The amplitude of the intrinsic noise term is proportional to , which implies that, if the dynamics were solely driven by noise, the waiting time would have an absorbing state, i.e. , corresponding to a tweeting activity that is constant in time and never ceases. The drift term equal to is added to mimic that, if nothing happens, the average waiting time would increase linearly with time as mentioned above. Due to this constant drift term, the absorbing state is never attained, although there are sudden excursions in its neighborhood. The stationary probability distribution function of waiting times, corresponding to Eq. (2) is obtained as the steady-state solution of the Fokker-Plank equation in the Ito formulation and given as
| (3) |
apart from the normalization constant. The divergence at large ’s is suppressed by the cut-off function which depends on . However, at small ’s, corresponding to large tweet rates, , the function is irrelevant since . Thus, in the scaling regime, we can safely ignore . Using that , the stochastic dynamics for follows from Eq. (2) by Ito’s lemma and given as
| (4) |
where we ignore the contributions due to that only determines the range over which is power-law distributed as . The power spectrum of tweet rate fluctuations is determined by the joint distribution associated with the stochastic process in Eq. (4). By the WienerKhintchine theorem the power spectral density of is related to the correlation function as
| (5) |
where the correlation function is defined as
| (6) |
As with other point processes one may assume that the transition distribution has an eigenfunction expansion, and therefore
| (7) |
where the unnormalized probability eigenfunctions satisfy the master equation corresponding to Eq. (1) and are given by
| (8) |
Combining Eqs. (6) and (7), we have that
| (9) |
where is the first moment of the probability eigenfunction. By its Fourier transform as in Eq. (5), the power spectrum can be written as a sum of Lorentzian spectra
| (10) |
The relation between and the eigenvalues follows from the structure of the unnormalized eigenfunction obtained from Eq. (7) and given as , where is the Bessel function of the first kind. Hence, the first moment of it is . The regime is obtained when .
The joint appearance of the -fluctuations distributed with an inverse cubic law for the flux of tweets and volume of trades has interesting implications. Although, there is no consensus on a unique underlying process generating -noise, we associate this kind of fluctuations to complex systems that exhibit an increase in structures and information due to a long-term memory. In general, the collective interactions in relation to trading and tweeting exhibit the characteristics of an emergent phenomena.
Intermittent fluctuations in the rate of tweets on Twitter can happen by two types of information pathways: i) the influx of tweets triggered from the outside world onto Twitter (many independent users tweet about the same thing), ii) cascades of retweets or replies to existing tweets. Since there is a larger influx of new tweets compared to the rate of retweets, we conclude that most of the information spread across the online network happens in a “one-step” cascade when many unrelated people tweet about the same thing.
The activity on Twitter may not be very different from the dynamics of stock trades on financial markets since both are influenced by the social behavior inside massive communities combined with simple rules on the interaction set by e.g. the platform through which the individuals interact. Furthermore, the similarity on large scales indicate a common feature in the complex process underlying the decision-making of users on Twitter and participants in financial markets.
Materials
From the Twitter Application Programming Interface (API), we automatically query for tweets on Twitter containing one or more of 92 preselected international brand names. For each query to Twitter a maximum number of 1500 tweets is returned by the API. Each returned tweet has a time stamp, which can be used to estimate an average tweet rate. The dataset used in this study was created by monitoring the public timeline for a period of four months November 2010 to February 2011, two months January–February 2012 and two months October–November 2012. During these periods, we computed with a sampling rate down to half a minute the tweet rates of selected international brands.
Acknowledgments
This study was supported by the Danish National Research Foundation through the Center for Models of Life. Suggestions and comments by Anders Blok are gratefully acknowledged.
References
- [1] King, G. (2011) Ensuring the data-rich future of the social sciences. Science 331:, 719-721.
- [2] Ginsberg, J., Mohebbi, M. H., Patel, R. S., Brammer, L., Smolinski, M. S., Brilliant, L. (2008). Detecting influenza epidemics using search engine query data. Nature 457:1012-1014.
- [3] Borgatti, S.P., Mehra, A., Brass, D.J., Labianca G. (2009) Network analysis in the Social Sciences. Science 323:892-895.
- [4] Oliveira, J.G., Barabási, A.-L. (2005) Human dynamics: Darwin and Einstein correspondence patterns. Nature 437:1251-1251.
- [5] Buldyrev, S.V., Parshani, R., Paul. G., Stanley, H.E., Havlin, S. (2010) Catastrophic cascade of failures in interdependent networks. Nature 464:1025-1028.
- [6] Rybski, D., Buldyrev, S., Havlin, S., Liljeros, F., Makse, H. (2009) Scaling laws of human interaction activity. Proceedings of the National Academy of Sciences 106:12640-12645.
- [7] Centola, D. (2010) The spread of behavior in an online social network experiment. Science 329:1194-1197.
- [8] Arenas, A., Danon, L., Díaz-Guilera, A., Gleiser, P.M., Guimera R (2004) Community analysis in social networks. Eur. Phys. J. B 38:373-380.
- [9] Blondel, V., Guillaume, J., Lambiotte, R., Lefebvre, E. (2008) Fast unfolding of communities in large networks. J. Stat. Mech.: Theory and Experiment 2008: P10008.
- [10] Kwak, H., Lee, C., Park, H., Moon, S. (2010) What is Twitter, a social network or a news media? Proceedings of the 19th international conference on World Wide Web, pp. 591-600.
- [11] Mandavilli, A. (2011) Peer review: Trial by Twitter. Nature 469:286-287.
- [12] Huberman, B.A., Romero, D.M., Wu, F. (2009) Crowdsourcing, attention and productivity. J. Inform. Sci. 35: 758-765.
- [13] Sakaki, T. and Okazaki, M. and Matsuo, Y. (2010) Earthquake shakes Twitter users: real-time event detection by social sensors, Proceedings of the 19th international conference on World wide webpp. 851–860.
- [14] Tumasjan, A., Sprenger, T. O., Sandner, P. G., Welpe, I. M. (2010). Predicting Elections with Twitter: What 140 Characters Reveal about Political Sentiment. ICWSM, 10, 178-185.
- [15] Bollen, J., Mao, H., Zeng, J. (2011), Twitter mood predicts the stock market, Comp. Sci. 2:1-8
- [16] Asur S., Huberman B. A. (2010), Predicting the Future with Social Media, Web Intelligence and Intelligent Agent Technology (WI-IAT), 2010 IEEE/WIC/ACM International Conference on. Vol. 1. IEEE.
- [17] Preis, T., Moat, H.S., Stanley, H.E. (2013) Quantifying Trading Behavior in Financial Markets Using Google Trends, Sci. Rep. 3:1684, DOI: 10.1038/srep01684.
- [18] Choi, H. and Varian, H. (2012) Predicting the Present with Google Trends. The Economic Record 88:2-9.
- [19] Cont, R. (2001) Empirical properties of asset returns: stylized facts and statistical issues, Quantitative Finance 1: 223-236.
- [20] Bonanno, G. and Lillo, F. and Mantegna, R.N. (2000), Dynamics of the number of trades of financial securities, Physica A: Statistical Mechanics and its Applications280:136-141.
- [21] Mantegna, R.N., Stanley, H.E. (1995) Scaling behaviour in the dynamics of an economic index. Nature 376:46-49.
- [22] Gabaix, X. , Gopikrishnan, P. , Plerou, V. and Stanley, H. E. (2003) A theory of power-law distributions in financial market fluctuations, N͡ature 423:267-270.
- [23] Barabási, A.-L. (2005), The origin of bursts and heavy tails in human dynamics, Nature 435:207-211.
- [24] Voss, R.F. and Clarke, J. (1976), Flicker (1/f) noise: Equilibrium temperature and resistance fluctuations, Physical Review B13:556.
- [25] Kobayashi, M. and Musha, T. (1982), 1/f fluctuation of heartbeat period, Biomedical Engineering, IEEE Transactions on6:456–457.
- [26] Zhang, X. and Hu, G. (1995), ”1/f” noise in a two-lane highway traffic model, Physical Review E52:4664.
- [27] Voss, R.F. and Clarke, J. (1978), ”1/f noise” in music: Music from 1/f noise, The Journal of the Acoustical Society of America63:258.
- [28] Kaulakys, B. and Gontis, V. and Alaburda, M. (2005), Point process model of 1/ f noise vs a sum of Lorentzians, Physical Review E 71:051105..
- [29] Ruseckas, J. and Kaulakys, B. (2010), 1/f noise from nonlinear stochastic differential equations, Physical Review E 81:031105.
- [30] Erland, S. and Greenwood, P.E. and Ward, L.M. (2011), ” noise” is equivalent to an eigenstructure power relation, Europhys. Lett. 95: 60006.
- [31] Karsai, M., Kaski, K., Barabási, A-L, Kertész J (2012) Universal features of correlated bursty behaviour, Sci. Rep. 2:397, DOI: 10.1038/srep00397