A Spatial Simulation Approach to Account for Protein Structure When Identifying Non-Random Somatic Mutations
Abstract
Background: Current research suggests that a small set of “driver” mutations are responsible for tumorigenesis while a larger body of “passenger” mutations occurs in the tumor but does not progress the disease. Due to recent pharmacological successes in treating cancers caused by driver mutations, a variety of of methodologies that attempt to identify such mutations have been developed. Based on the hypothesis that driver mutations tend to cluster in key regions of the protein, the development of cluster identification algorithms has become critical.
Results: We have developed a novel methodology, SpacePAC (Spatial Protein Amino acid Clustering), that identifies mutational clustering by considering the protein tertiary structure directly in 3D space. By combining the mutational data in the Catalogue of Somatic Mutations in Cancer (COSMIC) and the spatial information in the Protein Data Bank (PDB), SpacePAC is able to identify novel mutation clusters in many proteins such as FGFR3 and CHRM2. In addition, SpacePAC is better able to localize the most significant mutational hotspots as demonstrated in the cases of BRAF and ALK. The R package is available on Bioconductor at: http://www.bioconductor.org/packages/release/bioc/html/SpacePAC.html.
Conclusion: SpacePAC adds a valuable tool to the identification of mutational clusters while considering protein tertiary structure.
1 Background
Cancer, at its most basic, is caused by the accrual of somatic mutations within oncogenes and tumor suppressors in the genome (Vogelstein and Kinzler, 2004). While mutations within tumor suppressors usually lower or completely disrupt the activity of genes that promote cell apoptosis or regulate the cell cycle, oncogenic mutations typically increase or destabilize the resulting protein output. As it is easier to disrupt protein function than restore it, there has been significant pharmacological research geared towards inhibiting oncogenic mutations as described in Faivre et al. (2006); Hartmann et al. (2009) and Moreau et al. (2012). Coupled with the idea of “oncogene addiction”, that a small set of “driver” genes promote uncontrolled cellular growth in a wide variety of cancers and that inactivation of these genes can significantly impair tumorigenesis (Greenman et al., 2007; Weinstein and Joe, 2006), the identification of driver oncogenic mutations has become of key importance due to its potential translational benefit.
Due to the biological importance of this problem, a variety of methodologies have been proposed to identify regions where activating mutations may occur. One approach is based on the idea that compared to the background mutation rate, driver mutations will have a higher frequency of non-synonymous mutations (Sjöblom et al., 2006; Bardelli et al., 2003). Several improvements to this approach have been made such as normalizing for gene length (Wang, 2002) as well as accounting for different mutation rates due to features such as transitions versus transversions, location of CpG sites and tumor type (Youn and Simon, 2010). Relatedly, instead of comparing the mutational frequency directly to the background rate, one can also compare the ratio of nonsynonymous () to synonymous () mutations per site (Kreitman, 2000). Recently, Bardelli et al. (2003); Lynch et al. (2004); Greenman et al. (2007) and Torkamani and Schork (2008) showed that somatic mutations appear to cluster within protein kinases while Wagner (2007) and Zhou et al. (2008) demonstrated that mutational clustering can be a sign of positive selection for protein function and thus sites for protein engineering.
Alternatively, several machine learning methods have been developed to determine the nature of a specific mutation. For instance, Polyphen-2 (Adzhubei et al., 2010) attempts to discern whether a mutation is deleterious while CHASM (Carter et al., 2009) attempts to distinguish between driver and passenger mutations. These methods use a wide range of sequence and non-sequence features to build a set of rules that are then used to score each mutation with the score value determining the mutation classification. The rules are developed on a training data set via a variety of methods such as Random Forests (Breiman, 2001), Bayesian Networks (Friedman et al., 1997) and Support Vector Machines (Cortes and Vapnik, 1995). The features used often include information on the size and polarity of the substituted and original residues, available structural information as well as evolutionary conservation (Reva et al., 2011). Some classifiers are optimized to use only a small set of features in prediction. For example, the SIFT classifier (Ng and Henikoff, 2001), only uses evolutionary conservation to predict whether the protein functional change is tolerated or damaging.
While all these methods have shown some success in identifying damaging or deleterious mutations, they nevertheless have limitations. Methods that rely upon differentiating the frequency of synonymous and non-synonymous mutations as compared to the background rate may fail to take into account that selection may occur upon only a small region of the gene and that signal loss may occur when the gene is considered in total. The methodologies proposed by Wang (2002) and Kreitman (2000) fail to distinguish between activating and non-activating non-synonymous mutations while the method developed by Youn and Simon (2010) may be biased if the background mutational rate is not accurately estimated. Furthermore, not only do machine learning classifiers require several sources of information that need to be periodically updated to account for new research, it is often the case that much of the requisite information needs to be collected for the first time at significant expense.
Building upon the hypothesis that driver mutations tend to cluster in functionally relevant protein regions, Ye et al. (2010); Ryslik et al. (2013a) and Ryslik et al. (2013b) recently developed several statistical methodologies to identify mutational clusters. Specifically, Ye et al. (2010) developed Non-Random Mutational Clustering (NMC) which identifies mutational clusters by testing against the null hypothesis that missense substitutions follow a uniform distribution. iPAC (Ryslik et al., 2013a) and GraphPAC (Ryslik et al., 2013b) expanded upon NMC by taking into account protein tertiary structure via a MultiDimensional Scaling approach (MDS) (Borg and Groenen, 1997) and a graph theoretical approach, respectively. While both of these methods improved over the linear NMC method, they nevertheless remap the protein to one dimensional space resulting in information loss.
In this article, we provide an improvement to iPAC, GraphPAC and NMC by considering the protein directly in three dimensional space and thereby avoid the information loss inherent in dimension reduction algorithms. Using this new approach, we identify the most number of proteins with significant clusters at the same false discovery rate, including proteins, such as FGFR3 and CHRM2, whose clusters are missed by iPAC, GraphPAC and NMC (see Section 3.1). In addition, SpacePAC provides better “localization” for mutational hotspots (see Section 3.2). Finally, we show that many of the mutational hotspots identified by SpacePAC are categorized as activating mutations by CHASM and damaging mutations by PolyPhen-2. Overall, by avoiding the protein remapping step required by iPAC and GraphPAC as well as the multiple comparison penalty these methods incur for looking at every pairwise combination of mutations, we are better able to identify mutational hotspots that are indicative of driver mutations. For the rest of this paper, we refer to the set of NMC, GraphPAC, and iPAC as the “pairwise methods” as they consider every pairwise combination at the cost of an extra multiple comparison adjustment.
2 Methods
SpacePAC uses a three step process to identify mutational clusters. Step one is to obtain the mutational and structural data (see Sections 2.1 and 2.2). Step two is to reconcile the databases so that the mutational information can be mapped onto the protein structure (see Section 2.3). The third step is to simulate the distribution of mutation locations over the protein tertiary structure and identify if any regions of the protein have observed mutational counts in the tail of the distribution (see Section 2.4). Finally, although not part of the SpacePAC algorithm, we perform a multiple comparison adjustment to account for the multiple structures considered (see Section 2.6).
2.1 Obtaining Mutational Data
The 65th version of the COSMIC SQL database, the latest version as of when this paper was written, was used to obtain the mutation data. First, only missense substitution mutations recorded as “confirmed somatic variant” or “Reported in another cancer sample as somatic” were used. Further as both SpacePAC and the pairwise methods are tested against the null hypothesis that mutations are randomly distributed along the protein, only mutations from whole gene or whole genome screens were retained in order to avoid selection bias. Next, only genes labeled with a Uniprot Accession Number (Consortium, 2011) were kept as the Uniprot identification was used to match the protein sequence to the protein structure. Finally, as several studies may report mutational data from a single cell line, mutation duplications were removed in order to avoid over counting specific mutations (see “COSMIC Query” in the supplementary materials for the SQL code).
2.2 Obtaining 3D Structural Data
Protein structures were obtained from the PDB. The spatial coordinates of the -carbon atom in each amino acid were used to represent that amino acid’s location in 3D space. Further, as multiple structures are often available for the same protein, all structures that matched the protein’s UniProt Accession Number were analyzed and an appropriate multiple comparison adjustment applied afterwards (see Section 2.6). If multiple polypeptide chains within the same structure matched the Uniprot Accession Number, the first matching chain shown in the file was used (commonly chain “A”). Similarly, if the structure resolution provided more than one protein conformation, the first conformation listed in the pdb file was kept. For a full listing of the 1,903 structure/side-chain combinations considered, see “Structure Files” in the supplementary materials.
2.3 Reconciling Structural and Mutational Data
As the residue numbering scheme often differs between the COSMIC and PDB databases, we reconciled the information in both sources. Similar to iPAC and GraphPAC, SpacePAC provides the user two possible reconciliation options. The first option is based upon a numerical reconstruction from the structural data available directly in the PDB file while the second performs a pairwise alignment as detailed in Pages et al. (2012). As the PDB file structure may change depending upon when the file was added to the database along with other technical difficulties, we used pairwise alignment to reconcile the mutational and positional information for each structure unless specifically noted. For further information on the pairwise alignmnent, please see the iPAC package available on Bioconductor. Successful alignment was obtained for 131 proteins corresponding to 1,110 individual structure/side-chain combinations. Note that structures that did not have tertiary data on at least two mutations were considered blank (as no clustering is possible) and dropped from the analysis. See “Structure Files” in the supplementary materials for full details of each combination.
2.4 Identifying Mutational Hotspots
The general principle for SpacePAC is that we identify the one, two and three non-overlapping spheres that cover as many of the mutations as possible at various radii lengths. We then normalize the number of mutations covered by the spheres and find the maximum normalized value. This value is then compared to a simulated distribution to obtain a p-value. Specifically, we proceed as follows:
-
•
Let s be the number of spheres we consider. .
-
•
Let r be the radius considered. Here we consider, .
-
•
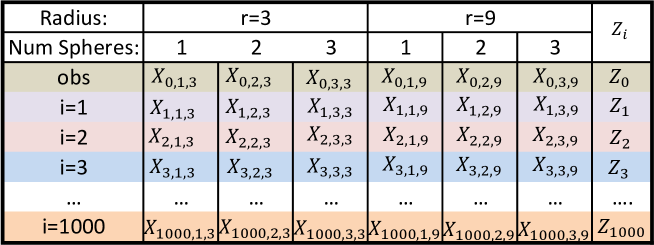
Simulate distributions of mutation locations over the protein structure. For each simulation, the mutations are randomly permuted among all the amino acids.
Next, let represent the number of mutations captured by the spheres. If , we identify the sphere centers, , in such a way such that the spheres capture as many of the total mutations as possible (See Section 2.5). Let represent the same statistic but for simulation . For given , calculate and . For each simulation, calculate . The p-value is then estimated as: . Note that while we identify up to three spheres (or “hotspots”) that contain mutational clustering, only one p-value is necessary to reflect the statistical significance of all the hotspots. This process is best seen through Figure 1. For the rest of this paper, we will refer to “hotspot” and “cluster” interchangeably.
2.5 Algorithm for identifying sphere positions
In the approach described in Section 2.4, we find the 1, 2 and 3 non-overlapping spheres that cover the most mutations given a pre-specified radius length. Ignoring sphere overlap for the moment, if only one sphere is considered, the number of possible spheres is linear in the length of the protein (namely, a sphere centered at each residue). If two spheres are considered, there are possible sphere combinations if the protein is residues long. Similarly, if three spheres are considered, there are such combinations (once again ignoring sphere overlap). For a medium-sized protein like PIK3C which is 1,068 residues long, considering three spheres allows for possible positions. This makes it prohibitively expensive to perform a brute force approach. To quickly find the best sphere orientation, we execute Algorithm 1 below. Algorithm 1 is presented for 2 spheres but is trivially extendable to 3 or more spheres as well.
To help illustrate this algorithm, consider a protein residues long with five mutated amino acid positions and suppose that we are interested in finding the two spheres that capture the most mutations. Without loss of generality and for ease of exposition, number the mutated residues 1 through 5. Further, assign the following mutation counts to these residues: residue 1 - 50 mutations, residue 2 - 40 mutations, residue 3 - 30 mutations, residue 4 - 20 mutations and residue 5 - 10 mutations. For clarity, we assume that the mutation counts are unique, but the algorithm is unaffected if there are identical mutation counts for some residues. We first construct the table shown in Figure 2, where the inside of the matrix is calculated to be the sum of the number of mutations at amino acid i and amino acid j. Observing, that the table is symmetric, we only need to evaluate the residues below the diagonal as the entries on the diagonal originate from residues that overlap each other perfectly. Thus for entry we are considering two spheres, one centered at residue and one centered at residue .
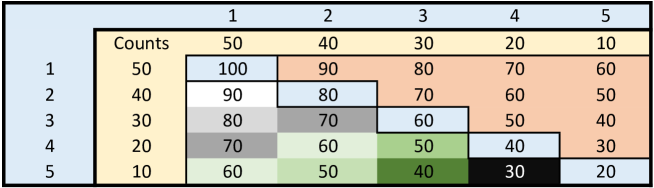
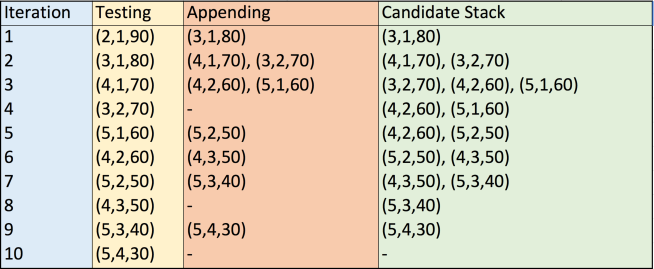
The algorithm proceeds by appending to the “candidate” stack the element directly below and the element directly to the right starting from the (2,1) entry. An “element” consists of a 3-tuple where represents the row, represents the column and represents the value in position . After every two potential appends to the stack, the maximum value over the 3rd position is found (with the third position corresponding to the number of mutations covered by both spheres). The two spheres that contribute to this max element are then checked for overlap. If the spheres do not overlap, then a successful case has been found and the algorithm completes. If the spheres do overlap, the next set of elements are appended and the process continues. By proceeding in the way described in Algorithm 1, at each iteration, the pair of spheres being considered contain the maximum number of mutations possible from the remaining set of sphere combinations. Hence, once the first pair of non-overlapping spheres is found, the optimal sphere combination has been found and the algorithm can terminate. To see this process, see Figure 3.
2.6 Multiple Comparison Adjustment For Structures
A multiple comparison adjustment was performed to account for testing 1,110 protein structures. Since many structures may pertain to one protein, a Bonferroni adjustment is too conservative and an FDR approach was used. Specifically, a rough FDR (rFDR) (Gong et al., 2009) approach, which is a good approximation to the standard FDR approach (Benjamini and Hochberg, 1995) when there are a large number of positively correlated or independent tests, was applied. In our case, the cutoff is set at:
where , the total number of structures in the study. Using an , the . To be conservative, we rounded down and deemed all clusters with a p-value less than or equal to to be significant.
3 Results and discussion
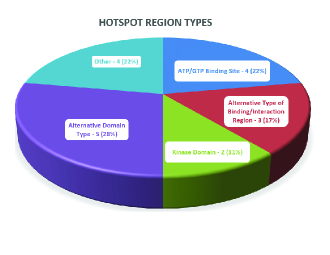
Of the 131 proteins considered, SpacePAC identified 18 proteins with significant clustering as shown in Table 1. For a full list of which structures were found significant under SpacePAC, GraphPAC and NMC, see “Results Summary” in the Supplementary materials. We note that while Table 1 shows the p-values for the 18 proteins found significant by SpacePAC, there were 5 proteins that were found significant only by GraphPAC, 1 protein only by iPAC and 1 protein only by NMC (see “Results Table” in the supplementary materials for a complete list of what proteins were identified significant under each method). However, we also note that SpacePAC identified the largest number of proteins with significant clustering at the same false positive threshold111The GraphPAC algorithm was run using each of the three insertion methods described in (Ryslik et al., 2013b). While the methodology is the same, the nature of the algorithm leads to different results when different insertion methods are considered. SpacePAC outperformed GraphPAC in comparison to each of the individual insertion methods.. We further note that several of the proteins identified only by SpacePAC have already been associated with cancer as shown in Section 3.1. Furthermore, as shown in Figure 4, 14 out of the 18 proteins identified by SpacePAC have their most significant hotspot overlap a biologically relevant region and three of the remaining four proteins (CTNNB1, FGFR3 and FSHR) have been implicated with cancer.
| Method | ||||
|---|---|---|---|---|
| Gene | SpacePAC | iPAC | GraphPAC | NMC |
| AKT1 | 1.00 E-03 | 4.48 E-04 | 5.54 E-04 | 5.55 E-04 |
| ALK | 1.00 E-03 | 1.99 E-42 | 3.89 E-35 | 2.16 E-21 |
| BRAF | 1.00 E-03 | 2.23 E-308 | 2.23 E-308 | 2.23 E-308 |
| CHRM2 | 1.10 E-02 | |||
| CTNNB1 | 2.00 E-03 | 6.69 E-03 | 1.09 E-03 | 1.09 E-03 |
| DOCK2 | 2.20 E-02 | 9.29 E-03 | 3.39 E-03 | |
| FGFR3 | 2.00 E-02 | |||
| FSHR | 2.20 E-02 | |||
| HRAS | 1.00 E-3 | 1.55 E-23 | 1.87 E-32 | 2.68 E-15 |
| IDE | 2.00 E-02 | 3.60 E-03 | ||
| IGF2R | 1.40 E-02 | 3.06 E-03 | 9.04 E-03 | |
| KIF18A | 6.00 E-03 | 1.56 E-02 | 1.56 E-02 | 1.56 E-02 |
| KRAS | 1.00 E-03 | 2.23 E-308 | 2.23 E-308 | 2.23 E-308 |
| NRAS | 1.00 E-03 | 1.53 E-75 | 6.65 E-77 | 6.77 E-77 |
| PIK3CA | 1.00 E-03 | 4.73 E-118 | 4.73 E-118 | 4.73 E-118 |
| PTEN | 1.00 E-03 | 5.71 E-03 | 7.60 E-04 | 1.68 E-04 |
| SEC23A | 1.70 E-02 | 1.18 E-02 | ||
| TP53 | 1.00 E-3 | 1.78 E-134 | 6.22 E-169 | 1.08 E-88 |
Specifically, for CTNNB1, the SpacePAC identified hotspot covers mutations G34R and G34V, which are associated with hepatocellular carcinoma and hepatoblastoma (Legoix et al., 1999; Koch et al., 1999), respectively. Further, FSHR has been shown to be expressed in the vascular endothelial tissue of a wide range of human tumors including lung, breast, prostate, colon and leiomyosarcoma (Siraj et al., 2013). For more detail on FGFR3, see Section 3.1.
Finally, we evaluated SpacePAC performance via two common machine learning methods, PolyPhen-2 (Adzhubei et al., 2010) and CHASM (Carter et al., 2009). Before we summarize the results, we note that PolyPhen-2 and CHASM utilize a large set of features when evaluating each mutation. The advantage of SpacePAC is that it is able to be run with vastly less a priori information. Out of the 38 mutated amino acids that fall within SpacePAC identified hotspots, PolyPhen-2 identifies 36 (95%) as damaging while CHASM identifies 31 (82%) as driver mutations at a FDR of 20%. On the protein level, PolyPhen-2 identifies all the 18 proteins identified by SpacePAC as significant while CHASM identifies 14 proteins as significant. Moreover, SpacePAC identifies several proteins with significant clustering that are missed by the machine learning methods. For instance, SpacePAC identifies FSHR as significant, which, as described above, has recently been associated with cancer. However, CHASM calculates a FDR of 0.45 for FSHR, which is above the significance threshold. See “Performance Evaluation” in the supplementary materials for more information.
3.1 SpacePAC finds novel proteins
As described in Section 3, SpacePAC identified three novel proteins that were missed by NMC, iPAC and GraphPAC. We will now consider two of these proteins, Fibroblast Growth Factor Receptor 3 (FGFR3), and Muscarinic Acetylcholine Receptor M2 (CHRM2 or M2).
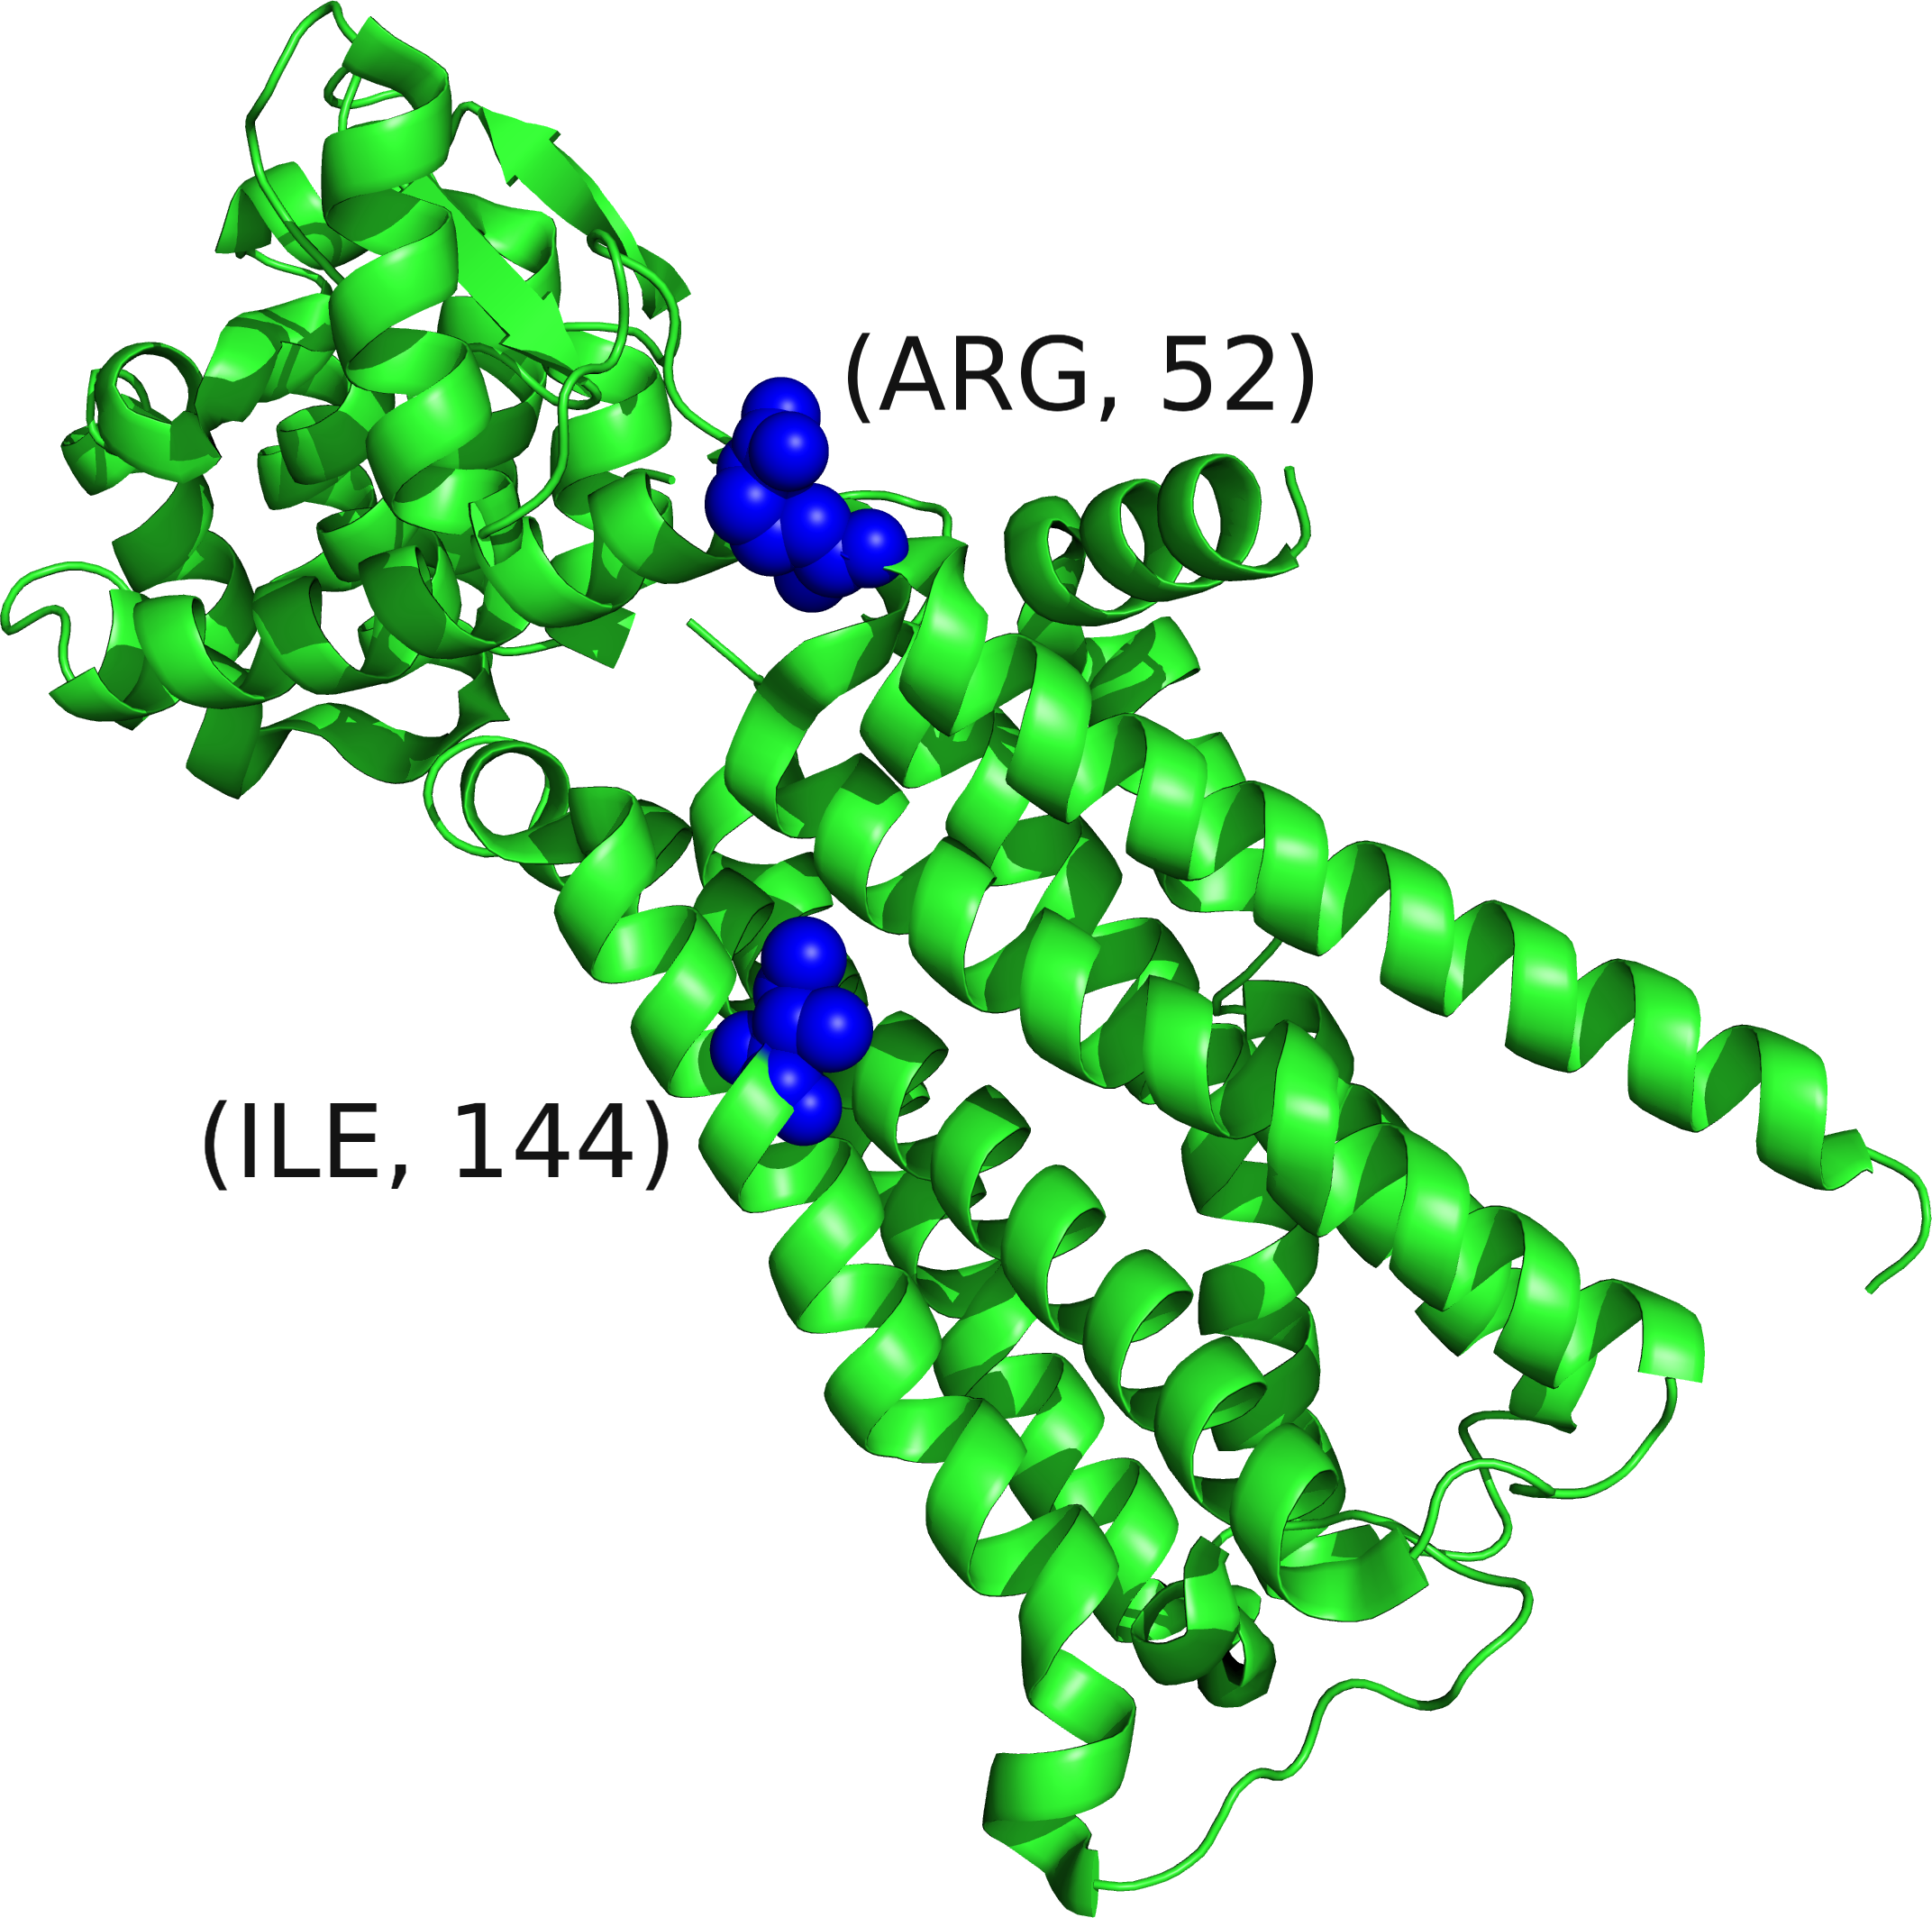
The CHRM2 structure (PDB ID: 3UON) (Haga et al., 2012) was identified by SpacePAC as having two significant mutational hotspots (p-value = ) located at residues 52 and 144 (see Figure 5). CHRM2, essential for the physiological regulation of cardiovascular function (Haga et al., 2012) has been implicated in a variety of cardiovascular diseases. Recently, CHRM2 has also been associated with both autoimmune diseases and cancer (Ockenga et al., 2013). Current research shows that M2 receptors are expressed in both glioblastoma cell lines and human samples. Moreover, the M2 agonist arecaidine strongly decreases cell proliferation in both primary cultures and cell lines in a dose and time dependent response profile. This suggests that M2 activation has an important role in suppressing glioma cell proliferation and can provide a novel therapeutic target (Ferretti et al., 2013). Had the spatial structure not been taken into account, as under NMC, or if the structure was accounted for but only via remapping to 1D space, as under iPAC and GraphPAC, this cluster would have been missed.
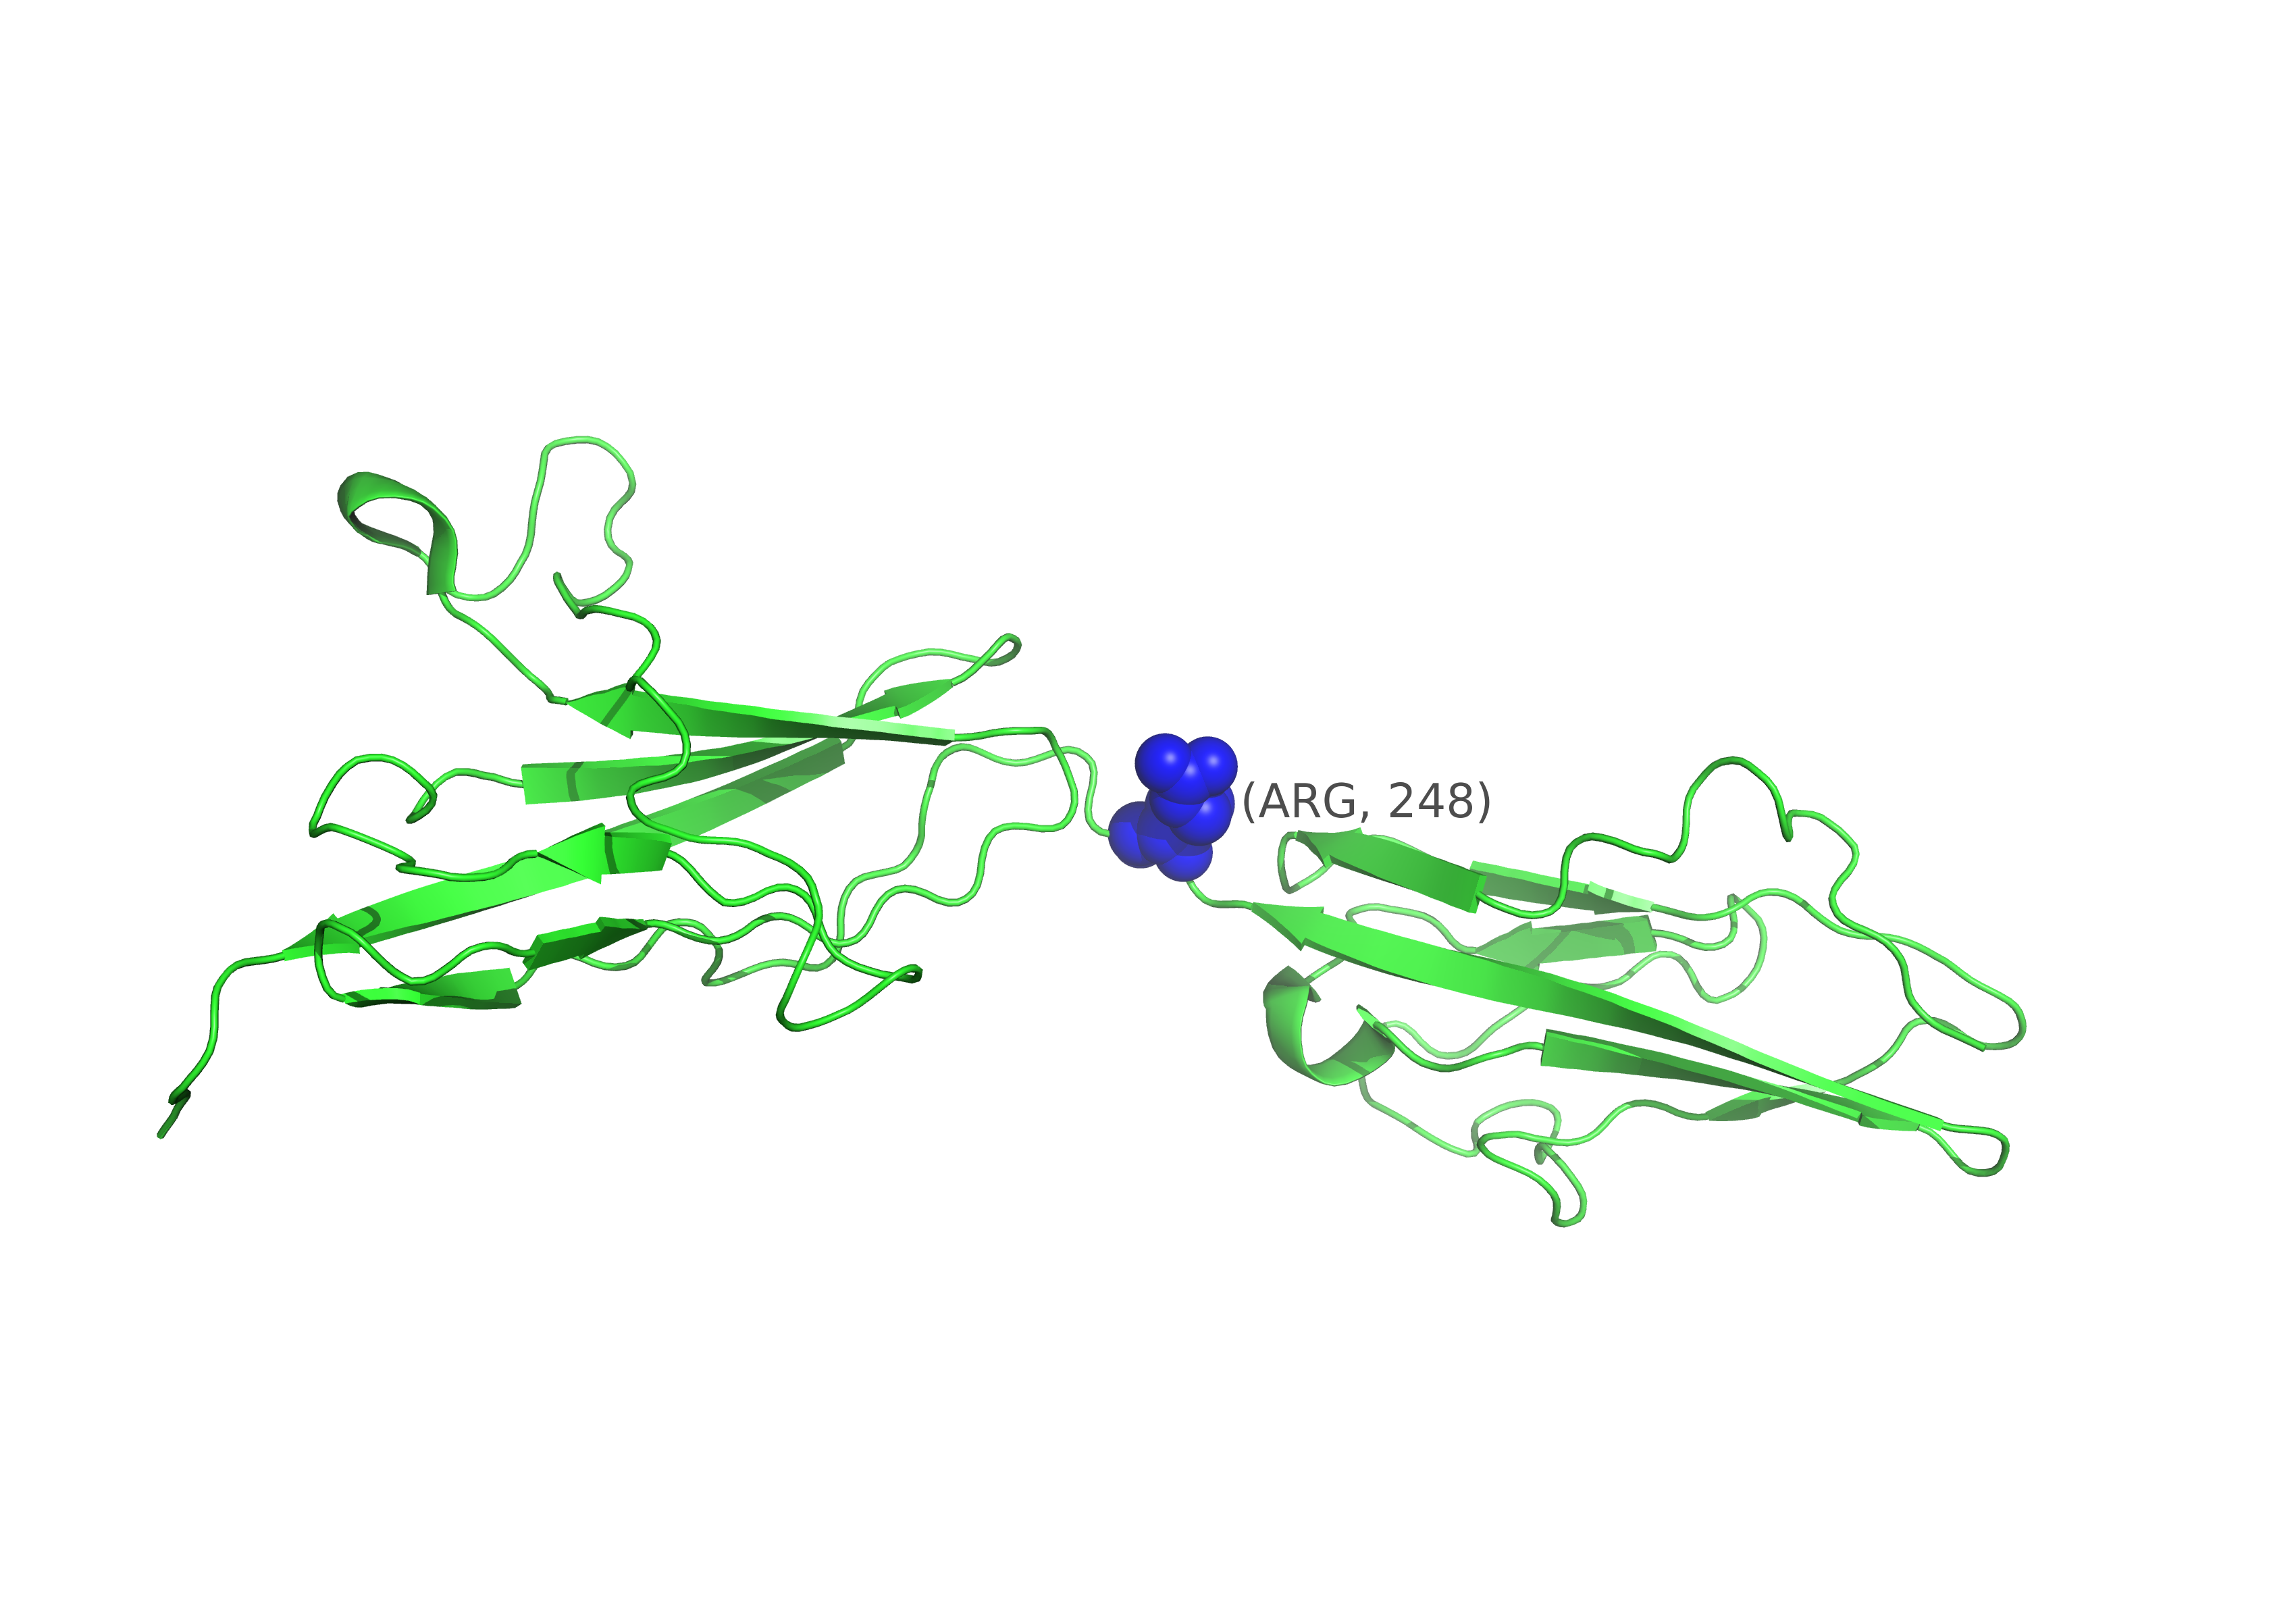
SpacePAC identified the FGFR3 structure (PDB ID: 1RY7) (Olsen, 2004) as having one significant hotspot (p-value ) centered at amino acid 248 (see Figure 6). FGFR3 is a tyrosine-protein kinase which plays a critical role in regulating cell differentiation, proliferation and apoptosis and is often associated with cancer and developmental disorders (Hart et al., 2001). Mutation R248C occurs in the Ig-like domain and is a severe and lethal mutation associated with bladder cancer (Hadari and Schlessinger, 2009) along with a variety of other phenotypes such as thanatophoric dwarfism (Rousseau, 1996) and epidermal nevi (Hafner, 2006). This cluster represents a perfect example of signal loss when all pairwise mutations are considered. In the case of our data, as all the mutations occur on one residue, a cluster is formed at that one residue only. There is therefore no difference between any of the pairwise methods as the remapping step has no effect. However, since iPAC, GraphPAC and NMC need to account for all pairwise comparisons between mutations (all occurring on residue 248), the signal is lost under all three methods. On the other hand, as SpacePAC does not need to perform such a correction, it is successfully able to detect the cluster. Moreover, we note that Qing et al. (2009) recently developed an anti-FGFR3 monoclonal antibody that interferes with FGFR3 binding and inhibits R248C (Hadari and Schlessinger, 2009).
3.2 SpacePAC improves cluster localization
For protein-structure combinations in which mutational clusters are detected by other methods, SpacePAC is often able to provide a smaller set of clusters compared to the pairwise methods while still covering the majority of mutations. To illustrate this point we consider two examples, the BRAF structure (PDB ID: 3Q96) (Gould et al., 2011) where SpacePAC identifies 3 mutational hotspots and the ALK structure (PDB ID: 2XBA) (Bossi et al., 2010) where SpacePAC identifies 2 mutational hotspots.
BRAF is a well known oncogene that is part of the RAS-RAF-MEK-ERK-MAP kinase pathway which is often activated in human tumors. Further, it is estimated that approximately 90% of mutations in this gene are a substitution of a glutamate for a valine at residue 600 (V600E) (Tan et al., 2008). In our mtuational data, 187 (83.5%) mutations were on residue 600 with the remaining 37 mutations spread over 13 other residues. Mutations on V600 typically result in constitutively elevated kinase activity and have been found in a wide range of cancers such as metastatic melanoma, ovarian carcinoma and colorectal carcinoma (Davies et al., 2002; Rajagopalan et al., 2002; Hingorani et al., 2003; Sjöblom et al., 2006; Greenman et al., 2007; Andreu-Pérez et al., 2011). Due to the large number of V600 mutations, SpacePAC and all the pairwise methods identified residue 600 as the most significant “cluster” in all structures where tertiary information was available on that residue. It is worth noting that BRAF V600 inhibitors, such as Vemurafenib, have already been developed, further supporting the hypothesis that mutational clusters may represent pharmaceutical targets (Mao et al., 2012).
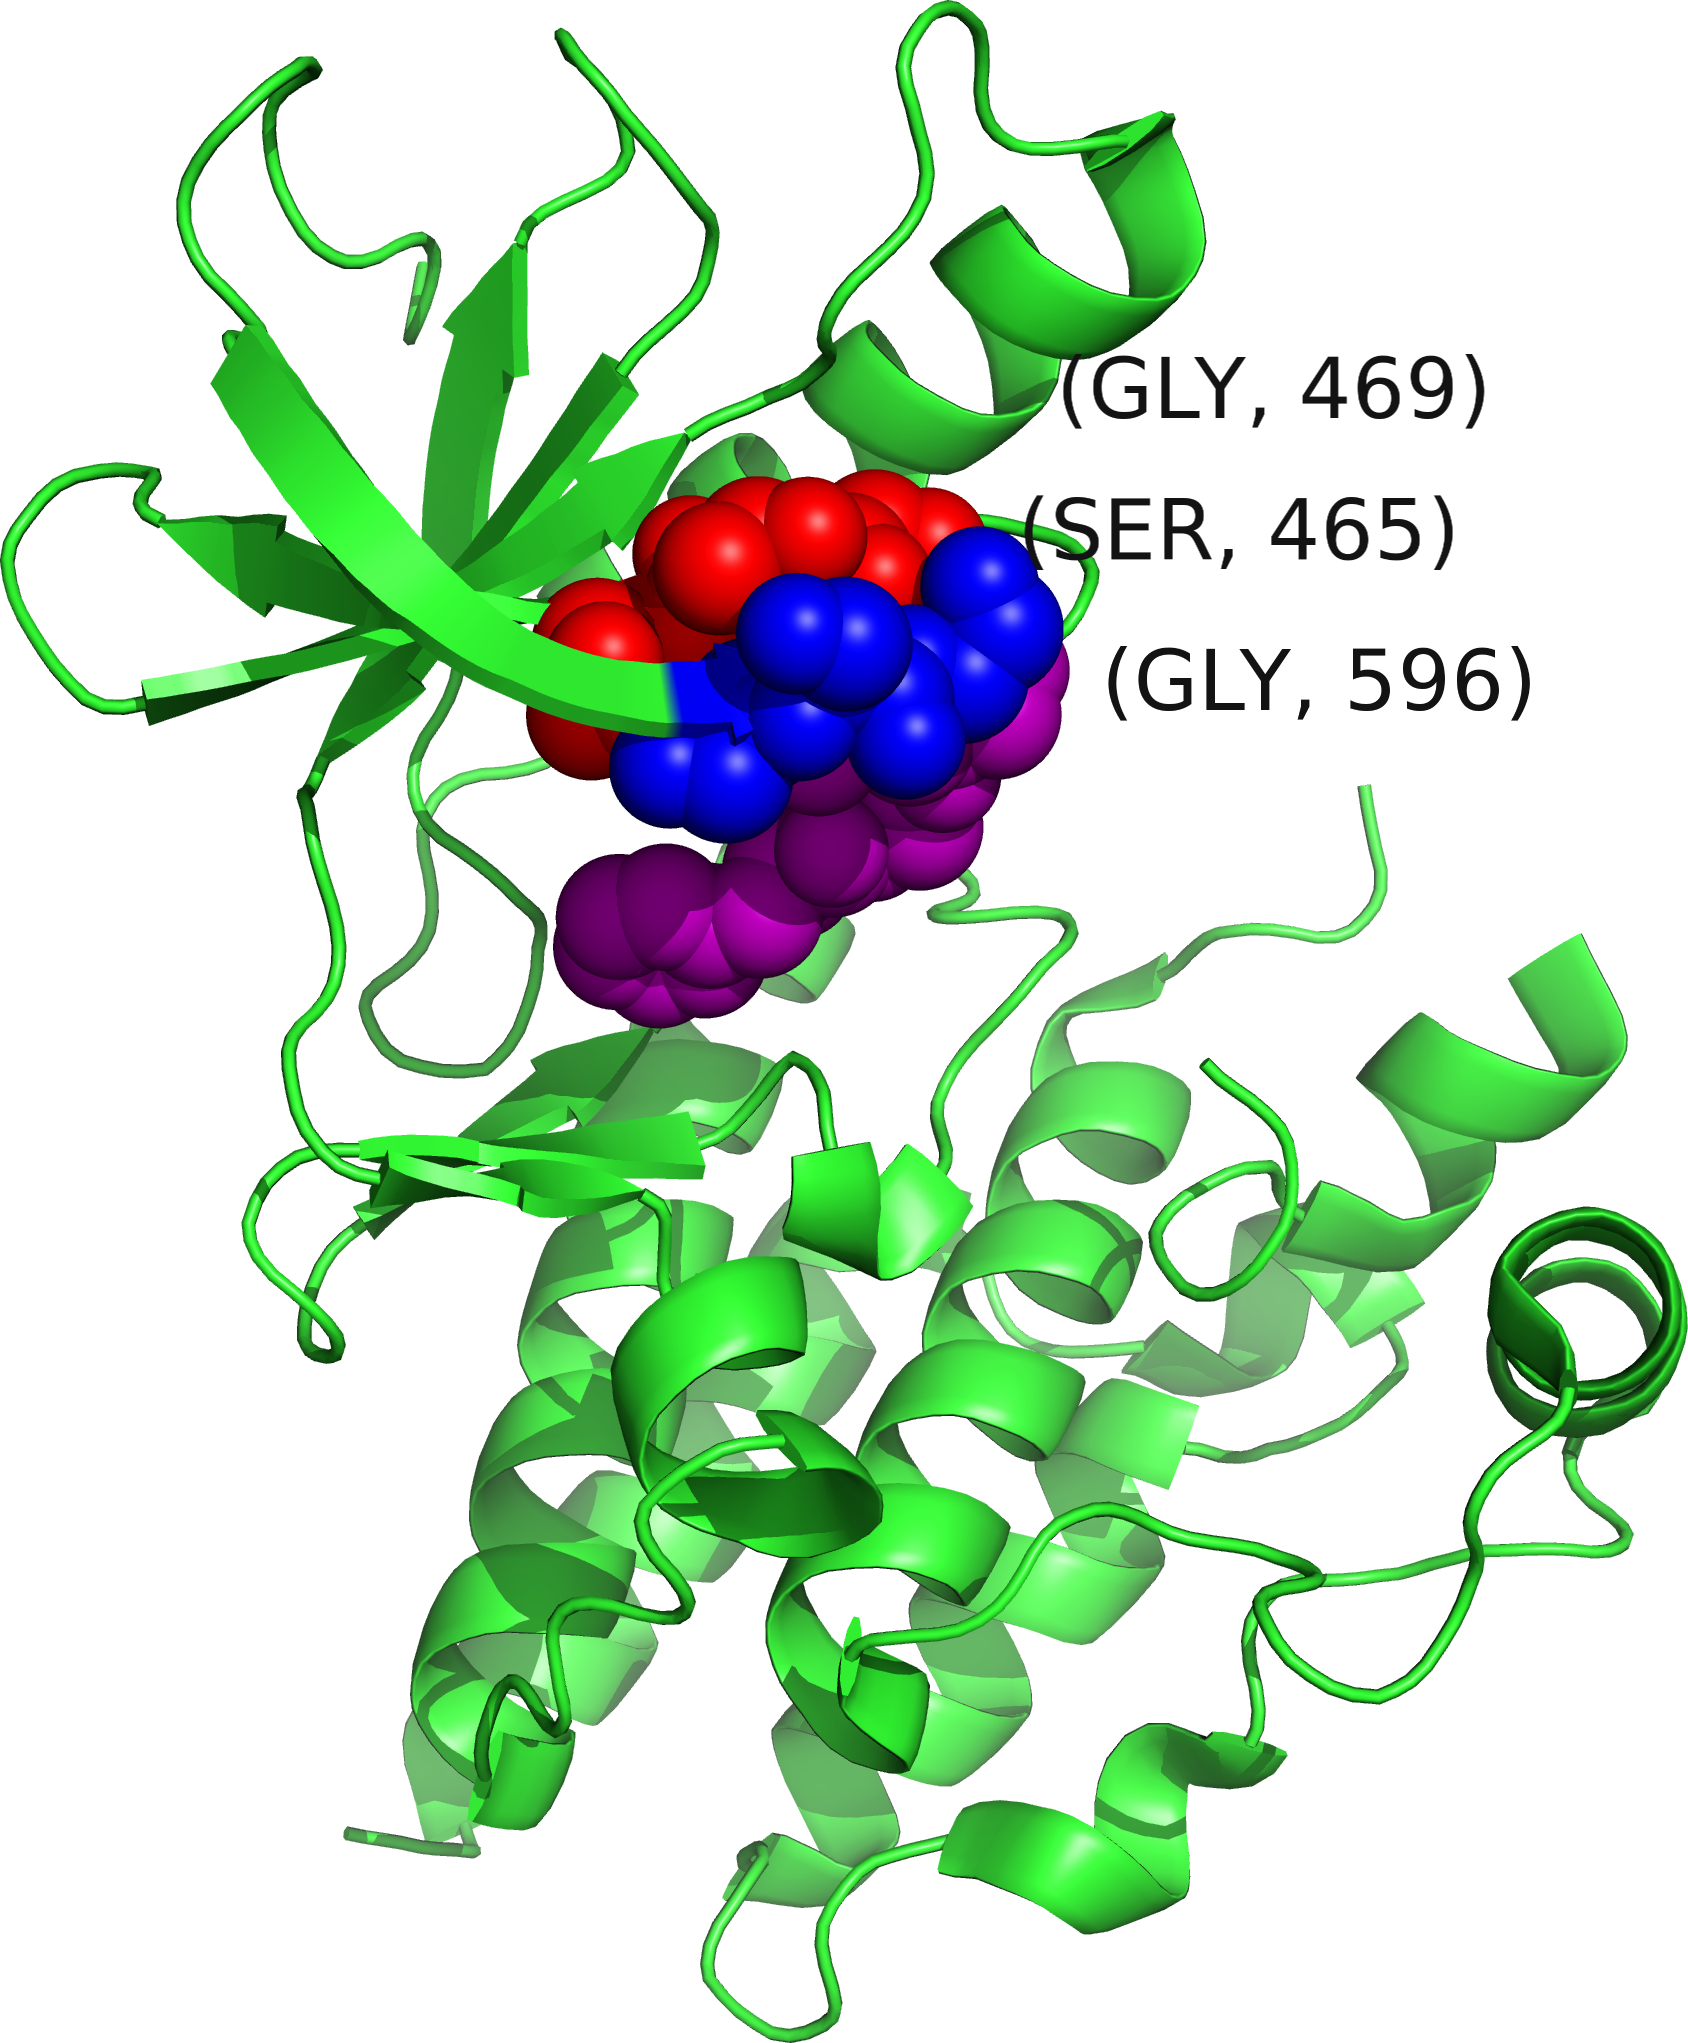
As the signal presented by V600 is so strong, it may mask the signal from other mutations within the BRAF protein. As such, we considered structure 3Q96 which does not have tertiary information for residues 600 and 601. Of the remaining 28 mutations spread over 12 residues, SpacePAC identifies three hot spots with 7-8 mutations per cluster as shown in Table 2 (combined hot spot p-value 1.00 E-03). Moreover, each of the three regions identified has been associated with oncogenic elevated kinase activity as well as a variety of cancers such as lung adenocarcinoma, melanoma, colorectal adenocarcinoma and ovarian serous carcinoma (Davies et al., 2002; Lee et al., 2003; Greenman et al., 2007).
| Hotspot | Center | Within Sphere | # Mutations |
|---|---|---|---|
| A | 465 | (464, 465, 466) | 8 |
| B | 470 | (469, 470, 471) | 7 |
| C | 596 | (595, 596, 597) | 7 |
Together, the three hotspots identified by SpacePAC cover 79% of the mutations for which tertiary information is available. Moreoever, while NMC, iPAC and the three GraphPAC methods report approximately 8 to 16 times as many clusters as SpacePAC (see Table 4), the additional clusters only cover the remaining 21% of mutations. Finally, all the residues that do not fall within SpacePAC hot spots are those which have only one mutation. These additional clusters stem from the fact that NMC, iPAC and GraphPAC must consider every pairwise combination of mutations resulting in many clusters that only differ from each other by a few residues. Further, by considering every pairwise combination, many smaller clusters are often combined into larger clusters with a less significant p-value. While technically still a “significant” cluster, these extra clusters provide little additional information. As SpacePAC does not have to consider every combination, it does not suffer from this issue.
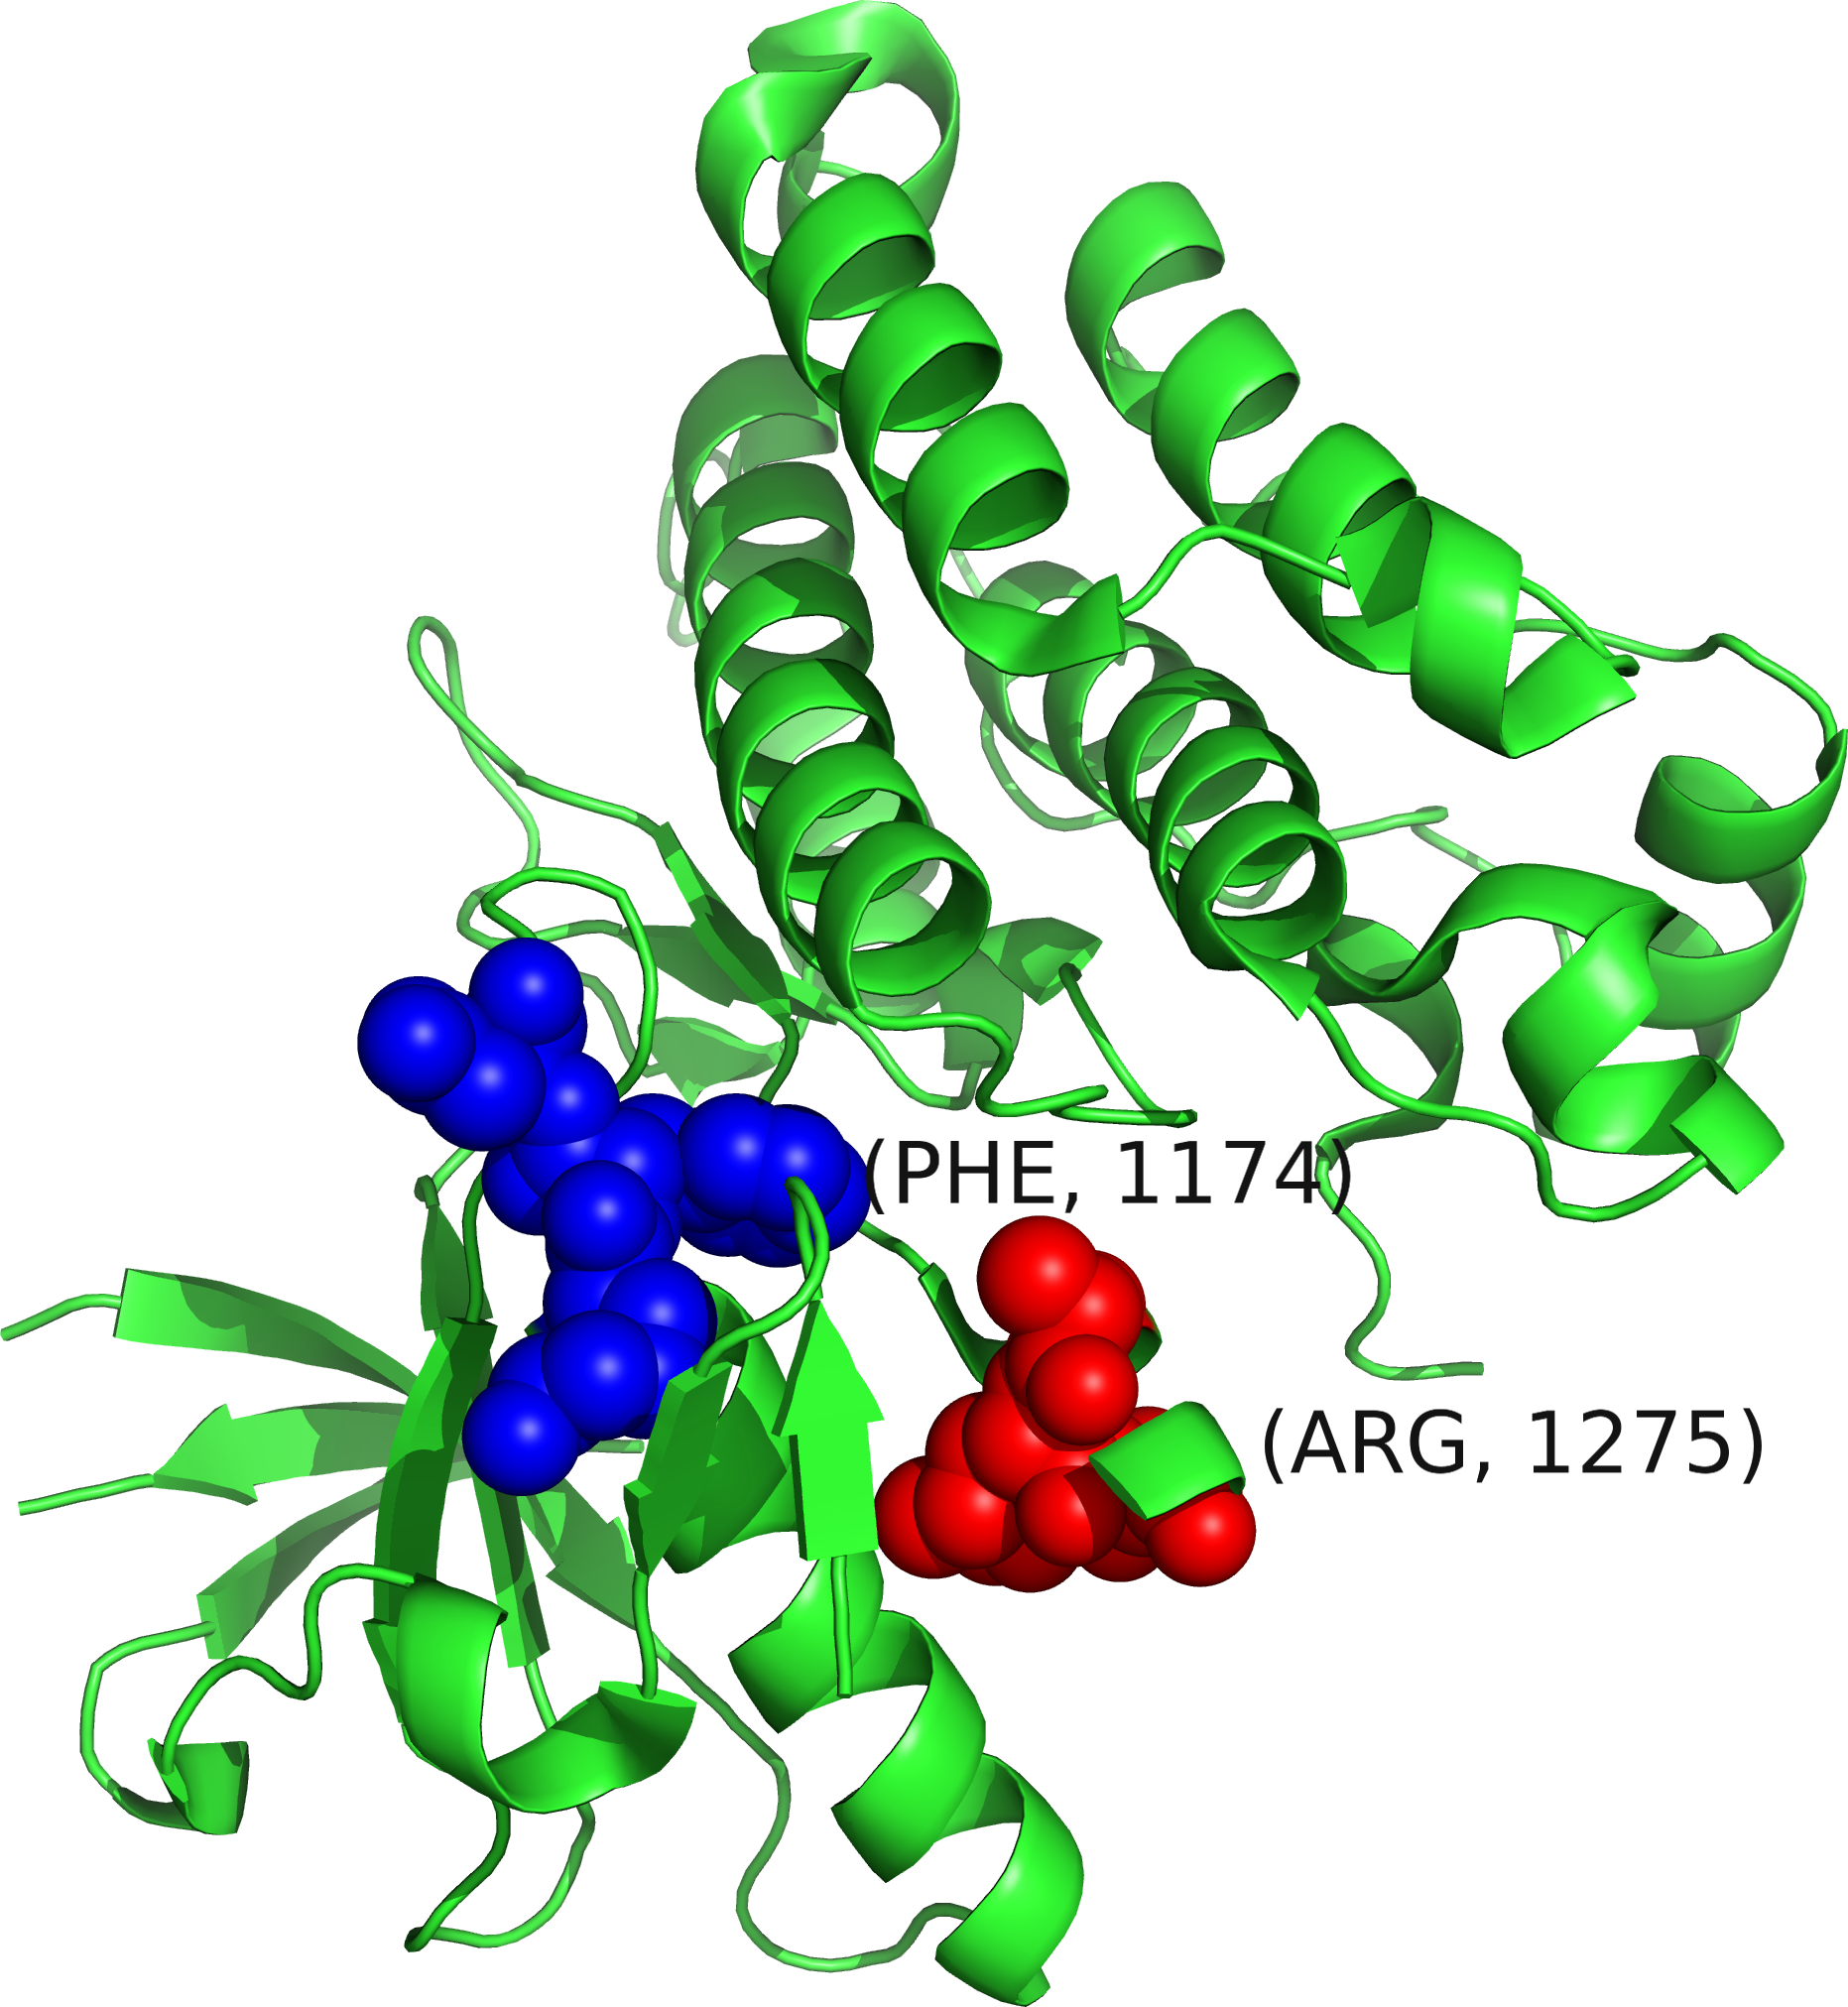
We now consider the Anaplastic Lymphoma Kinase (ALK) protein for which SpacePAC identifies two mutational hotspots (combined hot spot p-value 0.001) (see Table 3). The ALK protein is a receptor-type tyrosine kinase that is preferentially expressed in neurons during the late embryonic stages (Motegi, 2004). Mutations in this protein have been associated with both neuroblastoma as well as non-small cell lung cancer (Bang, 2012; George et al., 2008). Hotspots A and B in Table 3 both occur in the protein kinase. Further, mutations on F1174 and R1275 can cause constitutive activation which impairs receptor trafficking (Mazot et al., 2011). We note that SpacePAC perfectly identifies both hotspot locations. Moreover, it has recently been shown that activating mutations F1174L and R1275Q provide therapeutic targets in neuroblastoma (George et al., 2008), supporting the hypothesis that mutational clusters are indicative of activating mutations.
| Hotspot | Center | Within Sphere | # Mutations |
|---|---|---|---|
| A | 1174 | (1173, 1174, 1175) | 11 |
| B | 1275 | (1274, 1275, 1276) | 12 |
The two hotspots identified by SpacePAC cover 88.5% of all the mutations in our data with the remaining mutations occurring on residues with only one mutation each. Further, as seen in Table 4, the pairwise methods have 3 to 5.5 times as many clusters as SpacePAC. As before, by not having to consider every pairwise combination and thus not reporting similar clusters, SpacePAC is able to better localize the critical mutational areas.
| # Clusters/Hotspots | ||
|---|---|---|
| Method/ Protein-Structure | BRAF - 3Q96 | ALK-2XBA |
| SpacePAC | 3 | 2 |
| NMC | 22 | 11 |
| iPAC | 45 | 11 |
| GraphPAC-Cheapest | 36 | 7 |
| GraphPAC-Nearest | 45 | 8 |
| GraphPAC-Farthest | 47 | 6 |
4 Conclusion
In this article we provide a novel algorithm to account for protein tertiary structure when identifying mutational clusters in proteins. By considering the protein structure directly in 3D space, we avoid the use of a dimension reduction algorithm and potential information loss. Further, by not considering every pair of mutations, we are able to reduce the multiple comparison penalty and identify additional clusters. We show several examples of clusters that are not identified by alternative methods as well as the ability to improve cluster localization while still covering the majority of mutations. Moreover, several of our examples identified clusters which overlap potential therapeutic targets, supporting the hypothesis that clusters may be indicative of activating driver mutations. Finally, since the SpacePAC methodology does not need to look at every pairwise combination of mutations it also runs much faster for proteins with many () mutations. In these situations, while the pairwise methods may take several days to complete, SpacePAC still finishes in a matter of hours. For proteins with fewer mutations, the running time of all the pairwise methods as well as SpacePAC is comparable, with the majority of protein/structure combinations terminating in under 10 minutes when executed on a consumer desktop with an Intel i7-2600k processor (at a frequency of 3.40 GHZ) and 16 GB of DDR3 RAM.
SpacePAC, while presenting an important alternative to the one dimensionality restriction required by iPAC and GraphPAC, is nonetheless subject to several limitations. First, SpacePAC is currently limited to at most three mutational hotspots to save on computational time. While it is unlikely that a single structure will have more than three hotspots, the extension to allow SpacePAC to account for more than three hotspots is algorithmically simple. As SpacePAC was able to process our entire database of protein/structure combinations in under 5 hours (with all the structures evaluated in parallel), this restriction is minimal and will only grow smaller as computational power increases.
Second, to satisfy the uniformity assumption, the mutational status of each amino acid must be known. However, due to improvements in high-throughput sequencing, this is rapidly becoming a non-issue. Next, unequal rates of mutagenesis in specific genomic regions may violate the assumption that each residue has an equal probability of mutation. To help ensure that our data met this statistical assumption, we only considered missense mutations as many insertion and deletion mutations are sequence dependent. Relatedly, while the literature shows that CpG dinucleotides often have a mutational rate ten times or higher when compared to other locations (Sved and Bird, 1990), approximately only 14% of the clusters presented in section 3.1 and 3.2 overlapped CpG sites. Similarly, cigarette use typically causes transversion mutations within lung carcinomas (Ye et al., 2010) while colorectal carcinomas result in transition mutations (Hollstein et al., 1991). In the case of KRAS however, the vast majority of mutations are located on residues 12, 13 and 61 for both cancers. This signifies that while the mutational type may differ, the impact on mutation location is minimal and does not violate the uniformity assumption. Lastly, it is worth noting that as we obtained our mutational data from the COSMIC database, specific tissue types may be more represented than others. However, under this situation our analysis would be more conservative and the resulting findings even more significant as explained below. Aggregating over all tissues increases the total number of mutations, thus increasing the number of simulated mutations within any given segment of the protein. The resulting p-value of any observed hotspot would lose significance as more mutations would be simulated within the cluster. Overall, while this as well as previous studies are impacted by several external factors, it appears that selection of the cancer phenotype is the primary cause of clustering.
In conclusion, SpacePAC presents a novel approach to account for protein tertiary structure when identifying mutational hotspots. We show that SpacePAC identifies novel clusters of biological relevance, improves cluster localization and in several cases identifies pharmaceutical targets for which therapies are already in production. In turn, we further confirm the hypothesis that mutational hotspots are indicative of driver mutations and show that SpacePAC can be used to quickly locate such potential mutations as additional structures are published.
Author’s contributions
GR, DZ and HZ developed the SpacePAC methology. KC and YC were responsible for obtaining the mutation data from the COSMIC database. GR and YC executed the methodology on the protein structures. GR drafted the original manuscript while KC, YC, YM, DZ and HZ were responsible for revisions. HZ finalized the manuscript. All authors have read and approved the final text. This work was supported in part by NSF Grant DMS 1106738 (GR, HZ), NIH Grants GM59507 and CA154295 (HZ).
Acknowledgements
We thank Dr. Francesca Chiaromonte for her time and help in discussing this methodology.
Competing Interests
The authors declare that they have no competing interests.
References
- Adzhubei et al. (2010) Adzhubei, I. A., Schmidt, S., Peshkin, L., Ramensky, V. E., Gerasimova, A., Bork, P., Kondrashov, A. S., and Sunyaev, S. R. (2010). A method and server for predicting damaging missense mutations. Nature Methods, 7(4), 248–249.
- Andreu-Pérez et al. (2011) Andreu-Pérez, P., Esteve-Puig, R., de Torre-Minguela, C., López-Fauqued, M., Bech-Serra, J. J., Tenbaum, S., García-Trevijano, E. R., Canals, F., Merlino, G., Avila, M. A., and Recio, J. A. (2011). Protein arginine methyltransferase 5 regulates ERK1/2 signal transduction amplitude and cell fate through CRAF. Science signaling, 4(190), ra58. PMID: 21917714.
- Bang (2012) Bang, Y.-J. (2012). Treatment of ALK-positive non-small cell lung cancer. Archives of pathology & laboratory medicine, 136(10), 1201–1204. PMID: 23020724.
- Bardelli et al. (2003) Bardelli, A., Parsons, D. W., Silliman, N., Ptak, J., Szabo, S., Saha, S., Markowitz, S., Willson, J. K. V., Parmigiani, G., Kinzler, K. W., Vogelstein, B., and Velculescu, V. E. (2003). Mutational analysis of the tyrosine kinome in colorectal cancers. Science (New York, N.Y.), 300(5621), 949. PMID: 12738854.
- Benjamini and Hochberg (1995) Benjamini, Y. and Hochberg, Y. (1995). Controlling the false discovery rate: A practical and powerful approach to multiple testing. Journal of the Royal Statistical Society. Series B (Methodological), 57(1), pp. 289–300.
- Borg and Groenen (1997) Borg, I. and Groenen, P. J. F. (1997). Modern multidimensional scaling : theory and applications. Springer, New York.
- Bossi et al. (2010) Bossi, R. T., Saccardo, M. B., Ardini, E., Menichincheri, M., Rusconi, L., Magnaghi, P., Orsini, P., Avanzi, N., Borgia, A. L., Nesi, M., Bandiera, T., Fogliatto, G., and Bertrand, J. A. (2010). Crystal structures of anaplastic lymphoma kinase in complex with ATP competitive inhibitors. Biochemistry, 49(32), 6813–6825. PDB ID: 2XBA.
- Breiman (2001) Breiman, L. (2001). Random forests. Machine Learning, 45, 5–32.
- Carter et al. (2009) Carter, H., Chen, S., Isik, L., Tyekucheva, S., Velculescu, V. E., Kinzler, K. W., Vogelstein, B., and Karchin, R. (2009). Cancer-specific high-throughput annotation of somatic mutations: Computational prediction of driver missense mutations. Cancer Research, 69(16), 6660–6667.
- Consortium (2011) Consortium, T. U. (2011). Reorganizing the protein space at the universal protein resource (UniProt). Nucleic Acids Research, 40(D1), D71–D75.
- Cortes and Vapnik (1995) Cortes, C. and Vapnik, V. (1995). Support-vector networks. Machine Learning, 20(3), 273–297.
- Davies et al. (2002) Davies, H., Bignell, G. R., Cox, C., Stephens, P., Edkins, S., Clegg, S., Teague, J., Woffendin, H., Garnett, M. J., Bottomley, W., Davis, N., Dicks, E., Ewing, R., Floyd, Y., Gray, K., Hall, S., Hawes, R., Hughes, J., Kosmidou, V., Menzies, A., Mould, C., Parker, A., Stevens, C., Watt, S., Hooper, S., Wilson, R., Jayatilake, H., Gusterson, B. A., Cooper, C., Shipley, J., Hargrave, D., Pritchard-Jones, K., Maitland, N., Chenevix-Trench, G., Riggins, G. J., Bigner, D. D., Palmieri, G., Cossu, A., Flanagan, A., Nicholson, A., Ho, J. W. C., Leung, S. Y., Yuen, S. T., Weber, B. L., Seigler, H. F., Darrow, T. L., Paterson, H., Marais, R., Marshall, C. J., Wooster, R., Stratton, M. R., and Futreal, P. A. (2002). Mutations of the BRAF gene in human cancer. Nature, 417(6892), 949–954. PMID: 12068308.
- Faivre et al. (2006) Faivre, S., Kroemer, G., and Raymond, E. (2006). Current development of mTOR inhibitors as anticancer agents. Nature Reviews Drug Discovery, 5(8), 671–688.
- Ferretti et al. (2013) Ferretti, M., Fabbiano, C., Bari, M. D., Conte, C., Castigli, E., Sciaccaluga, M., Ponti, D., Ruggieri, P., Raco, A., Ricordy, R., Calogero, A., and Tata, A. M. (2013). M2 receptor activation inhibits cell cycle progression and survival in human glioblastoma cells. Journal of Cellular and Molecular Medicine, 17(4), 552–566.
- Friedman et al. (1997) Friedman, N., Geiger, D., and Goldszmidt, M. (1997). Bayesian network classifiers. Machine learning, 29(2-3), 131–163.
- George et al. (2008) George, R. E., Sanda, T., Hanna, M., Fröhling, S., Ii, W. L., Zhang, J., Ahn, Y., Zhou, W., London, W. B., McGrady, P., Xue, L., Zozulya, S., Gregor, V. E., Webb, T. R., Gray, N. S., Gilliland, D. G., Diller, L., Greulich, H., Morris, S. W., Meyerson, M., and Look, A. T. (2008). Activating mutations in ALK provide a therapeutic target in neuroblastoma. Nature, 455(7215), 975–978.
- Gong et al. (2009) Gong, Y., Kakihara, Y., Krogan, N., Greenblatt, J., Emili, A., Zhang, Z., and Houry, W. A. (2009). An atlas of chaperone–protein interactions in saccharomyces cerevisiae: implications to protein folding pathways in the cell. Molecular Systems Biology, 5.
- Gould et al. (2011) Gould, A. E., Adams, R., Adhikari, S., Aertgeerts, K., Afroze, R., Blackburn, C., Calderwood, E. F., Chau, R., Chouitar, J., Duffey, M. O., England, D. B., Farrer, C., Forsyth, N., Garcia, K., Gaulin, J., Greenspan, P. D., Guo, R., Harrison, S. J., Huang, S.-C., Iartchouk, N., Janowick, D., Kim, M.-S., Kulkarni, B., Langston, S. P., Liu, J. X., Ma, L.-T., Menon, S., Mizutani, H., Paske, E., Renou, C. C., Rezaei, M., Rowland, R. S., Sintchak, M. D., Smith, M. D., Stroud, S. G., Tregay, M., Tian, Y., Veiby, O. P., Vos, T. J., Vyskocil, S., Williams, J., Xu, T., Yang, J. J., Yano, J., Zeng, H., Zhang, D. M., Zhang, Q., and Galvin, K. M. (2011). Design and optimization of potent and orally bioavailable tetrahydronaphthalene raf inhibitors. Journal of Medicinal Chemistry, 54(6), 1836–1846. PDB ID: 3Q96.
- Greenman et al. (2007) Greenman, C., Stephens, P., Smith, R., Dalgliesh, G. L., Hunter, C., Bignell, G., Davies, H., Teague, J., Butler, A., Stevens, C., Edkins, S., O’Meara, S., Vastrik, I., Schmidt, E. E., Avis, T., Barthorpe, S., Bhamra, G., Buck, G., Choudhury, B., Clements, J., Cole, J., Dicks, E., Forbes, S., Gray, K., Halliday, K., Harrison, R., Hills, K., Hinton, J., Jenkinson, A., Jones, D., Menzies, A., Mironenko, T., Perry, J., Raine, K., Richardson, D., Shepherd, R., Small, A., Tofts, C., Varian, J., Webb, T., West, S., Widaa, S., Yates, A., Cahill, D. P., Louis, D. N., Goldstraw, P., Nicholson, A. G., Brasseur, F., Looijenga, L., Weber, B. L., Chiew, Y.-E., deFazio, A., Greaves, M. F., Green, A. R., Campbell, P., Birney, E., Easton, D. F., Chenevix-Trench, G., Tan, M.-H., Khoo, S. K., Teh, B. T., Yuen, S. T., Leung, S. Y., Wooster, R., Futreal, P. A., and Stratton, M. R. (2007). Patterns of somatic mutation in human cancer genomes. Nature, 446(7132), 153–158.
- Hadari and Schlessinger (2009) Hadari, Y. and Schlessinger, J. (2009). FGFR3-targeted mAb therapy for bladder cancer and multiple myeloma. Journal of Clinical Investigation, 119(5), 1077–1079.
- Hafner (2006) Hafner, C. (2006). Mosaicism of activatingFGFR3 mutations in human skin causes epidermal nevi. Journal of Clinical Investigation, 116(8), 2201–2207.
- Haga et al. (2012) Haga, K., Kruse, A. C., Asada, H., Yurugi-Kobayashi, T., Shiroishi, M., Zhang, C., Weis, W. I., Okada, T., Kobilka, B. K., Haga, T., and Kobayashi, T. (2012). Structure of the human m2 muscarinic acetylcholine receptor bound to an antagonist. Nature, 482(7386), 547–551. PDB ID: 3UON.
- Hart et al. (2001) Hart, K. C., Robertson, S. C., and Donoghue, D. J. (2001). Identification of tyrosine residues in constitutively activated fibroblast growth factor receptor 3 involved in mitogenesis, stat activation, and phosphatidylinositol 3-kinase activation. Molecular Biology of the Cell, 12(4), 931–942.
- Hartmann et al. (2009) Hartmann, J. T., Haap, M., Kopp, H.-G., and Lipp, H.-P. (2009). Tyrosine kinase inhibitors - a review on pharmacology, metabolism and side effects. Current drug metabolism, 10(5), 470–481. PMID: 19689244.
- Hingorani et al. (2003) Hingorani, S. R., Jacobetz, M. A., Robertson, G. P., Herlyn, M., and Tuveson, D. A. (2003). Suppression of BRAF(V599E) in human melanoma abrogates transformation. Cancer research, 63(17), 5198–5202. PMID: 14500344.
- Hollstein et al. (1991) Hollstein, M., Sidransky, D., Vogelstein, B., and Harris, C. C. (1991). p53 mutations in human cancers. Science (New York, N.Y.), 253(5015), 49–53. PMID: 1905840.
- Koch et al. (1999) Koch, A., Denkhaus, D., Albrecht, S., Leuschner, I., von Schweinitz, D., and Pietsch, T. (1999). Childhood hepatoblastomas frequently carry a mutated degradation targeting box of the beta-catenin gene. Cancer research, 59(2), 269–273. PMID: 9927029.
- Kreitman (2000) Kreitman, M. (2000). Methods to detect selection in populations with applications to the human. Annual Review of Genomics and Human Genetics, 1(1), 539–559.
- Lee et al. (2003) Lee, J. W., Yoo, N. J., Soung, Y. H., Kim, H. S., Park, W. S., Kim, S. Y., Lee, J. H., Park, J. Y., Cho, Y. G., Kim, C. J., Ko, Y. H., Kim, S. H., Nam, S. W., Lee, J. Y., and Lee, S. H. (2003). BRAF mutations in non-hodgkin’s lymphoma. British journal of cancer, 89(10), 1958–1960. PMID: 14612909.
- Legoix et al. (1999) Legoix, P., Bluteau, O., Bayer, J., Perret, C., Balabaud, C., Belghiti, J., Franco, D., Thomas, G., Laurent-Puig, P., and Zucman-Rossi, J. (1999). Beta-catenin mutations in hepatocellular carcinoma correlate with a low rate of loss of heterozygosity. Oncogene, 18(27), 4044–4046. PMID: 10435629.
- Lynch et al. (2004) Lynch, T. J., Bell, D. W., Sordella, R., Gurubhagavatula, S., Okimoto, R. A., Brannigan, B. W., Harris, P. L., Haserlat, S. M., Supko, J. G., Haluska, F. G., Louis, D. N., Christiani, D. C., Settleman, J., and Haber, D. A. (2004). Activating mutations in the epidermal growth factor receptor underlying responsiveness of non-small-cell lung cancer to gefitinib. The New England journal of medicine, 350(21), 2129–2139. PMID: 15118073.
- Mao et al. (2012) Mao, M., Tian, F., Mariadason, J. M., Tsao, C. C., Lemos, R., Dayyani, F., Gopal, Y. N. V., Jiang, Z.-Q., Wistuba, I. I., Tang, X. M., Bornman, W. G., Bollag, G., Mills, G. B., Powis, G., Desai, J., Gallick, G. E., Davies, M. A., and Kopetz, S. (2012). Resistance to BRAF inhibition in BRAF-Mutant colon cancer can be overcome with PI3K inhibition or demethylating agents. Clinical Cancer Research, 19(3), 657–667.
- Mazot et al. (2011) Mazot, P., Cazes, A., Boutterin, M. C., Figueiredo, A., Raynal, V., Combaret, V., Hallberg, B., Palmer, R. H., Delattre, O., Janoueix-Lerosey, I., and Vigny, M. (2011). The constitutive activity of the ALK mutated at positions f1174 or r1275 impairs receptor trafficking. Oncogene, 30(17), 2017–2025.
- Moreau et al. (2012) Moreau, P., Richardson, P. G., Cavo, M., Orlowski, R. Z., San Miguel, J. F., Palumbo, A., and Harousseau, J.-L. (2012). Proteasome inhibitors in multiple myeloma: 10 years later. Blood, 120(5), 947–959.
- Motegi (2004) Motegi, A. (2004). ALK receptor tyrosine kinase promotes cell growth and neurite outgrowth. Journal of Cell Science, 117(15), 3319–3329.
- Ng and Henikoff (2001) Ng, P. C. and Henikoff, S. (2001). Predicting deleterious amino acid substitutions. Genome research, 11(5), 863–874. PMID: 11337480.
- Ockenga et al. (2013) Ockenga, W., Kühne, S., Bocksberger, S., Banning, A., and Tikkanen, R. (2013). Non-neuronal functions of the m2 muscarinic acetylcholine receptor. Genes, 4(2), 171–197.
- Olsen (2004) Olsen, S. K. (2004). Insights into the molecular basis for fibroblast growth factor receptor autoinhibition and ligand-binding promiscuity. Proceedings of the National Academy of Sciences, 101(4), 935–940. PDB ID: 1RY7.
- Pages et al. (2012) Pages, H., Aboyoun, P., Gentleman, R., and DebRoy, S. (2012). Biostrings: String objects representing biological sequences, and matching algorithms. R package version 2.24.1.
- Qing et al. (2009) Qing, J., Du, X., Chen, Y., Chan, P., Li, H., Wu, P., Marsters, S., Stawicki, S., Tien, J., Totpal, K., Ross, S., Stinson, S., Dornan, D., French, D., Wang, Q.-R., Stephan, J.-P., Wu, Y., Wiesmann, C., and Ashkenazi, A. (2009). Antibody-based targeting of FGFR3 in bladder carcinoma and t(4;14)-positive multiple myeloma in mice. Journal of Clinical Investigation, 119(5), 1216–1229.
- Rajagopalan et al. (2002) Rajagopalan, H., Bardelli, A., Lengauer, C., Kinzler, K. W., Vogelstein, B., and Velculescu, V. E. (2002). Tumorigenesis: RAF/RAS oncogenes and mismatch-repair status. Nature, 418(6901), 934. PMID: 12198537.
- Reva et al. (2011) Reva, B., Antipin, Y., and Sander, C. (2011). Predicting the functional impact of protein mutations: application to cancer genomics. Nucleic Acids Research, 39(17), e118–e118.
- Rousseau (1996) Rousseau, F. (1996). Missense FGFR3 mutations create cysteine residues in thanatophoric dwarfism type i (TD1). Human Molecular Genetics, 5(4), 509–512.
- Ryslik et al. (2013a) Ryslik, G., Cheng, Y., Cheung, k.-H., Modis, Y., and Zhao, H. (2013a). Utilizing protein structure to identify non-random somatic mutations. pre-print. arXiv:1302.6977 [q-bio.GN].
- Ryslik et al. (2013b) Ryslik, G. A., Cheng, Y., Cheung, K.-H., Modis, Y., and Zhao, H. (2013b). A graph theoretic approach to utilizing protein structure to identify non-random somatic mutations. pre-print. arXiv:1303.5889.
- Siraj et al. (2013) Siraj, A., Desestret, V., Antoine, M., Fromont, G., Huerre, M., Sanson, M., Camparo, P., Pichon, C., Planeix, F., Gonin, J., Radu, A., and Ghinea, N. (2013). Expression of follicle-stimulating hormone receptor by the vascular endothelium in tumor metastases. BMC Cancer, 13(1), 246.
- Sjöblom et al. (2006) Sjöblom, T., Jones, S., Wood, L. D., Parsons, D. W., Lin, J., Barber, T. D., Mandelker, D., Leary, R. J., Ptak, J., Silliman, N., Szabo, S., Buckhaults, P., Farrell, C., Meeh, P., Markowitz, S. D., Willis, J., Dawson, D., Willson, J. K. V., Gazdar, A. F., Hartigan, J., Wu, L., Liu, C., Parmigiani, G., Park, B. H., Bachman, K. E., Papadopoulos, N., Vogelstein, B., Kinzler, K. W., and Velculescu, V. E. (2006). The consensus coding sequences of human breast and colorectal cancers. Science (New York, N.Y.), 314(5797), 268–274. PMID: 16959974.
- Sved and Bird (1990) Sved, J. and Bird, A. (1990). The expected equilibrium of the cpg dinucleotide in vertebrate genomes under a mutation model. Proceedings of the National Academy of Sciences, 87(12), 4692–4696.
- Tan et al. (2008) Tan, Y. H., Liu, Y., Eu, K. W., Ang, P. W., Li, W. Q., Salto-Tellez, M., Iacopetta, B., and Soong, R. (2008). Detection of BRAF V600E mutation by pyrosequencing. Pathology, 40(3), 295–298.
- Torkamani and Schork (2008) Torkamani, A. and Schork, N. J. (2008). Prediction of cancer driver mutations in protein kinases. Cancer Research, 68(6), 1675–1682. PMID: 18339846.
- Vogelstein and Kinzler (2004) Vogelstein, B. and Kinzler, K. W. (2004). Cancer genes and the pathways they control. Nature Medicine, 10(8), 789–799. PMID: 15286780.
- Wagner (2007) Wagner, A. (2007). Rapid detection of positive selection in genes and genomes through variation clusters. Genetics, 176(4), 2451–2463.
- Wang (2002) Wang, T. (2002). Prevalence of somatic alterations in the colorectal cancer cell genome. Proceedings of the National Academy of Sciences, 99(5), 3076–3080.
- Weinstein and Joe (2006) Weinstein, I. B. and Joe, A. K. (2006). Mechanisms of disease: Oncogene addiction–a rationale for molecular targeting in cancer therapy. Nature Clinical Practice. Oncology, 3(8), 448–457. PMID: 16894390.
- Ye et al. (2010) Ye, J., Pavlicek, A., Lunney, E. A., Rejto, P. A., and Teng, C. (2010). Statistical method on nonrandom clustering with application to somatic mutations in cancer. BMC Bioinformatics, 11(1), 11.
- Youn and Simon (2010) Youn, A. and Simon, R. (2010). Identifying cancer driver genes in tumor genome sequencing studies. Bioinformatics, 27(2), 175–181.
- Zhou et al. (2008) Zhou, T., Enyeart, P. J., and Wilke, C. O. (2008). Detecting clusters of mutations. PLoS ONE, 3(11), e3765.