figurec
Evidence for dipole nature of the low-energy enhancement in 56Fe
Abstract
The -ray strength function of 56Fe has been measured from proton- coincidences for excitation energies up to MeV. The low-energy enhancement in the -ray strength function, which was first discovered in the (3He,)56Fe reaction, is confirmed with the ()56Fe experiment reported here. Angular distributions of the rays give for the first time evidence that the enhancement is dominated by dipole transitions.
pacs:
25.20.Lj, 24.30.Gd, 27.40.+zAtomic nuclei are microscopic systems governed by the laws of quantum mechanics. To understand such systems, detailed studies of the accessible quantum-energy levels and their decay properties are vital. The -ray strength function (SF) is a measure of the average, reduced -decay probability of the nucleus, and is considered a fruitful concept at high excitation energies where the level spacing is small (the quasi-continuum region).
Structures in the SF provide information on the underlying nuclear dynamics and degrees of freedom, such as the scissors mode heyde2010 ; schiller2006 ; krticka2004 and the giant electric dipole resonance (GDR) harakeh2000 . The SF is also indispensable for predicting reaction cross sections for the astrophysical nucleosynthesis. Specifically, when there is no equilibrium, the shape of the SF in the vicinity of the neutron threshold plays a crucial role for the reaction rates relevant for the rapid neutron-capture process (r-process) go98 ; ar07 .
An enhancement in the SF for energies below MeV has been discovered in several -shell and medium-mass nuclei using the Oslo method, such as 56,57Fe Fe_Alex and 93-98Mo Mo_RSF . Recently, the low-energy enhancement (hereby denoted upbend) was confirmed in a ()95Mo experiment wiedeking95Mo , using a different detector setup and a model-independent method to extract the SF. The upbend could induce an increase of up to two orders of magnitude in the () reaction rates in very neutron-rich isotopes larsen_goriely . Depending on the actual conditions at the astrophysical r-process site, this could be of great importance for the r-process larsen_goriely .
Despite the potentially crucial role of the upbend for astrophysics applications, its extent and origin remains largely unknown. In particular, the physical mechanism causing the upbend is not understood, mainly because information on the multipolarity and electromagnetic character is lacking. Only for 60Ni there are data indicating that the upbend is due to transitions Ni_Alex . However, 60Ni might be a special case with only positive-parity states below excitation energies of MeV. Up to now, data on Fe isotopes are inconclusive regarding the radiation type; neither , , or radiation could be excluded (see Fig. 3 in Ref. Fe_Alex ).
Recent theoretical works on the upbend suggest that it is of nature and due to transitions in the single-(quasi)particle continuum litvinova2013 , or of type and caused by a reorientation of high- neutron and proton spins schwengner2013 . Apart from the single-particle picture, one could also imagine that strong collective transitions might cause such an enhancement, for example rotational () or vibrational () transitions in the quasi-continuum.
In this Letter, we show new data on the SF of 56Fe. The present data set from the inelastic scattering reaction 56Fe()56Fe yielded high statistics and allowed for a detailed analysis of the -ray angular distributions. We present here for the first time results on the multipolarity of the upbend. To our knowledge, this is also the first time where the angular-distribution analyzing tool has been applied to primary transitions with a broad distribution of energies at high excitation energies.
The experiment was performed at the Oslo Cyclotron Laboratory (OCL), using a 16-MeV proton beam with intensity nA hitting a self-supporting target of 99.9% enriched 56Fe with mass thickness of 2 mg/cm2. Accumulating time was hours. The charged ejectiles were measured with the Silicon Ring (SiRi) particle-detector system siri and the rays with the CACTUS array CACTUS . The SiRi system consists of eight telescopes, where the front detector is segmented into eight strips (), covering scattering angles between . In total, SiRi has a solid-angle coverage of %. Using the technique, each charged-particle species was identified and a gate was set on the outgoing protons. From the reaction kinematics, the proton energy was converted into excitation energy in the residual nucleus.
In this experiment, the CACTUS array contained 22 collimated NaI:Tl detectors, and six collimated LaBr3:Ce detectors giaz2013 ; nicolini2007 . At the front of the crystals, the conically shaped lead collimators have a radius of 3.5 cm, and the distance to the target is 22 cm, yielding an internal semi-angle of 9∘. The NaI detectors were placed in the CACTUS frame with six different angles with respect to the beam axis: 37.4, 63.4, 79.3, 100.7, 116.6, and 142.6 degrees, while the LaBr3 crystals covered four angles: 63.4, 79.3, 100.7, and 116.6 degrees.
The spectra were unfolded using the technique described in Ref. gutt6 , but with new response functions from lines of excited states in 13C, 16,17O, 28Si, and 56,57Fe populated with various inelastic-scattering and transfer reactions. Furthermore, the distribution of the primary rays for each excitation-energy bin (124 keV wide) was determined from an iterative subtraction technique Gut87 .
| (keV) | (keV) | |||||||
|---|---|---|---|---|---|---|---|---|
| 12C | 4439 | 4438 | 0.714 | 0.55(9) | ||||
| 16O | 6130 | 6129 | 1.85(8) | |||||
| 56Fe | 847 | 847 | 0.714 | 0.29(18) | ||||
| 56Fe | 3123 | 1038 | 0.31(13) | 0.00 | ||||
| 56Fe | 3856 | 1771 | 0.00 | |||||
| 56Fe | 4510 | 3663 | 0.00 | |||||
| 56Fe | 5122 | 3037 | 0.00 | 0.20(17) | ||||
| 57Fe | 706 | 692 | 0.12 |
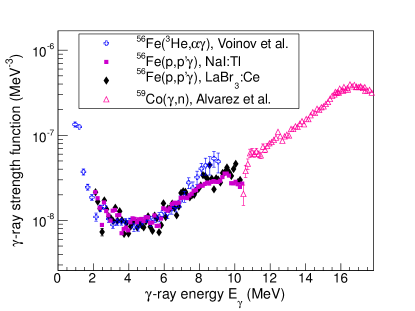
From the matrix of primary spectra, we have extracted simultaneously the level density and -transmission coefficient for 56Fe using the least method given in Ref. Schiller00 . The absolute value and slope of the level density were determined from discrete levels ENSDF below an excitation energy of MeV and from the comparison to particle-evaporation data Voinov2006 ; Vonach1966 . To get the absolute value of the -transmission coefficient, we used estimated values from systematics (as there are no experimental values) for the neutron-resonance level spacing eV and the total, average width meV, and spin cutoff parameters from Ref. egidy2009 . Assuming that dipole radiation dominates the decay in the quasi-continuum region, the SF is deduced from the -transmission coefficient by
| (1) |
where is the SF for energy , and is the -transmission coefficient. The resulting SFs obtained from the LaBr3 and NaI spectra are shown in Fig. 1.
We observe that our new data are in overall very good agreement with the (3He,) data of Ref. Fe_Alex . The upbend is confirmed, using new, higher-resolution detectors and response functions. Also, the different reaction type is expected to populate lower initial spins than the (3He,) reaction, which has a high cross section for high- pickup casten1972 . Compared to the (3He,) experiment, the particle-detector resolution has been improved from 400 keV to 90 keV (full-width half maximum), and the -energy resolution has been improved by more than a factor of 2 for all energies using the LaBr3 crystals. Thus, the upbend is clearly independent from systematic errors in the detector response and reaction-induced effects. The difference in strength at high energies might be due to small variations in the normalization of the level density and the new and more precise response functions. Also, we see a good match with photo-neutron data on 59Co Alvarez1979 , supporting the chosen values for and .
Making use of the various angles for which the NaI detectors were placed, angular distributions were extracted by sorting the data into matrices according to the angle of the NaI detectors relative to the beam direction. From the intensities as a function of angle, we have fitted angular-distribution functions of the form mateosian1974
| (2) |
where is a Legendre polynomial of degree . The LaBr3 detectors were placed at only four angles and were not used for this analysis, although we note that the shape of the angular distributions for the LaBr3 and NaI detectors are in very good agreement for the four overlapping angles.
The normalized angular-distribution coefficients are given by , where is the geometrical attenuation coefficient due to the finite size of the detectors, and is the attenuation due to partial alignment of the nuclei relative to the beam direction. Errors in the intensities are given by , where the statistical errors are estimated with where is the number of counts, and the systematic errors are deduced from the relative change in for each symmetric pair of angles (37.4∘,142.6∘), (63.4∘,116.6∘), and (79.3∘,100.7∘). Note that for this high-statistics experiment, the statistical error bars are in general small. However, the systematic uncertainties due to partly asymmetric intensities for the pairs of angles can in some cases be rather large, which in turn influence the uncertainties in the coefficients.
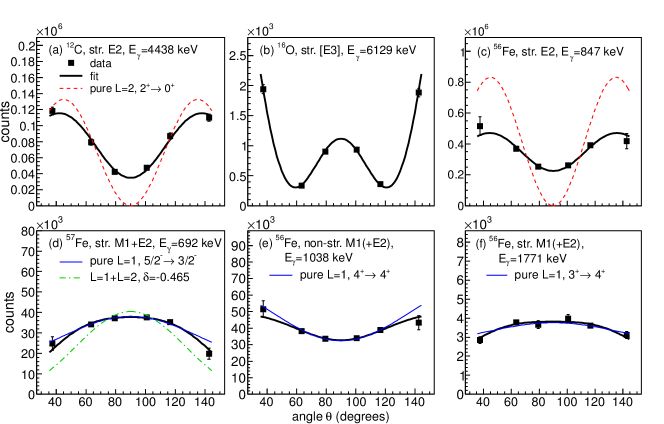
The resulting angular distributions for the 4.4-MeV transition in 12C and the 6.1-MeV [E3] transition in 16O are shown in Fig. 2 (a) and (b). Correspondingly, transitions in 56Fe and 57Fe are shown in Fig. 2 (c)(f). The extracted angular-distribution coefficients are given in Tab. 1. The stretched dipole, quadrupole and octupole transitions are easily distinguished from each other. We also observe that the attenuation due to partial alignment is becoming less and less pronounced as the excitation energy increases; in fact, the coefficients are in good agreement with the data above MeV in 56Fe (see Fig. 2 (e) and (f)).
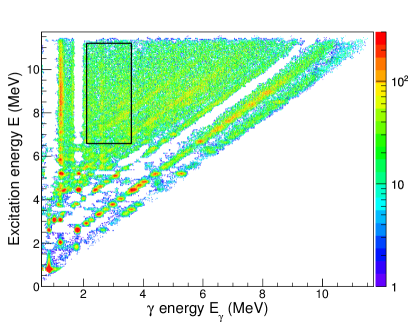
We now turn to the distribution of primary rays as function of excitation energy. The matrix of primary- spectra for 56Fe is displayed in Fig. 3. For decay in the quasi-continuum below the neutron threshold, the SF is dominated by the tail of the GDR. In addition, the Giant Magnetic Dipole Resonance (GMDR), has its maximum at typically MeV RIPL . Thus, the region of high excitation energy (above MeV) is expected to be dominated by dipole transitions.
In the present experiment, the reaction populates a range of initial spins in the quasi-continuum. From the primary transitions we can clearly identify initial spins up to . The angular distributions represent a mix of stretched and non-stretched dipole transitions; if an initial level with spin 4 is populated, it might de-excite with a dipole transition to a final level with spin 3, 4, or 5. Two of these transitions are stretched and one is non-stretched, therefore, one expects that on average 2/3 of the transitions are stretched and 1/3 are non-stretched.
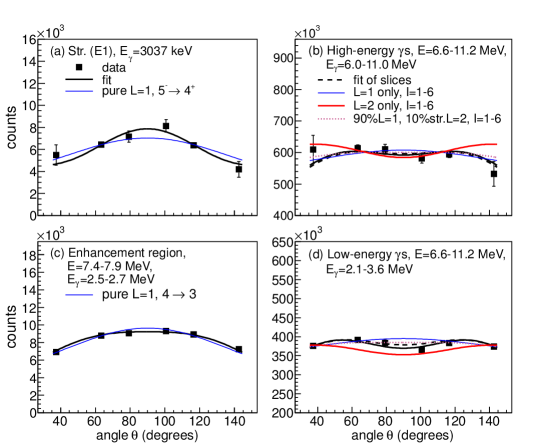
The angular distributions for a non-stretched and a stretched transition in 56Fe are shown in Fig. 2 (e) and (f), while in Fig. 4 (a) a stretched () transition is displayed. The angular distribution of high-energy rays for MeV is shown in Fig. 4 (b), and for a narrow gate in the region of the upbend in Fig. 4 (c), with a shape consistent with a stretched dipole (the exact initial and final spin is unknown). A theoretical distribution assuming a transition is shown, using values of , mateosian1974 , to be compared with the values from the fit, , . The angular distribution for the whole low-energy region (the box in Fig. 3) is displayed in Fig. 4 (d), clearly resembling the high-energy part.
To determine the angular-distribution coefficients for the high-energy rays and in the region of the upbend, we have performed independent fits of Eq. (2) to 720-keV wide excitation-energy slices of the primary matrix. Then, a linear fit was performed for all the extracted angular-distribution coefficients, giving , and , for the low and high-energy rays, respectively (dashed lines in Fig. 4). The coefficients for the two energy regions are compatible within , which indicate that the nature of these rays is very similar. By applying a weight of 2/3 for the stretched and 1/3 for the non-stretched known dipole transitions in 56Fe as given in Tab. 1 (, 1771, 3037 and 3663 keV), the expected coefficients for the quasi-continuum decay are and , further supporting that both the low and high-energy regions are dominated by dipole transitions. Based on these findings, we can exclude that the upbend is due to stretched quadrupole () or octupole () transitions.
We have also considered expected distributions with coefficients mateosian1974 for an initial spin range and final spins for stretched and non-stretched dipole transitions, yielding the distribution shown as a blue line in Fig. 4 (b) and (d). If we assume that there are only quadrupole transtions (stretched and non-stretched, ), the fit is much worse and the data are clearly not reproduced (red lines in Fig. 4 (b) and (d)). The best reproduction of the experimental angular distributions was found with a 90% and 10% weight on the dipole and stretched-quadrupole contribution (). For an increased weight on the quadrupole contribution, or taking non-stretched and quadrupoles into account, the fit was significantly worse. Therefore, we conclude that transitions are of minor importance and that dipole transitions dominate both the region of the upbend and for the high-energy s. Our findings support the assumption applied in Eq. (1).
To summarize, we have presented in this Letter a new measurement on the -strength function of 56Fe. The upbend in the strength, which may have profound consequences for r-process reaction rates, is confirmed with an improved detector setup and response functions, and with a different reaction and beam energy. We have demonstrated that the angular distribution of the low-energy primary rays is consistent with a mixture of stretched and non-stretched dipole transitions, and that quadrupole and octupole transitions are of minor importance. Thus, for the first time, the multipolarity of the upbend has been measured and shown to exhibit predominantly a dipole character.
Acknowledgements.
A. C. L. gratefully acknowledges funding of this research from the Research Council of Norway, project grant no. 205528. M. W. acknowledges support from the National Research Foundation of South Africa. We would like to give special thanks to E. A. Olsen, J. C. Müller, A. Semchenkov, and J. C. Wikne for providing the high-quality beam and excellent experimental conditions.References
- (1) K. Heyde et al., Rev. Mod. Phys. 82, 2365 (2010).
- (2) A. Schiller et al., Phys. Lett. B 633, 225 (2006).
- (3) M. Krtic̆ka et al., Phys. Rev. Lett. 92, 172501 (2004).
- (4) M. N. Harakeh and A. van der Woude, Giant Resonances, Oxford University Press (2001).
- (5) S. Goriely, Phys. Lett. B436, 10 (1998).
- (6) M. Arnould et al., Phys. Rep. 450, 97 (2007).
- (7) A. Voinov et al., Phys. Rev. Lett. 93, 142504 (2004).
- (8) M. Guttormsen et al., Phys. Rev. C 71, 044307 (2005).
- (9) M. Wiedeking et al., Phys. Rev. Lett. 108, 162503 (2012).
- (10) A. C. Larsen and S. Goriely, Phys. Rev. C 82, 014318 (2010).
- (11) A. V. Voinov et al., Phys. Rev. C 81, 024319 (2010).
- (12) E. Litvinova et al., Phys. Rev. C 88, 031302(R) (2013).
- (13) R. Schwengner et al., submitted to Phys. Rev. Letters (2013).
- (14) M. Guttormsen et al., Nucl. Instrum. Methods Phys. Res. A 648, 168 (2011).
- (15) M. Guttormsen et al., Phys. Scr. T 32, 54 (1990).
- (16) A. Giaz et al., Nucl. Instrum. Methods Phys. Res. A 729, 910 (2013).
- (17) R. Nicolini et al., Nucl. Instrum. Methods Phys. Res. A 582, 554 (2007).
- (18) M. Guttormsen et al., Nucl. Instrum. Methods Phys. Res. A 374, 371 (1996).
- (19) M. Guttormsen, T. Ramsøy, and J. Rekstad, Nucl. Instrum. Methods Phys. Res. A 255, 518 (1987).
- (20) A. Schiller et al., Nucl. Instrum. Methods Phys. Res. A 447 498 (2000).
- (21) Data extracted using the NNDC On-Line Data Service from the ENSDF database, August 2013; http://www.nndc.bnl.gov/ensdf/.
- (22) A. V. Voinov et al., Phys. Rev. C 74, 014314 (2006).
- (23) H. K. Vonach and J. R. Huizenga, Phys. Rev. 149, 844(1966).
- (24) T. von Egidy and D. Bucurescu, Phys. Rev. C 80, 054310 (2009).
- (25) R. F. Casten et al., Mat. Fys. Medd. Dan. Vid. Selsk. 38, no. 13 (1972).
- (26) R. A. Alvarez et al., Phys. Rev. C 20, 128 (1979).
- (27) E. der Mateosian and A. W. Sunyar, At. Data and Nucl. Data Tables 13, 391 (1974).
- (28) R. Capote et al., Reference Input Parameter Library, Nucl. Data Sheets 110, 3107 (2009).