Scissors resonance in the quasi-continuum of Th, Pa and U isotopes
Abstract
The -ray strength function in the quasi-continuum has been measured for 231-233Th, 232,233Pa and 237-239U using the Oslo method. All eight nuclei show a pronounced increase in strength at MeV, which is interpreted as the low-energy scissors resonance (SR). The total strength is found to be when integrated over the MeV -energy region. The SR displays a double-hump structure that is theoretically not understood. Our results are compared with data from (, ) experiments and theoretical sum-rule estimates for a nuclear rigid-body moment of inertia.
pacs:
23.20.-g,24.30.Gd,27.90.+bI Introduction
Atomic nuclei in the actinide region are unique from an astrophysics point of view, because they are purely made in rapid neutron-capture processes in explosive stellar environments ar07 . Attempts have been made to use the abundances of 232Th and 235,238U observed in the solar system (measured from meteoritic analyses) to estimate the age of the Galaxy, although these estimates are very uncertain and model-dependent. Thorium has been observed in stars similar to the Sun, and also in older metal-poor stars ar07 .
To predict the abundance of the actinides, one has to know the relevant reaction rates not only for the most long-lived nuclei, e.g. 232Th (14.05 Gy) and 238U (4.468 Gy), but also for the ones with extremely high neutron excess. Therefore, one must rely on calculations to estimate unknown cross sections where experimental data are lacking. This is not only relevant for the astrophysical nucleosynthesis ar07 ; kaeppler2011 , but also for future and existing nuclear reactors chadwick2011 .
Together with optical-model potentials, the nuclear level density and -ray strength function (SF) are crucial inputs for calculating neutron-induced reaction cross sections for neutron energies above the neutron-resonance region. These quantities provide information on the average properties of excited nuclei and are particularly applicable for describing gross features in the quasi-continuum region, where the number of levels is too high to measure individual states and their transitions. To ensure a reliable estimation of unknown cross sections, a detailed knowledge of both the level density and SF is vital.
An enhancement of the SF may boost the decay relative to other decay branches such as particle emission or fission. For the actinides, which have deformed shapes, the low-energy orbital scissors resonance (SR) contributes significantly to the -decay probability.
The first geometrical description of the SR was given by Lo Iudice and Palumbo iudice1978 . Naively, the SR can be viewed as the proton and neutron clouds oscillating against each other like scissor blades. For deformed nuclei, Chen and Leander chen predicted strong transitions between Nilsson orbitals111The single-particle Nilsson orbitals are labeled by , where is the projection of the angular momentum vector on the nuclear symmetry axis. originating from the same spherical state. These predictions were later supported by the observation of an enhancement at MeV in the spectra of the excited 161Dy nucleus gutt84 .
Discrete scissors states built on the ground state can be populated in the (, ) and () reactions. Here, the strength, spin and in some cases the parity of the strongest scissors states in 232Th and 235,236,238U have been determined with typical summed strengths of heil1988 ; margraf1990 ; yevetska2010 ; adekola2011 , where is the nucleon magneton. Because such measurements rely on the identification of single states in an energy region of levels per MeV, it is reasonable to believe that not all the strength has been experimentally resolved.
Recently heyde2011 , a review of several experiments and various models on the SR has been presented. The microscopic description of the SR is based on single-particle couplings between orbitals of the same angular momentum and . These proton and neutron two-quasiparticle configurations contribute in a more or less coherent way. Therefore, the macroscopic picture of oscillating scissors blades is rather oversimplified. Recent quasiparticle random phase approximation (QRPA) calculations heyde2011 ; kuliev2010 are generally in agreement with the observed energies of the scissors states and strengths observed in (, ) and () reactions.
According to the generalized Brink hypothesis brink , the SR is not only built on the nuclear ground state, but on all excited states in the nucleus. The Oslo method, which is based on particle- coincidences, makes it possible to explore the decay of SR states in the quasi-continuum region. The method permits the extraction of both level density and SF in one and the same experiment Schiller00 ; Lars11 . These measurements cover the rather unexplored - and excitation-energy region up to the neutron binding energy (or the threshold for fission). Recently, the level densities of 231-233Th and 237-239U nld2013 and the SFs in 231-233Th and 232,233Pa guttormsen2012 using this method have been reported.
The main purpose of the present work is to make a comprehensive and systematic analysis of several actinides by exploiting nine reactions in total. The previous data of the SFs of 231-233Th and 232,233Pa guttormsen2012 are reanalyzed and new experiments on 237-239U are presented. In addition, the level densities of 232,233Pa are reported for the first time.
The structure of the manuscript is as follows. Section II describes the experimental techniques and methods, and in Sect. III the extraction and normalization of the SFs are discussed. In Sect. IV the SRs are presented and extracted resonance parameters are given. Section V compares the data with previous results and models. Conclusions are drawn in Sect. VI.
II Experiments
The experiments with were performed with the MC-35 Scanditronix cyclotron at the Oslo Cyclotron Laboratory (OCL). The selfsupporting 232Th target (thickness 0.968 mg/cm2) was bombarded with a 12-MeV deuteron and a 24-MeV 3He beam. The 238U target (thickness 0.260 mg/cm2 and enrichment 99.7%) had a carbon backing (thickness 0.043 mg/cm2) and was bombarded with a 15-MeV deuteron beam. Particle- coincidences were measured with the SiRi particle telescope and the CACTUS -detector system siri ; CACTUS .
In order to reduce the intense elastically scattered projectiles on the detectors and exposure of deuteron break-up, the 64 SiRi telescopes were placed in backward direction covering eight angles from to relative to the beam axis. These angles also give a broader and higher spin distribution that are in better agreement with the real spin distribution of the nucleus. The front and back detectors have thicknesses of m and m, respectively. The CACTUS array consists of 28 collimated NaI(Tl) detectors with a total efficiency of % at MeV.
The particle- coincidences with time information were sorted event by event. Gates were set on the 64 E-E matrices to select various particle types. From the known charged-particle type and the kinematics of the reaction, the energies deposited in the telescopes can be translated to initial excitation energy in the residual nucleus. To avoid contamination from rays emitted by the fission fragments, we consider only excitation energies below the fission barrier. For each energy bin , the -spectra are unfolded gutt6 using new NaI-response functions based on several in-beam lines from excited states in 13C, 16,17O, 28Si and 56,57Fe, where the relative detector efficiency as function of energy could be extracted in a reliable way.
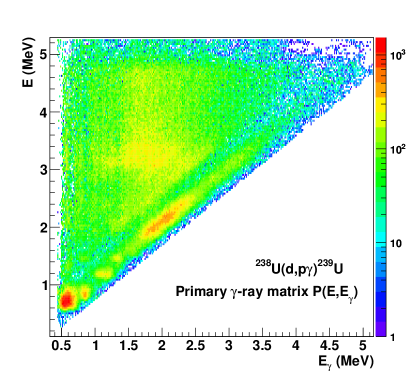
An iterative subtraction technique was applied to separate out the first-generation (primary) transitions from the total cascade Gut87 . The technique is based on the assumption that the distribution is the same whether the levels were populated directly by the nuclear reaction or by decay from higher-lying states. This assumption is necessarily fulfilled when states have the same relative probability to be populated by the two processes, since -branching ratios are properties of the levels themselves. If the excitation bins contain many levels, as is the case for the actinides, it is likely to find the same distribution independent of the method of population. Figure 1 shows the final first-generation -ray matrix for the 238U()239U stripping reaction.
Fermi’s golden rule predicts that the decay probability may be factorized into a transition matrix element between the initial and final states, and the density of final states dirac ; fermi . Furthermore, according to the Brink hypothesis brink , the -ray transmission coefficient is approximately independent of excitation energy. The first-generation matrix , which expresses the probability to emit a -ray with energy from excitation energy , may therefore be factorized as follows:
| (1) |
where is the level density at the excitation energy after the first -ray has been emitted in the cascades. This factorization allows a simultaneous extraction of level density and -ray transmission coefficient since the number of data points of the matrix exceeds by far the number of unknown data points of the vectors and . The least-square fit of to (see Eq. (1)) determines only the functional form of and . If one solution of the functions and is known, one may construct identical fits to the matrix by
| (2) | |||||
| (3) |
The transformation parameters , and can then be estimated.
| Reaction and | |||||||
| final nucleus | (MeV) | (eV) | (106MeV-1) | (106MeV-1) | (meV) | (meV) | |
| (3He,) Th | 5.118 | 7.78 | 9.6(15) | 12.7(33) | 12.7 | 26(2) | 26 |
| (, ’) Th | 6.438 | 8.05 | 0.78(20)a | 30(8)a | 20 | 30(10)a | 40 |
| (3He,3He’) Th | 6.438 | 8.05 | 0.78(20)a | 30(8)a | 30 | 30(10)a | 40 |
| (, ) Th | 4.786 | 7.81 | 16.5(4) | 7.4(15) | 4.0 | 24(2) | 20 |
| (3He, ) Pa | 5.549 | 8.19 | 0.51(3) | 68(13) | 68 | 40(1) | 35 |
| (3He, ) Pa | 6.529 | 8.82 | 0.42(8) | 77(21) | 77 | 30(10)a | 45 |
| (, ) U | 5.126 | 8.02 | 14.0(10) | 9.3(19) | 7.4 | 23(2) | 26 |
| (, ’) U | 6.154 | 8.26 | 3.5(8) | 20(6) | 20 | 30(10)a | 55 |
| (, ) U | 4.806 | 7.84 | 20.3(6) | 6.1(12) | 2.45 | 23.6(8) | 33 |
a) Estimated from systematics RIPL3 .
| Isotopes | |||||||||||||
|---|---|---|---|---|---|---|---|---|---|---|---|---|---|
| (MeV) | (mb) | (MeV) | (MeV) | (mb) | (MeV) | (MeV) | (MeV) | (mb) | (MeV) | (MeV) | (mb) | (MeV) | |
| 231-233Th | 11.5 | 374 | 4.2 | 14.4 | 840 | 4.2 | 0.2 | 7.2 | 10 | 2.0 | 6.67 | 4.36 | 4.0 |
| 232,233Pa | 11.5 | 473 | 4.2 | 14.4 | 900 | 4.2 | 0.2 | 7.3 | 13 | 2.0 | 6.61 | 5.46 | 4.0 |
| 237-239U | 11.4 | 572 | 4.2 | 14.4 | 1040 | 4.2 | 0.2 | 7.3 | 15 | 2.0 | 6.61 | 7.00 | 4.0 |
The level density function needs two normalization points to deduce and of Eqs. (2) and (3). These points are determined at low excitation energy from the known level scheme ENSDF , and at high energy from the density of neutron resonances following (, ) capture at the neutron separation energy . Here, the data point is calculated from neutron resonance spacings taken from RIPL-3 RIPL3 assuming the following spin distribution GC
| (4) |
The spin-cutoff parameter at the neutron separation energy was estimated by use of the systematics of Ref. egidy2 . The values of , , and are listed in Table I. Further details on the normalization procedure are described in Refs. Schiller00 ; voin1 .
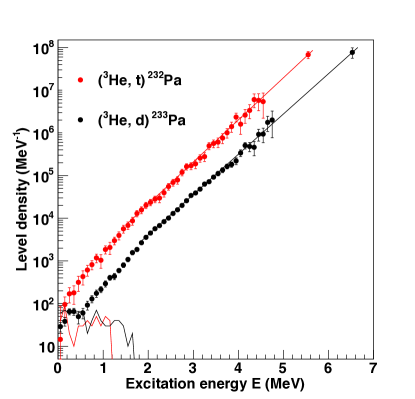
Recently nld2013 , the level densities of 231-233Th and 237-239U were reported. For the sake of completeness and to demonstrate the normalization procedure, we show in Fig. 2 the level densities for 232,233Pa. The figure demonstrates how the level density is normalized to the anchor points at low and high excitation energies. It is interesting to see that only a small fraction of the levels have been observed in these isotopes, e.g. at MeV only 10% of all levels are known. Above MeV the level density follows the constant-temperature level density formula GC , in accordance with the findings for the other actinides. Since details on the level densities and thermodynamics have been presented recently nld2013 , we will only focus on the SF and the appearance of the SR in the following.
III Normalization of the -ray strength function
The actinides have a rapidly increasing level density with excitation energy due to a high density of single-particle orbitals. Furthermore, the presence of a low pairing gap and high- orbitals surrounding the Fermi level produce a broad spin distribution at high excitation energy. The light-ion reactions used in this work may not populate the highest spins present in the nucleus, which in turn could influence the shape of the observed primary spectra . Since the transmission coefficient is assumed to be independent of spin, the observed matrix should be fitted with the product , where the reduced level density is extracted by a lower value of at . Since there are uncertainties in the total through the estimate of and also the actual spin distribution brought into the nuclear system by the specific reaction, the extracted slope of (the parameter) becomes rather uncertain.
The parameter controls the scaling of the transmission coefficient . Here we use the average, total radiative width at assuming that the -decay is dominated by dipole transitions. For initial spin and parity , the width is given by voin1
| (5) | |||||
where the summation and integration run over all final levels with spin that are accessible by or transitions with energy . However, the determination of becomes also rather uncertain because the integral of Eq. (5) depends on the functions of level density and spin-cutoff parameter .
The above complications encountered for the actinides make the standard normalization procedure of the Oslo method rather difficult to perform. The and parameters have large uncertainties, and only the parameter can be determined with a reasonable precision. Therefore, another procedure is adopted in this work where we compare the SF with the extrapolation of known data from photo-nuclear reactions.
The SF for dipole radiation can be calculated from the transmission coefficient by RIPL3
| (6) |
These data are compared with the strength function derived from the cross section of photo-nuclear reactions by RIPL3
| (7) |
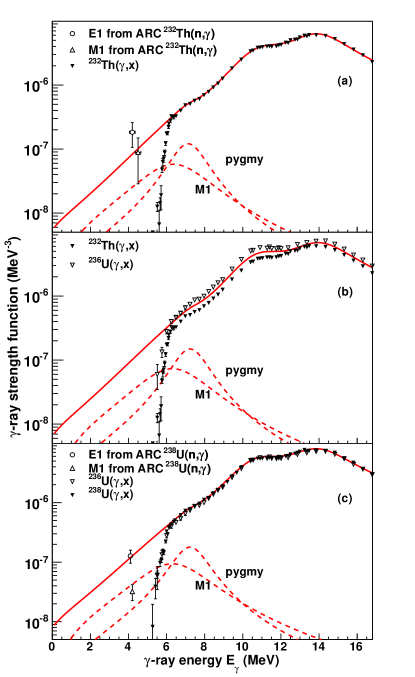
In Fig. 3 the SF derived from (, x) cross sections on 232Th and 236,238U by Caldwell et al. caldwell1980 are shown. Naturally, the data are seen to drop off when . Furthermore, we observe that the SF does not vary much with neutron number, as seen for 236,238U in panel (c). However, a comparison between 232Th and 236U in panel (b) reveals that the SF increases when the proton number goes from to 92. Thus, we assume that the SFs from 232Th and 238U can be applied for 231-233Th and 237-239U, respectively. For 232,233Pa with , we use the average values of 232Th () and 236U ().
Since our data cover energies below , we have to extrapolate the (, x) data to lower energies using reasonable functions. For the double-humped giant electric dipole resonance (GEDR) we fit the data with two enhanced generalized Lorentzians (EGLO) as defined in RIPL RIPL3 , but with a constant temperature of the final states . The (, x) data caldwell1980 also reveal a resonance-like bump at around 7.3 MeV (labeled pygmy in Fig. 3). This unknown resonance222We will not speculate here about the origin of this resonance. together with the spin-flip resonance (labelled M1 in Fig. 3) recommended by RIPL, are included in the strength as standard Lorentzian shapes. The various resonance parameters which define the solid red line shown in Fig. 3, are included in Table 2. For comparison we also include in the figure the and strengths derived from () average resonance capture data (ARC) from Ref. ko90 .
Provided that the extrapolations in Fig. 3 (red solid lines) are reliable, we may assume that this SF represents the ”base line” with no additional strength from other resonances. Thus, we normalize the measured SF to this underlying background as demonstrated in Fig. 4. Here, the parameter is adjusted to obtain the right slope of the observed SF, and is tuned to scale the data to the underlying background. To see the deviations from a standard normalization procedure, we also calculate the parameter values necessary to obtain the given fit to the SF background.
The adopted values for the level density and width are shown in Table 1. In the case of the , reaction it seems that about half of the spin distribution at high excitation energy is covered by the reaction. We also observe that the adopted values deviate from the measured values. The exact reason is difficult to pin down since the normalization integral of Eq. (5) depends on how the spin-cutoff parameter, level density and transmission coefficient vary in the whole energy region up to . The observed deviations may also be due to the fact that the high excitation-energy part was in some cases poorly populated as e.g. for 232Th. Then the evaluation of Eq. (5) depends strongly on proper extrapolations of and in the unknown energy regions.
IV The scissors resonance
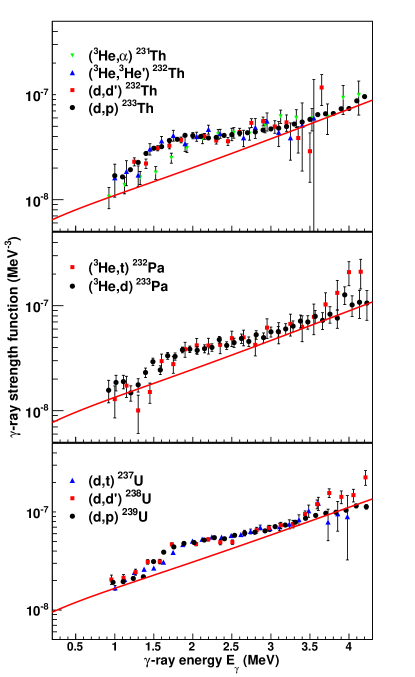
In Figs. 5-7 we have subtracted the assumed background line of Fig. 4 for the thorium, protactinium and uranium isotopes. We observe a clear overshoot of strength in the MeV region, which is analyzed in the following. The present SR distributions differ from the ones previously measured guttormsen2012 . The main reason is that the (, x) data of Gurevich et al. gurevich have been replaced by the newer and more precise data of Caldwell et al. caldwell1980 , which gives more reliable extrapolations, as shown in Fig. 3. Furthermore, the new NaI-response functions have slightly changed the SR -energy distributions.
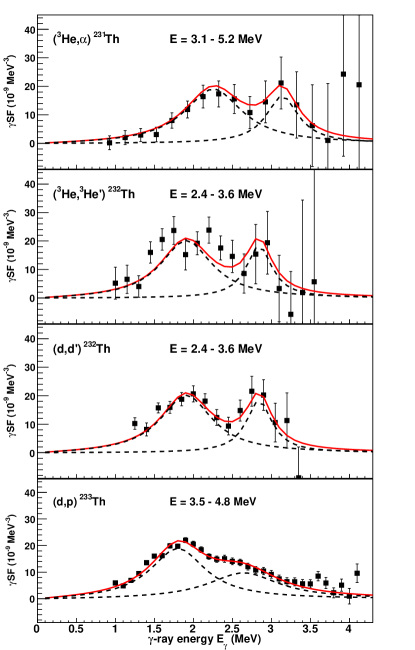
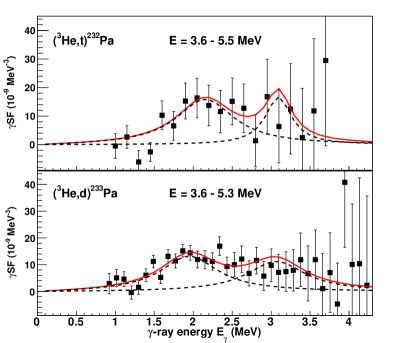
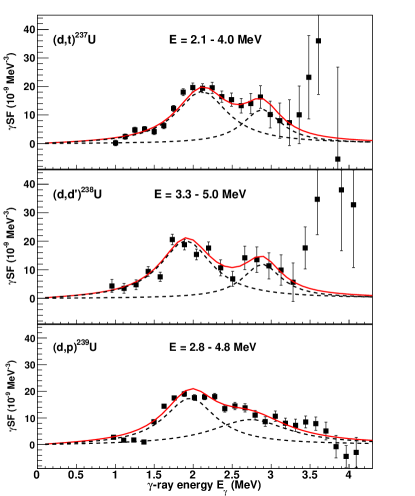
Some of the experimental SFs are hampered by poor statistics, in particular for the 232,233Pa isotopes. However, it appears that the additional strength of the investigated isotopes can be decomposed into two Lorentzians. The resonance centroid (), cross section () and width () are listed in Table 3 for the lower () and upper () resonances. From the resonance parameters, the integrated strengths of the two components can be calculated by
| (8) |
Furthermore, the total strength and the average centroid are expressed by:
| (9) | |||||
| (10) |
In Table 3 the upper and lower scissors strength (), together with the average centroid () and total strength () are also listed.
Previous measurements for the SR built on the ground state heil1988 ; margraf1990 ; yevetska2010 reveal centroids around MeV of excitation energy, which corresponds to the first resonance in our SF. Table 3 shows that, on average, the first resonance is centered around MeV with a strength of . Several of the mentioned studies show that levels in the MeV region have spin/parity , which strongly support the interpretation as the scissors resonance. To our knowledge, the SR is the only known candidate for a soft resonance mode at these low energies.
Our data show a second component located on average MeV higher than the lower resonance and with a strength of . This component was not reported in the earlier experiments heil1988 ; margraf1990 ; yevetska2010 . However, in a recent work adekola2011 from the High-Intensity -ray Source (HIS) facility at the Triangle Universities Nuclear Laboratory (TUNL) a concentration of states was found at MeV in 232Th. These data will be compared with the present results in the next section.
| Nuclide | Deformation | Lower resonance | Upper resonance | Total | Sum rule | ||||||||
|---|---|---|---|---|---|---|---|---|---|---|---|---|---|
| AX | |||||||||||||
| (MeV) | (mb) | (MeV) | () | (MeV) | (mb) | (MeV) | () | (MeV) | () | (MeV) | () | ||
| 231Th | 0.24 | 2.30(15) | 0.50(5) | 0.90(10) | 6.9(11) | 3.15(15) | 0.60(20) | 0.50(10) | 3.4(13) | 2.58(15) | 10.3(17) | 2.0 | 8.6 |
| 232Th | 0.24 | 1.95(15) | 0.45(10) | 0.80(20) | 6.5(22) | 2.85(10) | 0.60(20) | 0.40(10) | 3.0(12) | 2.23(14) | 9.5(26) | 2.0 | 8.6 |
| 233Th | 0.24 | 1.85(10) | 0.40(5) | 0.85(10) | 6.5(12) | 2.70(20) | 0.30(5) | 1.10(20) | 4.3(11) | 2.19(15) | 10.8(16) | 2.0 | 8.5 |
| 232Pa | 0.24 | 2.20(20) | 0.40(20) | 0.90(20) | 5.8(32) | 3.10(30) | 0.60(40) | 0.40(20) | 2.7(23) | 2.49(24) | 8.5(39) | 2.0 | 8.7 |
| 233Pa | 0.25 | 2.00(20) | 0.30(20) | 0.90(30) | 4.8(36) | 3.10(30) | 0.40(30) | 0.90(30) | 4.1(34) | 2.51(25) | 8.9(49) | 2.0 | 9.0 |
| 237U | 0.26 | 2.15(10) | 0.45(5) | 0.80(10) | 5.9(10) | 2.90(20) | 0.40(10) | 0.60(15) | 2.9(11) | 2.40(14) | 8.8(15) | 2.1 | 9.5 |
| 238U | 0.27 | 1.95(15) | 0.45(5) | 0.80(10) | 6.5(12) | 2.90(15) | 0.40(10) | 0.60(15) | 2.9(10) | 2.24(15) | 9.4(16) | 2.2 | 9.8 |
| 239U | 0.25 | 2.00(15) | 0.30(5) | 0.80(10) | 4.2(10) | 2.80(15) | 0.30(5) | 1.20(20) | 4.5(11) | 2.41(15) | 8.8(14) | 2.0 | 9.1 |
V Comparison with other data and models
V.1 Other data
When comparing data and model predictions for the SR built on the ground state, it is common to quote the average excitation energy and the summed strength. For measuring of the SR built on the ground state, (, ) and () reactions have been frequently used. In the past, the experimental values obtained from these reactions were rather uncertain because many weak-intensity (or ) lines were difficult to detect due to high backgrounds. In addition, there were also limitations on the excitation energies covered by the experiments. An indication of missing strength comes from the odd-mass deformed rare-earth nuclei, which display only half of the summed strength () compared to their even-even neighbors (), which is rather surprising from a theoretical point of view. The strength is fragmented into several weak and unresolved lines in the spectra due to 5-10 times higher level density in odd-mass nuclei. An example is 163Dy where new and more sensitive experiments by Nord et al. nord03 in 2003 revealed twice the strength originally observed in 1993 by Bauske et al. bauske93 .
For the actinides, the second concentration of SR states at excitation energies MeV was first observed in 2011 at the HIS facility adekola2011 . Prior to this study, the second high-energy component was observed neither in 232Th nor in 235,236,238U heil1988 ; margraf1990 ; yevetska2010 . The HIS experiment on 232Th not only pushed the previous heil1988 summed strength of 2.6(3) up to 4.3(6) , but also revealed a two-component structure that may bring new insight to the SR mechanism.
Even though the (, ) method is based on discrete population of states built on the ground state, a comparison with the present results from decay in the quasi-continuum can be made. However, one should keep in mind that these experiments represent two different systems with respect to the nuclear moment of inertia, as described in the following.
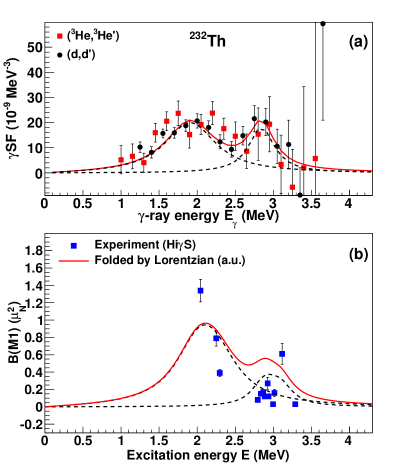
Figure 8 shows the SF from the Oslo method (panel (a)) in 232Th compared with the states measured at the HIS facility (panel (b)) adekola2011 . One should note that the abscissa and ordinate of these plots are different. The HIS data are presented as discrete values for each state observed with s of multipolarity. According to the Brink hypothesis brink , these excitations should also be built on excited states in the continuum. In order to compare with the Oslo data, we have folded the HIS data using two Lorentzians with widths of and 0.35 MeV for states below and above excitation energy MeV, respectively. These widths are chosen somewhat smaller than the widths extracted from the Oslo data in Table 3 since the spread in the energy positions of the states also contributes to the width. We see from Fig. 8 (b) that the two resonance peaks are located keV higher than for the Oslo data. The total strength measured by the HIS group adekola2011 is versus the higher value of in the present study.
These results are not necessarily representing a controversy. Similar deviations have been found for the scissors strength in the deformed rare earth region where (, ) experiments heyde2011 typically yield strengths of . Various measurements of the -decay between levels in the quasi-continuum show significant higher SR strength. Here, the two-step cascade method and the Oslo method give integrated strengths of milan2004 ; schi2006 . One could speculate if the lower strength in (, ) experiments is due to missing states caused by low intensities relative to the background or because of limited excitation-energy regions. However, the deviation may also be due to the fact that the scissors strength depends on the moment of inertia that takes different values for the ground state and the levels in the quasi-continuum.
From theoretical considerations described in the next section, the strength of the SR should be proportional to the moment of inertia, which may take a lower and upper limit. In principle, for the SR built on the ground state, the ground-state moment of inertia should be applied. This quantity is easily extracted from the first rotational state in even-even deformed nuclei by
| (11) |
For the SR in the quasi-continuum, the rigid-body moment of inertia should be used:
| (12) |
with fm and is the nuclear quadrupole deformation333In this work, we use the quadrupole deformation parameter , which relates to the deformation parameters and ; to lowest order . taken from goriely2009 .
In the case of 232Th, we have MeV giving the lower limit MeV-1, while the rigid value becomes MeV-1, which represents the upper limit. It is interesting that the ratio is in agreement with the ratio for 232Th. A similar scaling is valid also for the well-deformed rare-earth region. These observations may call for a consistent model that is capable of describing the SR states built on the ground state as well as the SR distribution in the quasi-continuum.
V.2 Models
Numerous SR models have been launched to explain the results of the (, ) and () reactions heyde2011 . The predictions for deformed rare-earth nuclei were often guided by the measured values found at the time when the models were published. Quasiparticle Random Phase Approximation (QRPA) models are rather popular, although these also have some freedom for tuning the results to experimental data. A common definition nojarov93 of an SR state is when the orbit-to-spin ratio is . In the work of Kuliev et al. kuliev10 , QRPA calculations were performed for the MeV excitation region. Their calculations for 232Th and 236,238U give typical strengths of at the average excitations energy of MeV. With a moment of inertia ratio of these predictions are in agreement with the present findings.
It is interesting to investigate the most important single-particle orbitals responsible for the SR in the QRPA calculations kuliev10 . The various SR states are composed of several pairs of Nilsson orbitals, having . The most pronounced pairs of the strongest SR states at low excitation in 232Th and 238U are and , respectively. The strongest and higher-lying SR states of 232Th, are calculated to have excitation energies of 2.998 and 3.134 MeV. Their wave-functions are dominated by kuliev2013 the and configurations, respectively. The mechanism behind the splitting of the strength into two energy regions is not clear, other than the distance of the Nilsson orbitals to the Fermi surface has some relevance. The strong admixture of many two-quasiparticle orbitals in the SR states indicates that these excitations are rooted in collective motion.
In this work we have chosen the sum-rule approach lipparini1989 , which is a rather fundamental way of predicting both and . The drawback is that only these two gross properties are given. This approach requires that the strength is located at one specific excitation energy, and is not able to explain why the SR distribution splits into two components.
We follow the description of Enders et al. enders2005 with the exception that the ground-state moment of inertia will be replaced by the rigid-body moment of inertia. The inversely and linearly energy-weighted sum rules are given by
| (13) | |||||
| (14) |
For the factors444Bare gyromagnetic factors are and . we use the common expression , which rests on the assumption that the neutron and rotational gyromagnetic factors are and , respectively BM75 . Since the SR is measured in the quasi-continuum, the isovector moment of inertia is taken as the rigid-body moment of inertia as discussed above.
According to Enders et al. enders2005 the component of the isovector giant quadrupole resonance (IVGQR) will dominate and has to be removed using a reduction factor
| (15) |
that depends on the energy centroids of the isovector giant dipole (IVGDR) and isoscalar giant quadrupole (ISGQR) resonances:
| (16) | |||||
| (17) |
In the mass region investigated here, is rather independent on (and ) and takes the value . The adequate expression of for the low-lying scissors mode then reads:
| (18) |
where .
The two sum rules can now be utilized to extract the SR centroid and strength:
| (19) | |||||
| (20) | |||||
It is interesting to note that does not depend on . Thus, if the experimental is known, a less rigorous relation for the strength is:
| (21) | |||||
which replaces the centroid from the sum rule with the experimental value. However, this was not necessary in the present work since both the centroid and strength are well described by the sum rules.
The total SR strength and weighted centroid for the eight nuclei of Figs. 5-7 are summarized in Table 3. The two last columns of Table 3 show the predicted sum-rule estimates. Both the and values are in good agreement with our measurements. Although depends very weakly on , the follows a dependence, see Eq. (19). However, since the strength follows , contrary to the strong dependence for SR states built on the ground state ziegler1990 ; neumann1995 . Unfortunately, our data do not allow us to conclude any systematic behavior regarding or ; all eight nuclei display the same resonance parameters within the experimental errors.
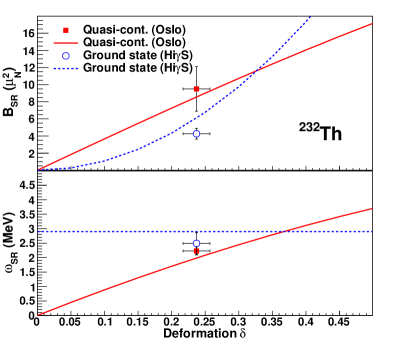
In Fig. 9 we have plotted the sum-rule estimates for 232Th and compared to the experimental values. With the assumption of a rigid-body moment of inertia in the quasi-continuum, the Oslo data are very well reproduced at a deformation of . For illustration, it is interesting to show the sum-rule estimates for different deformations, still assuming the 232Th system. The sum rule predicts that the centroid as well as the strength will decrease linearly with as one approaches more spherical nuclei. For the HIS data the strength and centroid are overestimated by the sum-rule approach using ground-state moment of inertia. In this case, one cannot calculate the dependence directly from the sum rule as the energy is unknown for deformations differing from the deformation of 232Th with . However, it is well known that the average centroid is approximately constant and the strength follows a rule enders2005 . These dependencies are indicated as dashed blue lines in Fig. 9. It would be very interesting to follow the SR in the quasi-continuum to lower deformations to see if the strength and centroid decrease as expected.
Over the last 30 years many theoretical works have been published for the SR built on the ground state heyde2011 . However, the centroid and strength of the SR in the quasi-continuum is the quantity that directly relates to the reaction rates in e.g. astrophysical environments. For example for the r-process, which involves nuclei with extreme ratios, the decrease in neutron-separation energy with neutron number is expected to give an increasing impact from the SR on the reaction rates. The SR represents also an important ingredient for the simulations of fuel cycles for fast nuclear-power reactors. Sensitivity and uncertainty studies aliberti2006 ; aliberti2004 for reactors included in the Generation IV (Gen IV) initiative and Accelerator Driven Systems (ADS) show that the cross sections involved must be known with high precision. Thus, there is a great need for new theoretical and experimental investigations of the summed SR strength, its dependence on the deformation, and the origin of the two-component structure seen here in the quasi-continuum of the actinides.
VI Conclusions
The level densities of 232-233Pa and the SFs of 231-233Th, 232,233Pa and 237-239U have been determined using the Oslo method. The level densities show a constant-temperature behavior as recently reported for 231-233Th and 237-239U.
All the eight actinides investigated show an excess in the SFs in the MeV region, which is interpreted as the scissors resonance in the quasi-continuum. The underlying strength has been subtracted by extrapolating the assumed strength from the tails of other resonances; the double humped GEDR, the spin-flip GMDR and an unknown pygmy resonance.
The sum-rule applied to the quasi-continuum gives a satisfactory description of the SR for all isotopes studied. The approach predicts that and are proportional to the deformation parameter . This is in contrast with the behavior of the SR built on the ground state. Furthermore, the SR shows a splitting into two components, which is in accordance with data from the HIS facility. However, there are currently no firm theoretical explanations of the two-component structure seen in the present study. Theoretical and experimental studies of the SR in the quasi-continuum are called for to obtain reliable reaction rate predictions used in nuclear-astrophysics and reactor applications.
Acknowledgements.
We would like to thank J.C. Müller, E.A. Olsen, A. Semchenkov and J. Wikne at the Oslo Cyclotron Laboratory for providing the stable and high-quality deuterium and 3He beams during the experiment, the Lawrence Livermore National Laboratory for providing the 232Th target and the GSI Target Laboratory for the production of the 238U target. We thank A.A. Kuliev, E. Guliyev and F. Ertugral for sharing details of their QRPA calculations. This work was supported by the Research Council of Norway (NFR), the French national research programme GEDEPEON, the US Department of Energy under Contract No. DE-AC52-07NA27344, the National Research Foundation of South Africa, the European Commission within the 7th Framework Programme through Fission-2010-ERINDA (Project No. 269499) and by the European Atomic Energy Community s 7th Framework Programme under grant agreement no. FP7-249671 (ANDES).References
- (1) M. Arnould, S. Goriely, and K. Takahashi, Phys. Rep. 450, 97 (2007).
- (2) F. Käppeler et al., Rev. of Mod. Phys. 83, 157 (2011).
- (3) M.B. Chadwick et al., Nucl. Data Sheets 112, 2887 (2011).
- (4) N. Lo Iudice and F. Palumbo, Phys. Rev. Lett. 41, 1532 (1978).
- (5) Y.S. Chen and G.A. Leander, Phys. Rev. C 26, 2607 (1982).
- (6) M. Guttormsen, J. Rekstad, A. Henriquez, F. Ingebretsen, and T.F. Thorsteinsen, Phys. Rev. Lett. 52, 102 (1984).
- (7) R.D. Heil, H.H. Pitz, U.E.P. Berg, U. Kneissl, K.D. Hummel, G. Kilgus, D. Bohle, A. Richter, C. Wesselborg, P. von Brentano, Nucl. Phys. A 476, 39 (1988).
- (8) J. Margraf, A. Degener, H. Friedrichs, R.D. Heil, A. Jung, U. Kneissl, S. Lindenstruth, H.H. Pitz, H. Schacht, U. Seemann, R. Stock, C. Wesselborg, P. von Brentano, A. Zilges, Phys. Rev. C 42, 771 (1990).
- (9) O. Yevetska, J. Enders, M. Fritzsche, P. von Neumann-Cosel, S. Oberstedt, A. Richter, C. Romig, D. Savran, K. Sonnabend, Phys. Rev. C 81, 044309 (2010).
- (10) A.S. Adekola, C.T. Angell, S.L. Hammond, A. Hill, C.R. Howell, H.J. Karwowski, J.H. Kelley, and E. Kwan, Phys. Rev. C 83, 034615 (2011).
- (11) K. Heyde, P. von Neumann-Cosel, A. Richter, Rev. Mod. Phys. 82, 2365 (2010), and references therein.
- (12) A.A. Kuliev, E. Guliyev, F. Ertugral, and S. Özkan, Eur. Phys. J. A 43, 313 (2010).
- (13) D.M. Brink, Ph.D. thesis, Oxford University, 1955.
- (14) A. Schiller et al., Instrum. Methods Phys. Res. A 447, 498 (2000).
- (15) A.C. Larsen et al., Phys. Rev. C 83, 034315 (2011).
- (16) M. Guttormsen et al., Phys. Rev. C 88, 024307 (2013).
- (17) M. Guttormsen, L.A. Bernstein, A. Bürger, A. Görgen, F. Gunsing, T.W. Hagen, A.C. Larsen, T. Renstrøm, S. Siem, M. Wiedeking, and J.N. Wilson, Phys. Rev. Lett. 109, 162503 (2012).
- (18) M. Guttormsen, A. Bürger, T.E. Hansen, and N. Lietaer, Nucl. Instrum. Methods Phys. Res. A 648, 168 (2011).
- (19) M. Guttormsen et al., Phys. Scr. T 32, 54 (1990).
- (20) M. Guttormsen, T. S. Tveter, L. Bergholt, F. Ingebretsen, and J. Rekstad, Nucl. Instrum. Methods Phys. Res. A 374, 371 (1996).
- (21) M. Guttormsen, T. Ramsøy, and J. Rekstad, Nucl. Instrum. Methods Phys. Res. A 255, 518 (1987).
- (22) P.A.M. Dirac, ”The Quantum Theory of Emission and Absortion of Radiation”. Proc. R. Soc. Lond. A 1927 114, 243-265.
- (23) E. Fermi, Nuclear Physics. University of Chicago Press (1950).
- (24) Data extracted using the NNDC On-Line Data Service from the ENSDF database.
- (25) R. Capote et al., Reference Input Library, RIPL-2 and RIPL-3, available online at http://www-nds.iaea.org/RIPL-3/
- (26) A. Gilbert and A.G.W. Cameron, Can. J. Phys. 43, 1446 (1965).
- (27) T. von Egidy and D. Bucurescu, Phys. Rev. C 72, 044311 (2005); Phys. Rev. C 73, 049901(E) (2006).
- (28) A. Voinov, M. Guttormsen, E. Melby, J. Rekstad, A. Schiller, and S. Siem, Phys. Rev. C 63, 044313 (2001).
- (29) J. Kopecky and M. Uhl, Phys. Rev. C 41 1941 (1990).
- (30) J.T. Caldwell, E.J. Dowdy, B.L. Berman, R.A. Alvarez and P. Meyer, Phys. Rev. C 21, 1215 (1980); available at http://cdfe.sinp.msu.ru/services/unifsys/index.html.
- (31) G.M. Gurevich et al., Zhurnal Eksper. i Teoret. Fiz., Pisma v Redakt. 20, 741 (1974).
- (32) M. Krtic̆ka et al., Phys. Rev. Lett. 92, 172501 (2004).
- (33) A. Schiller et al., Phys. Lett. B633, 225 (2006).
- (34) A. Nord et al., Phys. Rev. C 67, 034307 (2003).
- (35) I. Bauske et al., Phys. Rev. Lett. 71, 975 (1993).
- (36) S. Goriely, N. Chamel and J.M. Pearson, Phys. Rev. Lett. 102, 152503 (2009).
- (37) R. Nojarov et al., Nucl. Phys. A 563, 349 (1993).
- (38) A.A. Kuliev, E. Guliyev, F. Ertugral and S. Özkan, Eur. Phys. J. A 43, 313 (2010).
- (39) A.A. Kuliev, E. Guliyev, and F. Ertugral, private communication (2013).
- (40) E. Lipparini and S. Stringari, Phys. Rep. 175, 103 (1989).
- (41) J. Enders, P. von Neumann-Cosel, C. Rangacharyulu, and A. Richter, Phys. Rev. C 71, 014306 (2005).
- (42) A. Bohr and B. Mottelson, Nuclear Structure (Benjamin, New York), Vol. 2 (1975).
- (43) W. Ziegler, C. Rangacharyulu, A. Richter, and C. Spieler, Phys. Rev. Lett. 65, 2515 (1990).
- (44) P. von Neumann-Cosel, J.N. Ginocchio, H. Bauer and A. Richter, Phys. Rev. Lett. 75, 4178 (1995).
- (45) G. Aliberti, G. Palmiotti, M. Salvatores, T.K. Kim, T.A. Taiwo, M. Anitescu, I. Kodeli, E. Sartori, J.C. Bosq, and J. Tommasi, Annals of Nuclear Energy 33, 700 (2006).
- (46) G. Aliberti, G. Palmiotti, M. Salvatores, and C.G. Stenberg, Nuclear Science and Engineering, 146, 13 (2004).