Dynamics of indirect exciton transport by moving acoustic fields
Abstract
We report on the modulation of indirect excitons (IXs) as well as their transport by moving periodic potentials produced by surface acoustic waves (SAWs). The potential modulation induced by the SAW strain modifies both the band gap and the electrostatic field in the quantum wells confining the IX, leading to changes in their energy. In addition, this potential capture and transports IXs over several hundreds of m. While the IX packets keep to a great extent their spatial shape during transport by the moving potential, the effective transport velocity is lower than the SAW group velocity and increases with the SAW amplitude. This behavior is attributed to the capture of IXs by traps along the transport path, thereby increasing the IX transit time. The experimental results are well-reproduced by an analytical model for the interaction between trapping centers and IXs during transport.
1 Introduction
The strong interaction with photons makes exciton ideal particles for the processing of optical information using solid-state devices. [1] To reach this goal, functionalities like storage, transport, and manipulation of excitons become mandatory. Spatially indirect (or dipolar) excitons (IXs) are particularly suitable for these applications due to their long lifetime and energy tunability. An IX is a bound state of an electron and a hole localized in an undoped double quantum well (DQW) structure separated by a thin (i.e., less than the exciton Bohr radius) barrier. As illustrated in Figs. 1(a) and 1(b), IXs are formed by applying an electric field across the DQWs to drive the electron and hole constituents into different quantum wells (QWs), while still maintaining the Coulomb correlation between the particles. controls, via the quantum confined Stark effect (QCSE), both the energy and the lifetime of the IXs, the latter of which can reach several hundreds of s. [2] These long lifetimes open the way for information storage as well as for the creation of cold bosonic gases for study of coherent exciton phases [3, 4, 5].
The oriented IX electric dipoles give rise to strong repulsive IX-IX interactions.[6] The non-linearity associated with these interactions has been explored for the realization of IX gates [6, 7] and exciton transistors [8]. The combination of non-linearity with tight lateral confinement using electrostatic gates has recently been explored for the isolation of single IX states.[9] Also, the electric dipole provides a tool for the manipulation of IXs using electric field gradients. Examples of electrically driven device functionalities include exciton storage cells, switches, and transistors [10, 8, 11].
Long IX lifetimes also enables the long-range transport of IX packets, which opens the way for the coupling of remote IX systems. Different approaches have also been introduced to transport of IXs based on bare diffusion,[12] drift induced by repulsive IX-IX interactions,[3] or by using spatially varying electric fields, including electrostatic ramps [13] as well as moving electrostatic lattices. [14] Recently, we have shown that IXs can be efficiently transported by the moving (and tunable) type-I band gap modulation () produced by the strain of a surface acoustic wave [SAW, cf. Fig. 1(c)]. [15] During the SAW-induced transport, the long-living IXs are captured in regions of minimum band gap, which move with the well-defined SAW velocity. The transport of IX packets with a constant velocity becomes interesting since it allows synchronization with control gates, optical sources, and detectors.[10]
The band structure modulation as well as the long-range acoustic transport of electrons and holes by piezoelectric SAWs are well documented in the literature.[16, 17, 18, 19] In this case, the interaction between the SAW and carriers is primarily mediated by the SAW piezoelectric field, which creates a moving type-II modulation of the conduction (CB) and valence band (CB) edges. This type of modulation separates electrons and holes and leads to exciton dissociation. The acoustic manipulation of excitons rather requires a type-I band gap modulation, which can be produced by the strain of a non-piezoelectric SAW.[15] While the piezoelectric modulation amplitudes can reach several tens of meV, the type I modulations is limited to a few meV. Due to the very different amplitudes, the two types of modulations lead to different transport regimes. Investigations of the IX dynamics under non-piezoelectric SAWs have so far only been carried out in the quasi-static regime, i.e., for time scales much longer than the acoustic period.
In this work, we report on the modulation of the energy levels as well as on the transport of IX packets in (Al,Ga)As quantum well structures by non-piezoelectric SAWs. The studies were carried out using spatially and time-resolved photoluminescence (PL) spectroscopy to probe the energetics as well as the evolution of IX packets in space and time with resolutions in the m and ns ranges, respectively. We show that the application of a SAW induces shifts in the IX energies with very different time scales. The first are the oscillating changes in band gap caused by the strain field, which take place at the SAW frequency. The second have a higher amplitude and persist for much longer (up to ms) time scales. They are attributed to charge trapping in the (Al,Ga)As structure, which modifies the external electric fields applied to create IXs. In addition, the moving SAW fields can transport IX packets over several hundreds of m with reduced shape distortion. The transport velocity of the IX packets increases with acoustic amplitude but never reaches the SAW velocity, even when strong acoustic fields are applied. This behavior is attributed to trapping centers along the transport path, which capture IXs and increase their transit time. We present a model for the effects of exciton trapping, which well reproduces their impact on both the transport velocity and the shape of the IX packets.
In the following, we first describe the sample structure and the optical techniques used to probe the acoustic transport of excitons by SAWs (Sec. 2). We then present experimental optical studies of the effects of the acoustic fields on the IX energy levels as well as on the time evolution of IX packets during acoustic transport (Sec. 3). In Sec. 4 the experimental results of IX dynamics are analyzed in terms of a model for the transport, which takes into account IX trapping by centers along the transport path. Finally, Sec. 5 summarizes the main conclusions of this study.
2 Experimental details
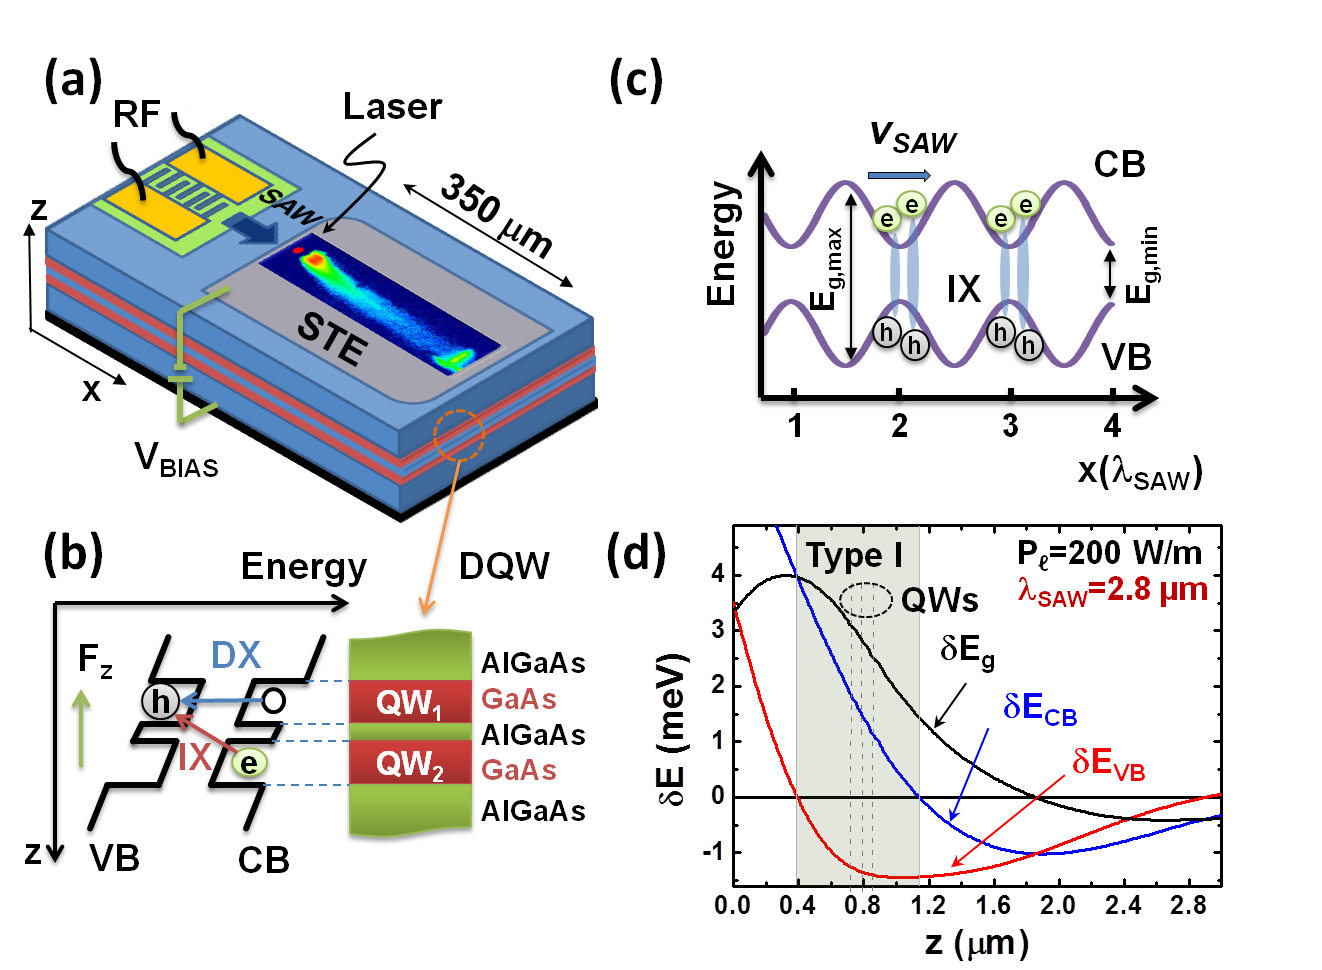
The samples used in the experiment consist of three sets of asymmetric GaAs DQWs grown by molecular beam epitaxy on a -doped GaAs(001) substrate [cf. Fig. 1(a)]. Each DQW is formed by a 14 nm (QW1) and a 17 nm-thick QW (QW2) separated by a thin (4 nm-thick) Al0.3Ga0.7As barrier. Multiple DQWs were used in order to enhance the photon yield in the optical experiments. The different QW widths allows for the selective generation of excitons in either QW1 or QW2 by the appropriate selection of the excitation wavelength:[20] this feature, however, has not been explored in the present studies. The electric field for the formation of IXs was induced by a bias voltage applied between the n-doped substrate and a thin (10 nm-thick) semitransparent Ti electrode (STE) deposited on the sample surface, as illustrated in Fig. 1(b).
The moving acoustic field was provided by a Rayleigh SAW with a wavelength =2.8 m corresponding to a frequency GHz at 4 K. The SAW was generated along a non-piezoelectric surface direction using aluminum interdigital transducers (IDTs) deposited onto a piezoelectric ZnO island. In order to minimize the screening of the radio-frequency (rf) field by carriers in the doped substrates, the DQW stack were embedded within thick, undoped Al0.26Ga0.74As layers. In this way, the total thickness of the undoped overlayers could be increased to approx. one .
The use of non-piezoelectric SAWs is essential to prevent exciton ionization by the piezoelectric field.[15] As illustrated in Fig. 1(c), the strain field produces, via the deformation potential interaction, a moving type-I modulation of the band edges, which confines IXs close to the SAW phases of lower band gap [cf. Fig. 1(c)] and transports them with the acoustic velocity . The SAW strain field and, therefore, the modulation of the band edges change with depth. The solid lines in Fig. 1(d) display the depth dependence of the conduction () and valence () bands, as well as as the band gap modulation calculated for a SAW with a linear power density W/m ( is defined as the acoustic power per unit length perpendicular of the SAW beam). The profiles were determined using a approach by taking into account the deformation potentials and the full SAW strain field obtained from an elastic continuum model for SAW propagation in the layered structure of the sample.[21] The amplitude and relative phases of the band edged modulation changes with depth. For depths between 0.15 and 0.35 and have opposite phases, thus producing a type-I lateral potential modulation, which confines electrons and holes at the same spatial position along the SAW path. The dashed vertical lines represent the positions of the three DQWs, which were selected in order to get band edge modulations of approximately the same amplitude but opposite phases for electrons and holes.[15] Different depths also lead to slightly different modulation amplitudes in the three DQWs. For the range of used acoustic powers, however, these differences are small compared to the spectral linewidth of the IXs.
The spectroscopic experiments were carried out at temperatures between 1.8 and 3.8 K in a bath He cryostat with rf electrical connections for SAW excitation. Excitons were generated on the SAW path using a laser beam focused onto a spot with a diameter of 10 m using a microscope objective. We used either a tunable cw Ti:Sapphire laser or a pulsed semiconductor laser emitting at 780 nm with pulse duration and repetition rate of 300 ps and 2.5 MHz, respectively. The laser excitation energies were always below the band gap of the (Al,Ga)As barrier in Fig. 1(b) to selectively excite carriers in the QWs. The PL from IXs emitted along the SAW path was collected by the same objective and detected with energy and spatial resolution using a cooled charge-coupled-device (CCD) camera connected to a spectrometer. Time-resolved PL measurements were carried out using an avalanche photodiode with time resolution of 400 ps synchronized with the laser pulses.
3 Results
3.1 Bias dependence of the IX lines
The structure of Fig. 1(b) forms a rectifying Schottky diode with the current () vs. voltage () characteristics illustrated in the inset of Fig. 2. The diodes have an excellent blocking behavior in the reverse bias region (i.e., for negative ). The current levels for voltages in the range V were less than 10 nA for devices with an area of m2, even under excitation with light energies below the band gap of the (Al,Ga)As barriers. As will become clear latter, these blocking characteristics are important to avoid carrier injection from the contacts and, thus, to ensure that both the optically generated electrons and holes are carried along the DQW structures during acoustic transport.
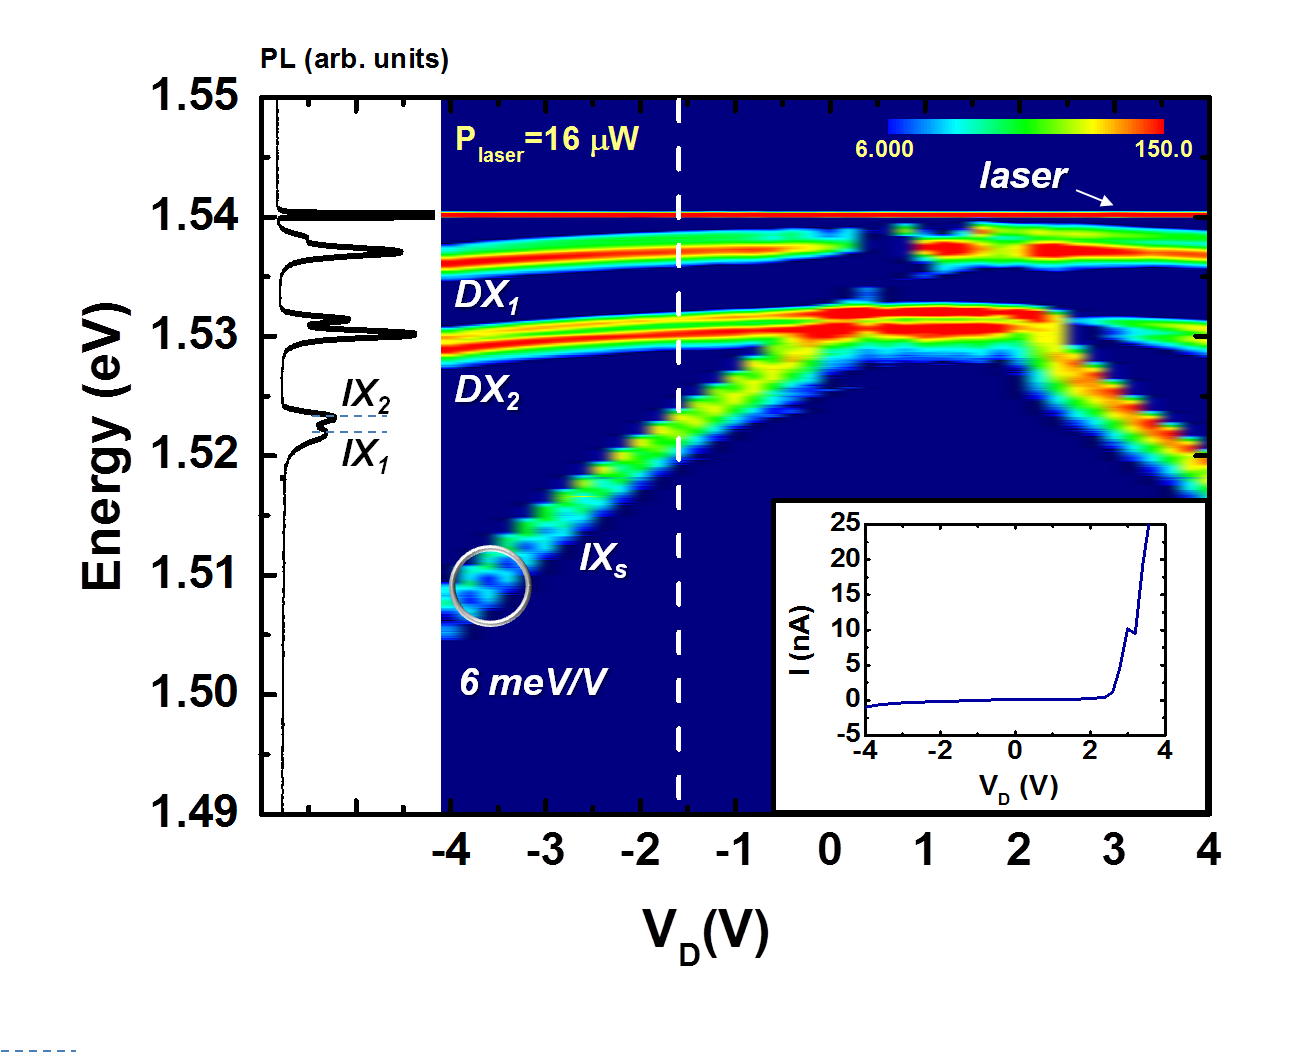
The dependence of the PL emission lines on is displayed in Fig. 2. Here, and denote the emission from direct excitons associated with the electron-heavy hole transitions in and , respectively. A closer observation (cf. left inset) reveals that the DX lines are split into two components. The splitting is attributed to the coexistence of both neutral and charged direct excitons. The and energies slightly red-shift with due to the intra-well QCSE induced by the applied bias.
The application of a negative bias creates IXs with the electron and hole constituents confined within the wider (QW2) and narrower (QW1) quantum wells, respectively. In general, the IX PL is split in different lines (as indicated by and in Fig. 2), whose energy red-shifts linearly with the applied bias. The splitting between the IX lines depends on acoustic power and on the illumination conditions. This last behavior contrast with the one observed for direct excitons, where, for each QW, the energy splitting between charged and neutral exciton lines does not change with the excitation conditions. As will be discussed in detail later, the appearance of more than one IX line is attributed to inhomogeneities in the electric field within the DQW region. The latter can give rise to up to three different IX energies, each corresponding to one of the DQWs. The IX lines red-shifts due to the inter-well QCSE at a rate of approximately meV/V. The latter corresponds approximately to the potential difference between the center plane of the QWs given by meV/V, where () denotes the QW thickness, is the barrier width, and the total thickness of the intrinsic regions between the doped substrate and the STE. Finally, formation of IX is also observed for positive bias higher than approximately 2.5 V. This regime, however, will not be further explored here.
3.2 Acoustic modulation of excitons
The color maps of Figs. 3(a) and (b) illustrate the effects of the acoustic field on the emission of DXs. The plots display the spectral distribution of the PL from the DQWs as a function of the distance () from the generation spot in the absence and presence of a SAW beam, respectively. The measurements were carried out at 3.8 K with V. Under these conditions, IX do not form and the spectra are dominated by direct excitons from QW1 and QW2. The DX emission is spatially constrained to a circle of radius of approx. 16 m around the generation spot. The size of the emission region is determined by expansion of the DX cloud around the illumination spot. In contrast to the behavior of excitons under piezoelectric SAWs,[16] neither a substantial quenching of the integrated PL intensity nor long-range acoustic transport are observed under non-piezoelectric SAWs. This behavior is consistent with the fact that the type-I band gap modulation of Fig. 1(b) does not ionize excitons by spatially separating electrons and holes. The DX radiative lifetimes remain short, thus preventing the acoustic transport over distances .
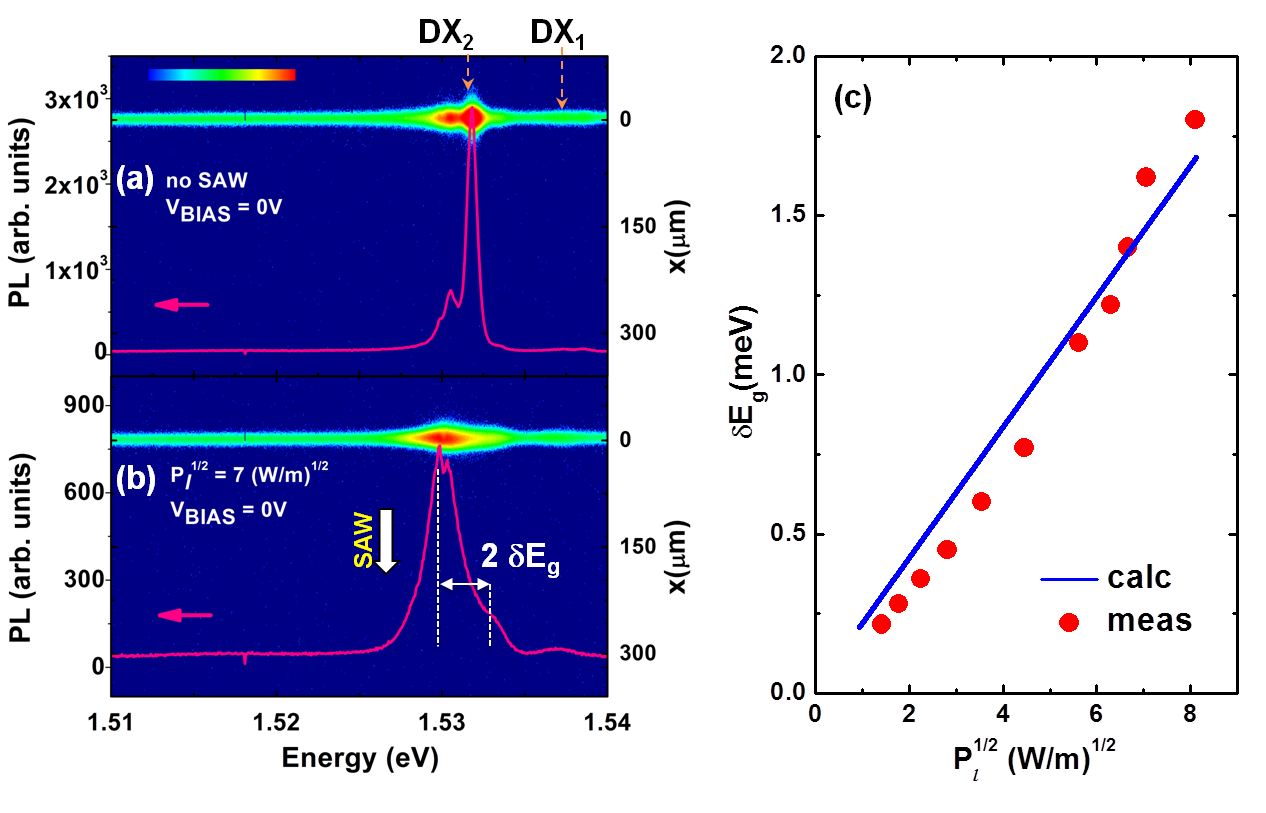
As in the piezoelectric case, [17] Fig. 3(b) also shows that the periodic modulation of the band gap by the SAW strain splits the DX [17, 15] lines, the splitting being equal to twice the amplitude of the band gap modulation. is plotted as a function of in Fig. 3(c). has been chosen as the horizontal coordinate since it is proportional to the amplitude of the strain field induced by the SAW. reaches values up to 1.8 meV for the highest applied acoustic power. The solid line displays the dependence of on calculated using the previously mentioned approach. Both the measured and calculated values reproduce the linear dependence of the modulation amplitude on .
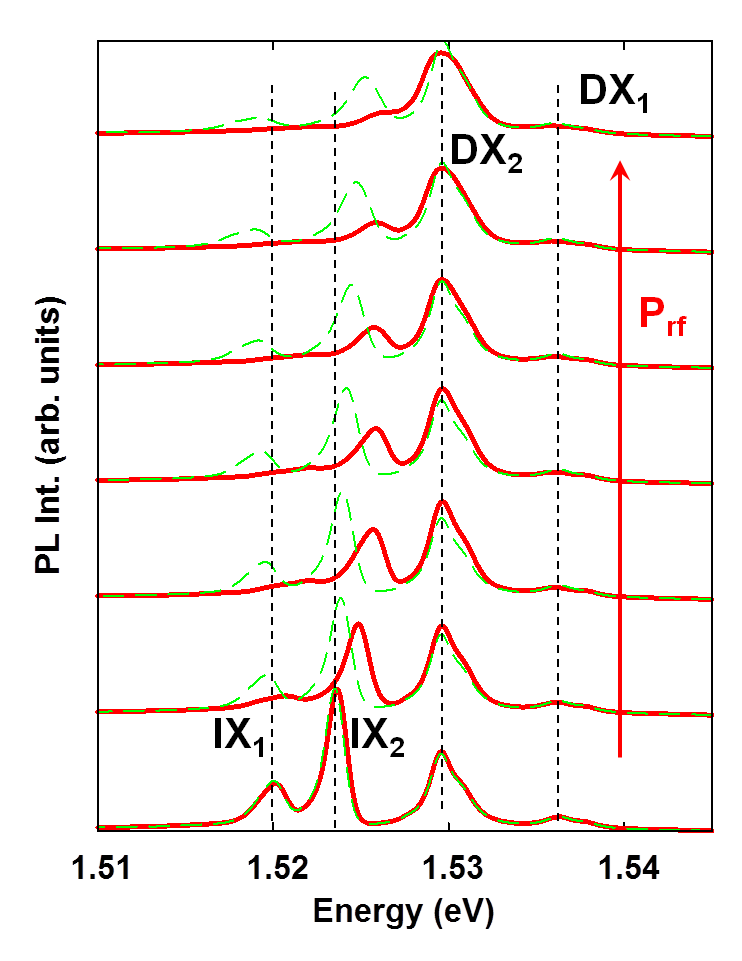
The impact of the acoustic fields on the PL spectrum is illustrated in Fig. 4. The bottom spectrum shows the PL spectrum of the samples recorded under a reverse bias () in the absence of a SAW. Under these conditions, one finds in addition to the direct exciton lines the red-shifted signatures from IXs. The additional solid curves in this figure were obtained for increasing acoustic powers (from bottom to top). The IX lines broaden and shift in energy with . The broadening is attributed to the strain-induced modulation of the (spatially indirect) band gap. In contrast to the behavior of DXs under a small applied bias, the larger spectral width and longer lifetime of the IXs prevents the observation of the strain-induced splitting of the lines.
The IX energy shifts with increasing in Fig. 4 are different for lines and and much larger than the band gap modulation amplitude . Note that while the center position of the DX emission lines remain constant, the line blue-shifts and approaches DX2 for high acoustic powers. This behaviour is attributed to changes in the electric field across the DQWs due to charge redistribution induced by the acoustic field. The DQWs are embedded within (Al,Ga)As barrier layers with high electrical resistance. As a results, charges can be stored close to them, leading to variations in the electrostatic field configuration. We have observed, for instance, that illumination with energy above the band gap of the barrier layers can lead to large shifts in the IX energies in the absence of acoustic excitation. Here, the electric field becomes perturbed by the photo-excited electrons and holes, which are spatially separated by the applied vertical field. For selective excitation of the QWs using laser energies below the band gap of the barriers, in contrast, these shifts become very small. However, they increase when a SAW is turned on (cf. Fig. 4).
The SAW induced IX energy shifts in Fig. 4 have a transient character and persists after the acoustic field has been switched off. In order to justify this assignment the PL was recorded while modulating both the amplitude of the rf-power applied to the IDT and the laser excitation beam with a square wave with a repetition period of 3.6 ms. The solid lines in Fig. 4 were recorded with the optical and rf square waves in phase (denoted as the phase ON condition). In this case, both excitations are applied simultaneously to the sample. For comparison, measurements were also carried out by shifting the phase of the two square waves by 180∘ (phase OFF condition, indicated by the dashed lines in Fig. 4). Here, the sample is illuminated while the SAW is switched off. Since the lifetime of the carriers is much shorter than the square wave period, the PL is emitted during the light pulses, when the SAW is turned off. Note, however, that with increasing the IX energies also blue-shift with respect to the energies measured without acoustic excitation (lowest spectrum), the blue-shift increasing with the amplitude of the previously applied SAW pulses. The observed shifts in IX energy indicate that the charge configuration created by the SAW pulses persists for times scales exceeding one ms. In contrast, the DX lines remains essentially the same in the phases ON and OFF. Finally, since the modulation periods are also shorter than the thermal relaxation times, these results also show that the modifications in the IX emission cannot be assigned to thermal effects.
The acoustically induced energy shifts appear for very weak acoustic powers, i.e., for levels far below those required for long-range acoustic transport along the SAW propagation direction (see Sec. 3.3). In contrast to the changes due to illumination with energies above the barrier band-gap, the acoustically induced modifications are probably associated by carrier transport along the QW plane followed by charge trapping. The determination of the microscopic mechanism responsible for this behavior requires further investigations and is beyond the scope of the present paper.
3.3 Indirect exciton transport
The optical technique used to probe acoustic transport is illustrated by the time-integrated PL image superimposed on the sample layout of Fig. 1(a), which maps the average distribution of transported IX along the channel underneath the STE defined by the SAW beam. In this image, the contributions from exciton diffusion to the transport, which are only significant close to the generation spot, were eliminated by subtracting a similar image recorded in the absence of the SAW beam. The PL along the transport path is attributed to the recombination of IXs captured by trapping centers in the DQW plane. While it allows to visualize the IX distribution, trapping also reduces the transport efficiency and, as will be discussed in detail below, the effective IX transport velocity. The mechanism for the strong PL at the edge of the STE opposite to the IDT has a different origin. Here, the potential barrier created by the abrupt reduction of the vertical field blocks further transport and forces IX recombination.
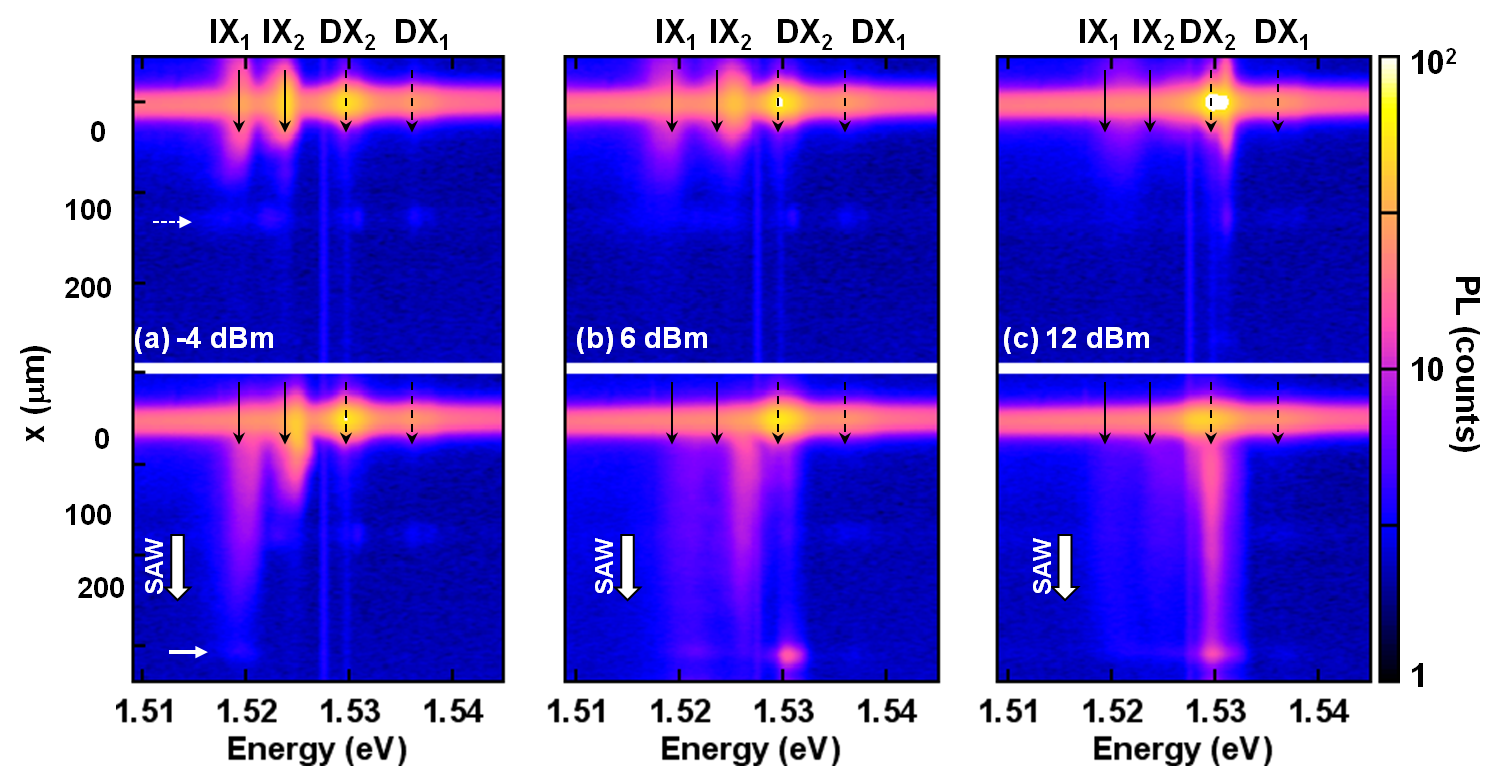
Additional information about the IX transport mechanism was obtained from the spectral distribution of the PL along the transport path measured for different acoustic powers in the lower panels of Fig. 5. These PL maps were recorded under the phase ON condition described above, where the optical and acoustic excitations are applied in phase. The IX are captured by the acoustic field and transported up to the end of the STE, which is located at a distance m away from the generation spot [indicated by the horizontal solid arrow in (a)]. The upper plots display, for comparison, the corresponding maps measured in the phase OFF conditions. The IX cloud extends, in this case, up to distances from the generation point of at most m.
The solid and dashed vertical arrows in Fig. 5 mark the energy of the main indirect and direct exciton lines determined in the absence of acoustic excitation. For low acoustic power [lower panel in Fig. 5(a)] transport takes place preferentially through the lowest lying state, which has the longest recombination lifetime. For intermediate SAW amplitudes [Fig. 5(b)], the strongest emission along the transport path is observed for , which blue-shifts with acoustic power. In contrast, most of the PL at the end of the transport channel has an energy close to the one of DX2. Since the lifetime of direct excitons is expected to be much smaller than the transit time of the carriers (on the order of ns, where is the acoustic velocity), they cannot be transported over such large distances. The emission at the DX2 energy along the transport path is attributed to the conversion of IXs to DX2, followed by a fast radiative decay of the DX2s. The interconversion becomes enhanced at the edges of the STE, where the suppression of reduces the energy separation between the direct and indirect excitonic species.
Under the action of a reverse bias , the IXs in the structure of Fig. 1(b) consist of electrons stored in the wider (QW2) and holes in the narrower (QW1) quantum wells. As a result, the IX-DX2 conversion requires the excitation of the IX-holes from to the wider . The efficiency of this process is expected to increase when the difference in energy between the hole levels in the two QWs becomes comparable to the amplitude of the acoustic modulation of the VB edge, on the order of 1-2 meV in the present case. The latter is supported by the results for high acoustic power in Fig. 5(c), when approaches . In this case, most of the emission along the transport path takes place at the direct exciton energy.
3.4 Transport dynamics
The dynamics of the acoustic transport was investigated by recording time-dependent PL profiles at different distances d from the pulsed laser excitation spot using an avalanche photodiode synchronized with the laser pulses. The integrated PL over the energy range of excitonic emission was collected over a 10 m-wide stripe across the propagation path of a SAW. The time resolution of the experiments is then given by the ratio between this length and the average velocity of the IX packets (see below). The SAWs were generated by a continuous rf-source. Figure 6(a) displays time-resolved profiles recorded for different transport distances d under a strong acoustic modulation amplitude ( meV). In all cases, well-defined PL pulses are observed with time delays increasing with propagation distance according to , where is the average IX transport velocity (cf. Fig. 6). In addition, the rising edge of the time-resolved PL pulses becomes less abrupt for increasing while the trailing edge develops a tail indicating a distribution of arrival times at the detection position.
The initial radius of the IX cloud created by the laser was estimated from the size of the PL emission region around the laser spot [cf. Fig. 3(a)] to be m. The cloud extends, therefore, over several SAW wavelengths m. For the shortest transport distance (m), the width of the PL pulses corresponds closely to the ratio between the initial Gaussian width () of the IX cloud and the average IX transport velocity ().
The effects of the SAW amplitude on the IX dynamics are illustrated in Fig. 6(b). Here, the PL profiles were recorded at a fixed distance m while varying to change the band gap modulation amplitude . The shape of the pulses is almost the same for large modulation amplitudes ( meV), under which the IXs are efficiently trapped and transported by the SAW fields. For lower amplitudes, in contrast, increases substantially whereas the PL pulses broaden and develop a pronounced tail.
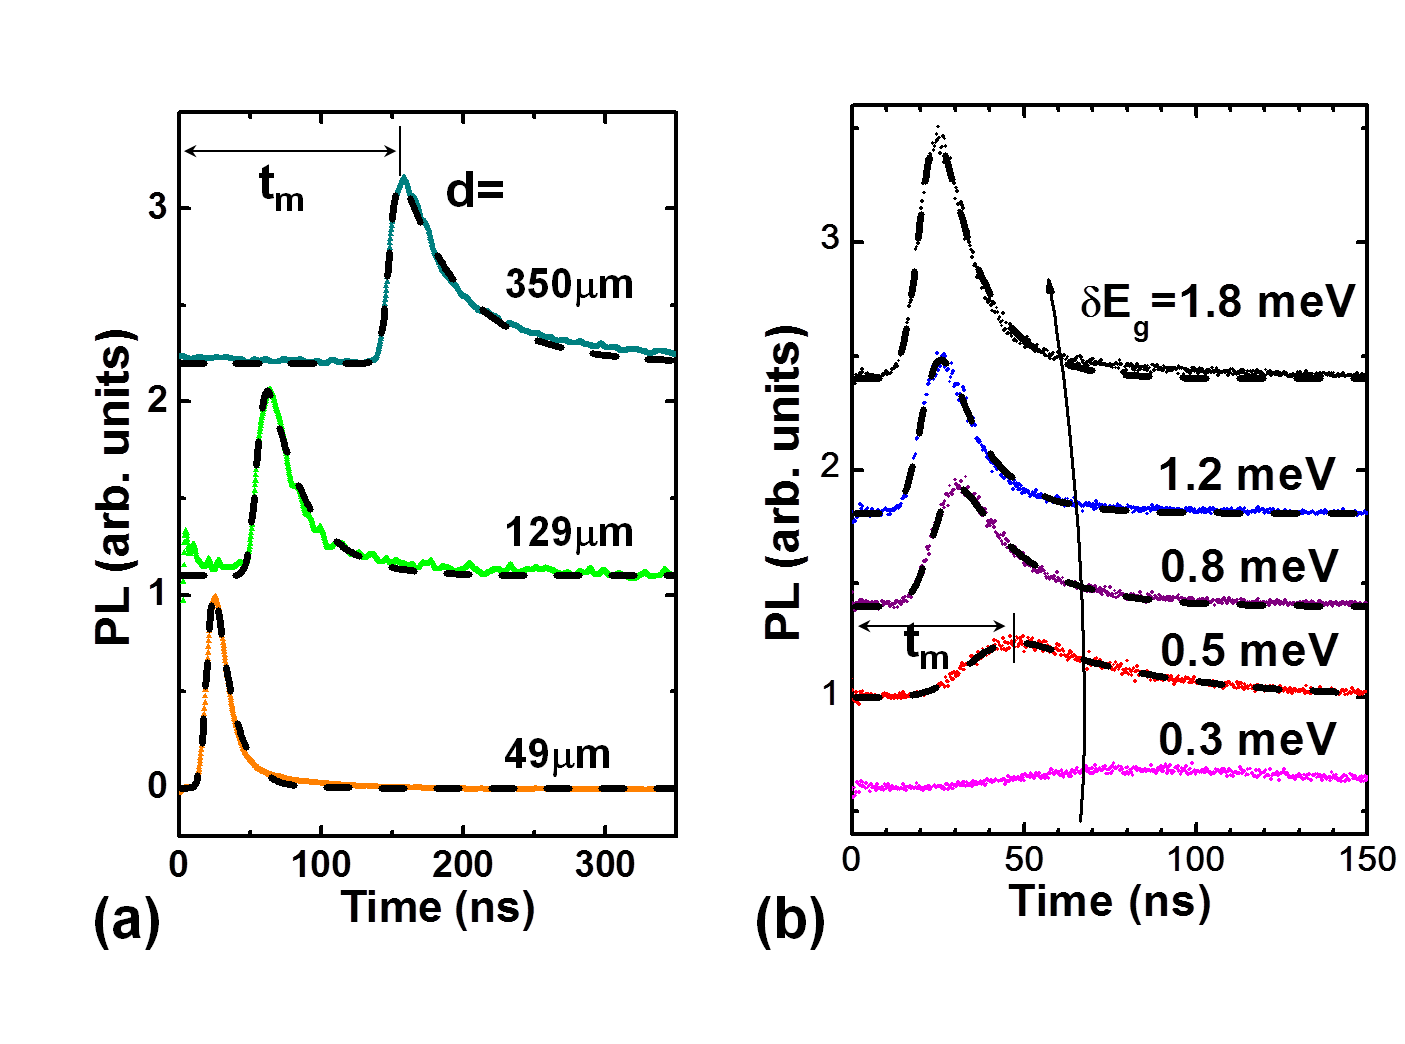
Figure 7 summarizes the dependence of the average transport velocity on the band gap modulation amplitude () recorded at different transport distances . increases with until it saturates for meV. Interestingly, the saturation velocity increases with and never reaches the SAW group velocity along the transport path of m/ns (dashed line). Due to the presence of the ZnO layer, in the region in-between the ZnO islands differs from the product of the IDT resonance frequency and its wavelength. was determined by measuring the propagation time of an acoustic pulse in a delay line with two transducers built on the same sample. These measurements were carried out using a network analyzer with time-domain capabilities.
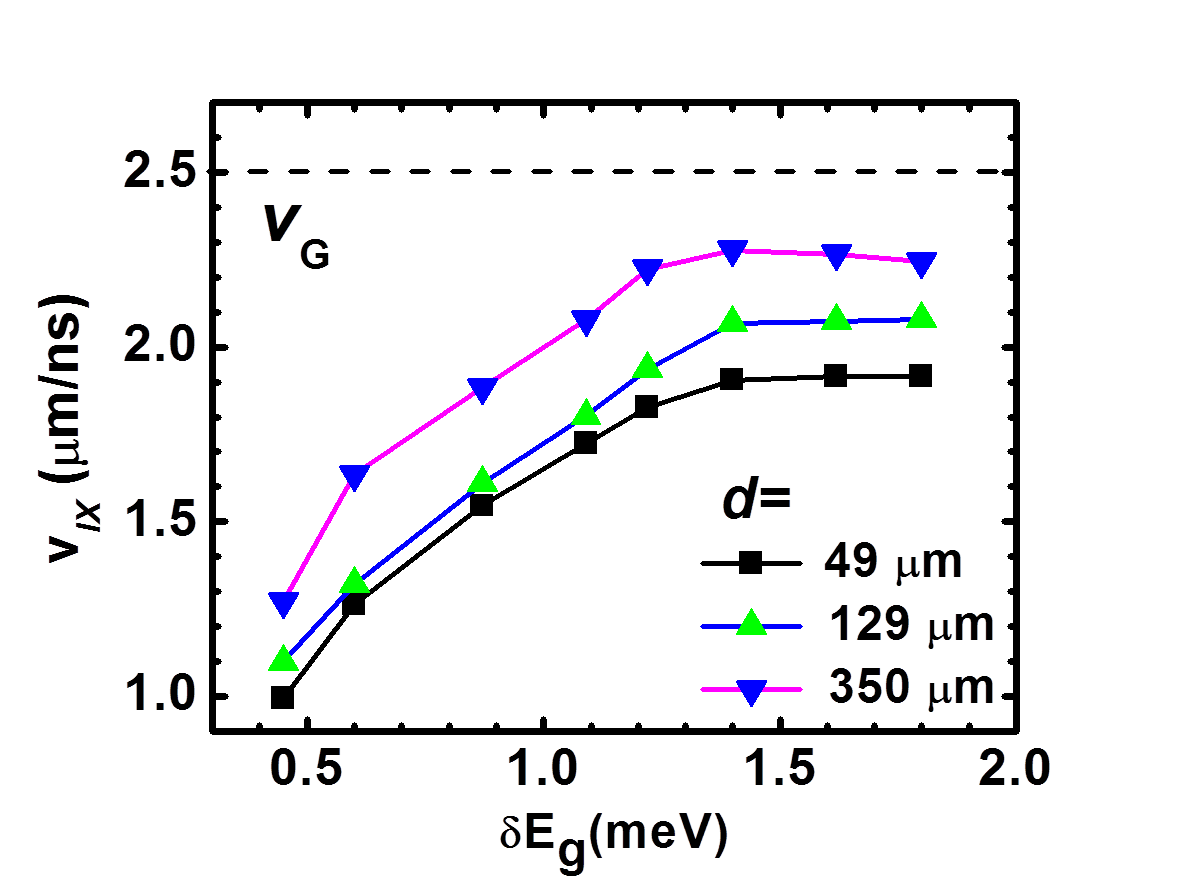
According to Figs. 6(b) and 7, long-range acoustic transport takes place for modulation amplitudes meV, when the maximum effective exciton velocity in the acoustic potential, , exceeds the SAW velocity . can be stated in terms of the exciton mobility as , where . Using this expression, we estimate cm2/(eV s) and an IX diffusion coefficient cm2/s at 3.8 K. These values agree well with those reported for IXs in DQWs with comparable QW thicknesses. [12] Note, however, that the efficient transport of IXs requires modulation amplitudes much larger (by a factor of approx. 3) than those for the onset of transport.
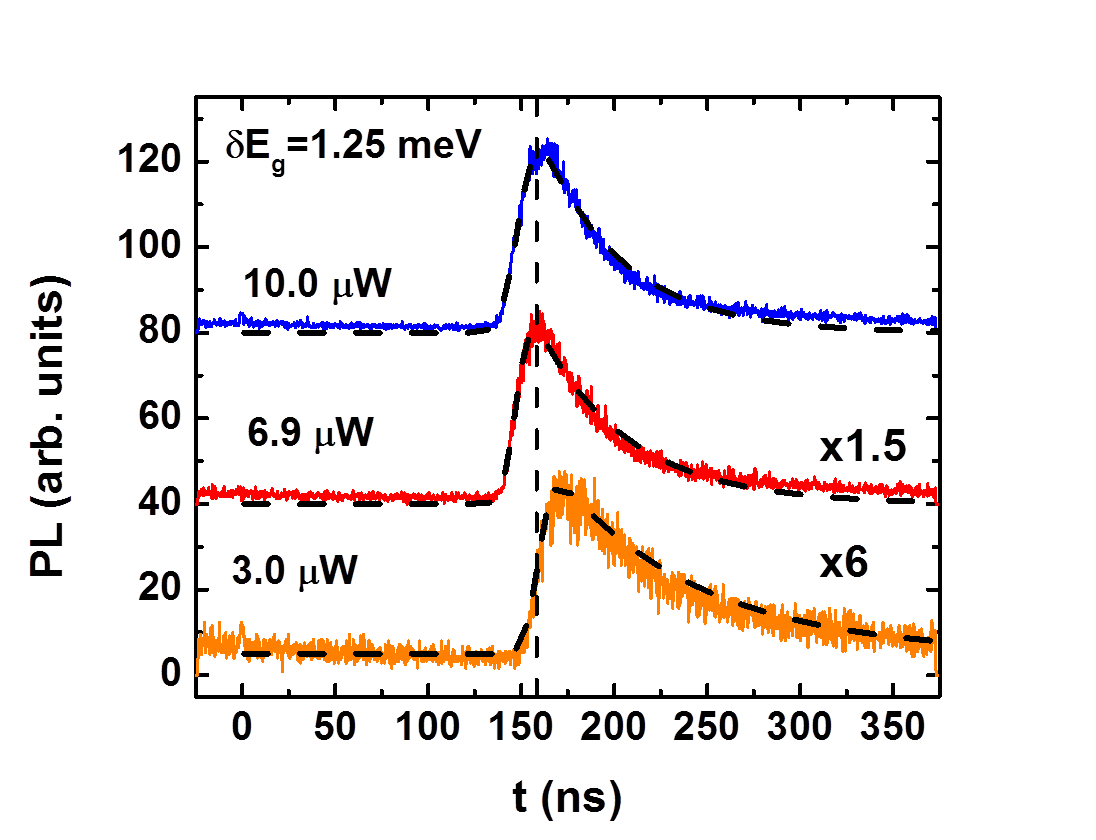
The dependence of the IX dynamics on IX density was investigated by recording time-resolved profiles as a function of the laser pulse intensity (cf. Fig. 8). The experiments were carried out in the regime of strong acoustic excitation (i.e., for eV in Fig. 7), where is approximately independent of the SAW power. The profiles exhibit a weak dependence on the excitation density, thus indicating that non-linear effects are negligible in the range of studied densities.
4 Discussions
Previous studies of acoustic transport efficiency using piezoelectric SAWs have identified two main regimes.[19] For small acoustic powers, the carriers are dragged by the SAW with an effective velocity much smaller than the acoustic velocity. This behavior corresponds to dynamics of IXs observed for meV in Fig. 6(b). In contrast, high acoustic modulations efficiently trap the carriers, as depicted in Fig. 1(c). In this regime, a Gaussian IX packet with initial width should move with the SAW group velocity while maintaining its shape. The time-dependent PL profiles at a distance d would then be given by
| (1) |
where is the maximum PL intensity and . The IX kinetics displayed in Figs. 6(a) and 7, however, does not follow this prediction: the exciton velocity increases with the propagation distance and never reaches the SAW group velocity . In addition, the IX packets broaden (indicating an increase in ) for increasing transport distances and develop a tail towards longer times.
We mentioned in Sec. 3.2 that carrier trapping may change the potential distribution in the DQWs, thus leading to changes in the energy of the IX species. We show in this section that trapping can also account for the reduced transport velocity as well as for the deviations of the profile shapes from Eq. (1). In order to model the effects of the trapping centers, we will assume that they can capture and retain the IXs over an interval described by the exponential distribution . Here, is the average time the IXs remain immobilized in traps during transport. In this approximation, an initially Gaussian profile [of the form in Eq. (1)] will evolve in time according to
where is the complementary error function, , and ”” denotes the convolution operator. The approximation given by Eq. 4 is valid for , which is almost always satisfied.
While the maximum of Eq. 1 occurs for , the maximum of Eq. (4) (as well as for the spectra of Fig. 6) takes place for . One of the main effects of trapping is to increase the transit time due to the extra delay , leading to the reduced IX saturation velocity displayed in Fig. 7. The extra delay is related to the width of the leading edges of the PL pulses described by . While increases with propagation distance (see discussion below), is determined by a diffusion-like process and increases proportionally to with . The increase of the saturation values of with arises from the fact that the relative contribution of factor reduces with increasing .
The predictions of the model are shown by the solid lines superimposed on the data points in Figs. 6 and 8, which were obtained by using , , and of Eq. (4) as fit parameters. The quality of the fits dependents weakly on except for the lowest modulation amplitudes ( meV). In these cases, the fits improve by varying also [as in Fig. 6(b)]. The excellent agreement with the experimental results over a wide range of transport distances and modulation amplitudes is a strong indication that the model correctly describes the IX dynamics during acoustic transport.
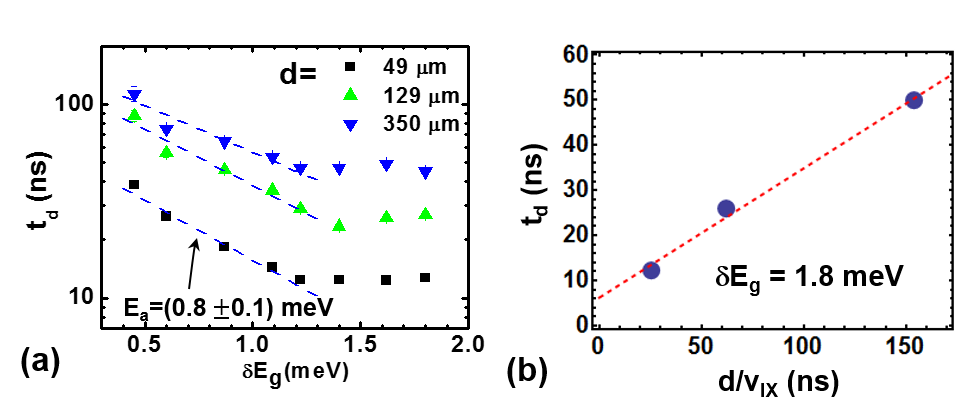
Further information about the trapping centers can be obtained from the characteristic trapping times determined by the fittings, which are summarized in Fig. 9(a). The dependence of on mimics the one displayed for in Fig. 7. In fact, decreases exponentially with with a characteristic decay energy meV in the region of low acoustic amplitudes and saturates for meV. is assigned to the energy required for acoustic excitation of trapped IXs to the transport path. Note that it exceeds the thermal energy at the measurement temperature ( meV) by more than a factor of two.
The trapping time saturates for high SAW amplitudes, thus indicating that the transport in this regime becomes controlled by trapping centers with capture and emission kinetics that do not depend on the acoustic intensity. Finally, also increases with the transport time . This behavior is attributed to the increase in the number of trapping events with transport distance. In order to justify this assertion, we plot in Fig. 9(b) the dependence of on the transport time in the saturation regime (for meV). increases linearly with the transport time: from the extrapolation to zero transport times, we obtain a characteristic dwell time of 6 ns for each trapping event.
5 Conclusions
We have carried out a detailed investigation of the effects of high-frequency acoustic fields on dipolar IXs in (Al,Ga)As DQW structures. We have shown that the SAW strain shifts in the excitonic energies via two mechanisms. The first is the modulation of the band gap by the SAW strain, which produces mobile potentials for the trapping and transport of IXs. The second arises from electrostatic changes in the electric field applied across the DQWs induced by acoustically induced charge trapping. While the former takes place in the nanosecond time scale defined by the SAW frequency, the latter are transient and persist over times exceeding one millisecond. We have also carried out a detailed investigation of the IX transport dynamics using time-resolved techniques. These studies have shown that the IXs are carried as well-defined packets moving with velocities close to the SAW velocity. The dynamics of the packets is determined by trapping centers along the transport path, which capture IXs and reduce their effective transport velocity. We present a detailed model the transport process including the effect of traps, which reproduces very well both the time and the spatial evolution of IX packets during acoustic transport.
The strong impact of traps on the IX dynamics is partially associated with the small band gap modulation induced by the SAW strain, which is comparable to the IX spectral linewidths. Different approaches can be followed to increase the transport efficiency. One of them consists in improving sample growth conditions to increase the mobility and reducing, e.g., the density of trapping sites. A second explores the enhancement of the acoustic fields. In fact, since the acoustic power densities produced by piezoelectric transducers scale with the , much strong modulation amplitudes are expected for high frequency SAWs. Finally, the present experiments were carried out using relatively small exciton densities. For higher densities, one can also take advantage of the repulsive interactions between IX, which can smooth potential fluctuations [22] and, therefore, increase the mobility.
We thank Holger T. Grahn for discussions and comments on the manuscript. We are indebted to S.
Rauwerdink, W. Seidel, S. Krauß, and A. Tahraoui for the assistance in the preparation
of the samples. We also acknowledge financial support from the German DFG (grant
SA-598/9).
References
- [1] R. J. Warburton. Electronics lightens up. Nat. Phys., 4:676, 2008.
- [2] K. Sivalertporn, L. Mouchliadis, A. L. Ivanov, R. Philp, and E. A. Muljarov. Direct and indirect excitons in semiconductor coupled quantum wells in an applied electric field. Phys. Rev. B, 85:045207, Jan 2012.
- [3] L. V. Butov, A. C. Gossard, and D. S. Chemla. Macroscopically ordered state in an exciton system. Nature, 418:751, 2002.
- [4] A. A. High, J. R. Leonard, A. T. Hammack, M. M. Fogler, L. V. Butov, A. V. Kavokin, K. L. Campman, and A. C. Gossard. Spontaneous coherence in a cold exciton gas. Nature, 483:584, March 2012.
- [5] Yehiel Shilo, Kobi Cohen, Boris Laikhtman, Ronen Rapaport, Ken West, and Loren Pfeiffer. Particle correlations and evidence for dark state condensation in a cold dipolar exciton fluid. arXiv, 1305.2895v1:–, 2013.
- [6] Kobi Cohen, Ronen Rapaport, and Paulo V. Santos. Remote dipolar interactions for objective density calibration and flow control of excitonic fluids. Phys. Rev. Lett., 106(12):126402, Mar 2011.
- [7] M. Baldo and V. Sojanovi. Optical switching: excitonic interconnects. Nat. Photonics, 3:558, 2009.
- [8] Alex A. High, Ekaterina E. Novitskaya, Leonid V. Butov, Micah Hanson, and Arthur C. Gossard. Control of exciton fluxes in an excitonic integrated circuit. Science, 321:229, 2008.
- [9] G. J. Schinner, J. Repp, E. Schubert, A. K. Rai, D. Reuter, A. D. Wieck, A. O. Govorov, A. W. Holleitner, and J. P. Kotthaus. Confinement and interaction of single indirect excitons in a voltage-controlled trap formed inside double ingaas quantum wells. Phys. Rev. Lett., 110:127403, Mar 2013.
- [10] Alexander G. Winbow, Aaron T. Hammack, Leonid V. Butov, and Arthur C. Gossard. Photon storage with nanosecond switching in coupled quantum well nanostructures. Nano Lett., 7(5):1349–1351, 2007.
- [11] G. Grosso, J. Graves, A. T. Hammack, A. High, L. V. Butov, M. Hanson, and A. C. Gossard. Excitonic switches operating at around 100 k. Nat Photon, 3(10):577–580, October 2009.
- [12] Z. Vörös, R. Balili, D.W. Snoke, L. Pfeiffer, and K. West. Long-distance diffusion of excitons in double quantumwell structures. Phys. Rev. Lett., 94:226401, 2005.
- [13] A. Gärtner, A. W. Holleitner, J. P. Kotthaus, and D. Schuh. Drift mobility of long-living excitons in coupled GaAs quantum wells. Appl. Phys. Lett., 89:052108, 2006.
- [14] A. G. Winbow, J. R. Leonard, M. Remeika, Y. Y. Kuznetsova, A. A. High, A. T. Hammack, L. V. Butov, J. Wilkes, A. A. Guenther, A. L. Ivanov, M. Hanson, and A. C. Gossard. Electrostatic conveyer for excitons. Phys. Rev. Lett, 106:196806, 2011.
- [15] J. Rudolph, R. Hey, and P. V. Santos. Long-range exciton transport by dynamic strain fields in a GaAs quantum well. Phys. Rev. Lett., 99:047602, 2007.
- [16] C. Rocke, S. Zimmermann, A. Wixforth, J. P. Kotthaus, G. Böhm, and G. Weimann. Acoustically driven storage of light in a quantum well. Phys. Rev. Lett., 78:4099, 1997.
- [17] T. Sogawa, P. V. Santos, S. K. Zhang, S. Eshlaghi, A. D. Wieck, and K. H. Ploog. Dynamic band structure modulation of quantum wells by surface acoustic waves. Phys. Rev. B, 63:121307(R), 2001.
- [18] F. Alsina, P. V. Santos, R. Hey, A. García-Cristóbal, and A. Cantarero. Dynamic carrier distribution in quantum wells modulated by surface acoustic waves. Phys. Rev. B, 64:0410304(R), 2001.
- [19] A. García-Cristóbal, A. Cantarero, F. Alsina, and P. V. Santos. Spatiotemporal carrier dynamics in quantum wells under surface acoustic waves. Phys. Rev. B, 69:205301, 2004.
- [20] M. Stern, V. Garmider, E. Segre, M. Rappaport, V. Umansky, Y. Levinson, and I. Bar-Joseph. Photoluminescence ring formation in coupled quantum wells: Excitonic versus ambipolar diffusion. Phys. Rev. Lett., 101(25):257402, 2008.
- [21] M. M. de Lima, Jr. and P. V. Santos. Modulation of photonic structures by surface acoustic waves. Rep. Prog. Phys., 68:1639, 2005.
- [22] M. Remeika, J. C. Graves, A. T. Hammack, A. D. Meyertholen, M. M. Fogler, L.V. Butov, M. Hanson, and A. C. Gossard. Localization-delocalization transition of indirect excitons in lateral electrostatic lattices. Phys. Rev. Lett., 102:186803, 2009.