Double-peaked thermonuclear bursts at the soft-hard state transition in the Rapid Burster
Abstract
Long suspected to be due to unstable accretion events, the type II bursts exhibited by the Rapid Burster (RB, or MXB 1730-335) still lack an exhaustive explanation. Apart from type II bursts, the transient RB also shows the better-understood thermonuclear shell flashes known as type I bursts. In search of links between these two phenomena, we carried out a comprehensive analysis of all Rossi X-ray Timing Explorer observations of the RB and found six atypical type I bursts, featuring a double-peaked profile that is not due to photospheric radius expansion. The bursts appear in a phase of the outburst decay close to the onset of the type II bursts, when the source also switches from the high/soft to the low/hard state. We also report the discovery of a simultaneous low-frequency quasi-periodic oscillation present in the persistent emission as well as in the burst decaying emission. We discuss several scenarios to understand the nature of the peculiar bursts and of the accompanying oscillation, as well as their possible relation with each other and with the type II burst phenomenon. We favour a model consisting of two accretion channels, one polar and one equatorial, in a source viewed at low inclination. We also, for the first time, clearly identify the atoll nature of the RB.
keywords:
stars: neutron – X-rays: binaries – X-rays: bursts – X-rays: individual: MXB 17303351 Introduction
The Rapid Burster (RB; e.g. Lewin, van Paradijs & Taam, 1993) is a transiently-accreting neutron star (NS) low-mass X-ray binary (LMXB), with outbursts recurring in less than one year (Masetti, 2002) and peak luminosities up to nearly half the Eddington limit (Bagnoli et al., 2013, hereafter B13). It is located in the globular cluster Liller 1, at a distance of kpc (Valenti, Ferraro & Origlia, 2010). It is unique, in that it shows both type I bursts, which are X-ray eruptions due to the heating and cooling of the NS photosphere after a thermonuclear shell flash of accreted material (see e.g. reviews by Strohmayer & Bildsten 2006 and Galloway et al. 2008), and type II bursts, most likely due to the release of gravitational energy during sudden accretion episodes (Hoffman, Marshall & Lewin, 1978). While the former are relatively well understood and observed in over a hundred sources, it remains unclear why the latter have been unambiguously detected in only two NS LMXBs, the other one being the slowly rotating (2 Hz) Bursting Pulsar (Kouveliotou et al., 1996).
The Proportional Counter Array (PCA) onboard the Rossi X-ray Timing Explorer (RXTE) observed 125 type I and about 7050 type II bursts from the RB. A complete analysis (B13) of the type I burst sample shows that type I bursts appear in the RB over a remarkably large range of mass accretion rates, recurring faster as its bolometric luminosity increases to a large fraction of the Eddington limit, a behaviour only shared with the 11 Hz pulsar IGR J17480-2446 (Linares et al., 2012) among over a hundred bursting LMXBs (see e.g. Cornelisse et al. 2003). The known NS spin frequencies in these systems range between 245 and 620 Hz (Watts, 2012), and the exceptional bursting behaviour of IGR J17480-2446 can be explained only thanks to its slow NS spin (Linares et al., 2012). This indicates the RB should be a slow rotator too (B13).
Type II bursts instead appear only after the outburst has significantly decayed, usually below a bolometric persistent flux of erg cm-2 s-1 (Guerriero et al., 1999). They often show a relaxation-oscillator behaviour, meaning that the fluence in a type II burst is proportional to the waiting time to the next one. These properties hint at disc-magnetosphere interactions that are largely thought to control the type II burst phenomenon (Baan, 1977, 1979; Lamb et al., 1977; Spruit & Taam, 1993). Type II bursts in the RB are often accompanied by low-frequency quasi periodic oscillations (LF QPOs) in the persistent emission, both at frequencies between 2 and 4 Hz, and at much slower values centred about an average of 42 mHz. They both cease right before the onset of a type II burst, so it is likely that they originate in the same mass reservoir whose spasmodic accretion is responsible for the type II burst (Stella et al., 1988; Lubin et al., 1992).
Much theoretical work (e.g. Kulkarni & Romanova, 2008; D’Angelo & Spruit, 2010; Romanova et al., 2012; D’Angelo & Spruit, 2012) has focussed on the dynamical role of the magnetic field, which can act as a “gating” mechanism to the accretion flow once the mass accretion rate drops below a certain threshold. These models could explain the episodic accretion that is responsible for the type II burst phenomenon, but also LF QPOs at low mass accretion rates, as those observed in the lightcurves of the accreting millisecond X-ray pulsars (AMXPs) SAX J1808.4-3658 (Patruno et al., 2009) and NGC 6440 X-2 (Patruno & D’Angelo, 2013).
We report here on six peculiar type I bursts that stand out among the RB PCA sample because of a unique double-peaked structure first noticed by Fox et al. (2001). We show that four of these bursts appear at the transition from the high/soft to the low/hard state (van der Klis, 2006), and that this takes place at the time of the first appearance of type II bursts. We exclude the possibility that their double peaks are due to photospheric radius expansion (PRE; see e.g. Lewin et al. 1993). We also find a previously unreported QPO at a frequency of about 0.25 Hz. The QPO becomes visible in the persistent emission a few days before the double-peaked bursts, peaks in amplitude at the time the bursts appear, even becoming directly visible in the lightcurve, and fades out over the next few days.
We describe the spectral and timing properties of the double-peaked type I bursts and the LF QPO accompanying them, and investigate whether they can shed further light on the nature of the interaction between accretion and magnetic-field effects in the enigmatic RB. Section 2 describes the dataset and discusses the data analysis. Section 3 presents the results of our analysis, and finally Section 4 discusses the interpretation of these results in the context of models and observations of other sources.
2 Observations
Most measurements described here were obtained through observations with the PCA. The PCA (Jahoda et al., 2006) is a non-imaging system consisting of five co-aligned proportional counter units (PCUs) that combine to a total effective area of 6500 cm2 at 6 keV, in a 2 to 60 keV bandpass. The photon energy resolution is 18 per cent full width at half maximum (FWHM) at 6 keV and the time resolution is programmable down to about 1 s. The field of view (FOV) is approximately circular, with radius 1 (full width to zero response). The RXTE observations of the RB include a mix of data. There are observations directly pointed at the source that are contaminated by the presence of 4U 1728-34 at an angular distance of 0.56 (Galloway et al., 2008), and offset pointings that do not suffer from such contamination, albeit at the price of a smaller effective area. The total exposure time obtained on the RB while it was active is 0.91 Msec. For further details on source confusion in the FOV, burst identification, and discrimination between type I and type II bursts, we refer the reader to B13.
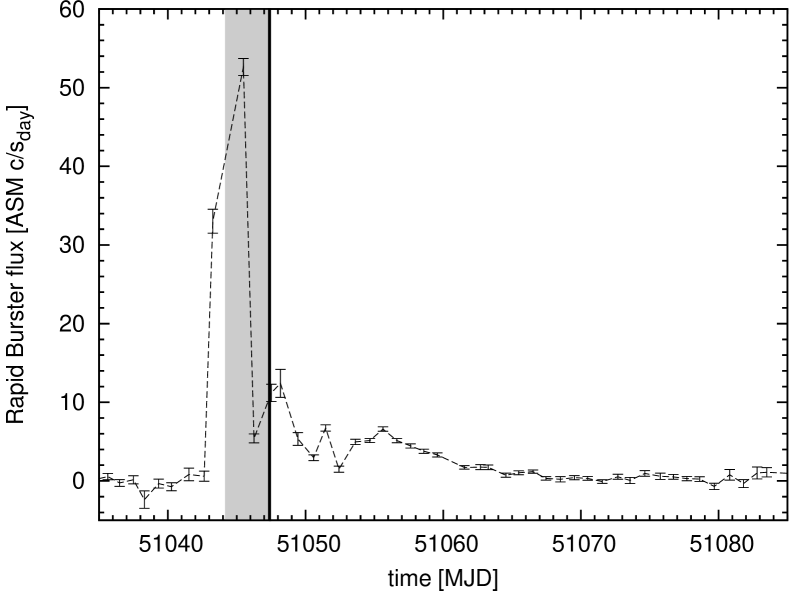
Six type I bursts have a peculiar double-peaked time profile. They are numbered 35, 36, 37, 58, 118 and 119, following their chronological position among the 125 type I burst in the PCA sample (B13). Three of the six double-peaked type I bursts subject of this paper occurred during one outburst which is shown in Fig. 1. The burst lightcurves (Fig. 2) were constructed employing 0.125-s resolution Standard 1 data. Typically, type I X-ray bursts of the RB show a two-component decay profile, with a steeper 10-s long initial decay and a shallower 100-s long tail, whose relative amplitude varies (B13). We constructed an average type I burst profile employing 22 bursts which we chose because they show the longest and brightest decays. This average burst profile is plotted against each burst in Fig. 2.
We define a few variables to help us quantify the morphology of the dip between the peaks. First, we applied an exponential fit to the first 200 s of the slow-decay portion of the burst after the second peak. We extrapolated this fit backwards to determine the time when it intercepts the first peak of the burst. The dip duration is the time between and the time of the second peak. The dip depth is the ratio of the number of photons lacking under the extrapolated curve during the interval over the total number of observed photons between the burst start- and end times (defined as in B13).
Time-resolved spectroscopy of the burst data was performed following the same procedure and tools as in B13. The particle and cosmic background were determined with ftool pcabackest and subtracted from all spectra. Response matrices were generated with pcarsp (v. 11.7.1). All active PCUs were employed, and a correction was applied for deadtime (although it is always small for the RB). Following the RXTE Cookbook prescription111See http://heasarc.nasa.gov/docs/xte/recipes/cook_book.html, the analysis was limited to the keV range, and a systematic error of 0.5% was added in quadrature to the statistical error of the flux in each channel. The burst data were divided into a number of time bins, varying in duration to keep the photon count, and hence the relative error on the derived quantities, approximately constant.
3 Results
3.1 The outbursts
Typical RB outbursts observed by RXTE prior to November 1999 tend to have a fast rise of 1 to 3 days, followed by an exponential decay with an e-folding decay time of about 8 days. Initially only type I bursts are observed. Type II bursts activity starts about 18 days into the outburst, when typically the bolometric flux decreased to a level of erg cm-2 s-1. The first type II bursts to appear (the so-called mode-0 type II bursts) are long (200-300 s), bright (up to 3000 c/s/PCU), flat-topped and short-lived, usually being visible for only a couple of days. We inspected all the light curves visually and only found 18 mode-0 type II bursts. Their rarity is due both to the short outburst fraction in which they are produced and to their long recurrence time, which for RB type II bursts is proportional to the fluence in a burst (the so-called relaxation-oscillator behaviour, Lewin et al. 1993). Shorter, more frequent (the so-called mode I and mode II) type II bursts then follow for another couple of weeks until the end of the outburst (Guerriero et al., 1999).
The August-September 1998 outburst during which bursts 35 through 37 appeared has an atypical lightcurve shape (see Fig.1), featuring a much faster decay, as well as much earlier mode-0 type II bursts, which could have started already during the outburst rise (Fox et al., 1998). Although no PCA coverage is available for more than three days before, the timing of the three double-peaked bursts seems also quite interesting. As can be seen in Fig.1, these double-peaked bursts occur during the initial phase of type II bursts, at a time when the source is experiencing rapid and large variations in flux (“reflares”). These considerations make us confident that the peculiar sequence of double-peaked type I bursts occurs close to the onset of the type II bursting activity.
Burst 58 was observed eight days after the start time of the PCA observations of the October 1999 outburst. In the time leading to it, twelve type I bursts are observed, and no type II bursts. No observation is available in the three days prior to burst 58, and not again until four days later. Short (mode-I) type II bursts are first observed ten days after burst 58. It seems plausible that this could be a more typical outburst, and that the short-lived phase of strong, long and flat-topped (mode-0) type II bursts was missed because of the rather limited coverage around the time it could have occurred.
Bursts 118 and 119 took place during the last RB outburst observed by RXTE, in January 2010. Less than 12 ks of PCA data are available for this outburst, in 5 observations spanning only 3 days. It is therefore difficult to assess to what extent the outburst has already decayed when these bursts occur. However, starting in 2000 all outbursts recurred within a shorter time and peaked at significantly lower intensities (Masetti 2002). Therefore, the initial type-I-only phase of the outburst can be significantly shorter. Judging from the ASM lightcurve, bursts 118 and 119 occurred no longer than 2 days after the beginning of the outburst. None the less, the presence of six more type I bursts, the burst recurrence time (see Sec. 3.2.1), the count rate in the persistent emission and the lack of type II bursts are all consistent with what is observed in the other four double-peaked bursts, which indicates a similar accretion state.
3.2 The double-peaked bursts
3.2.1 Lightcurves
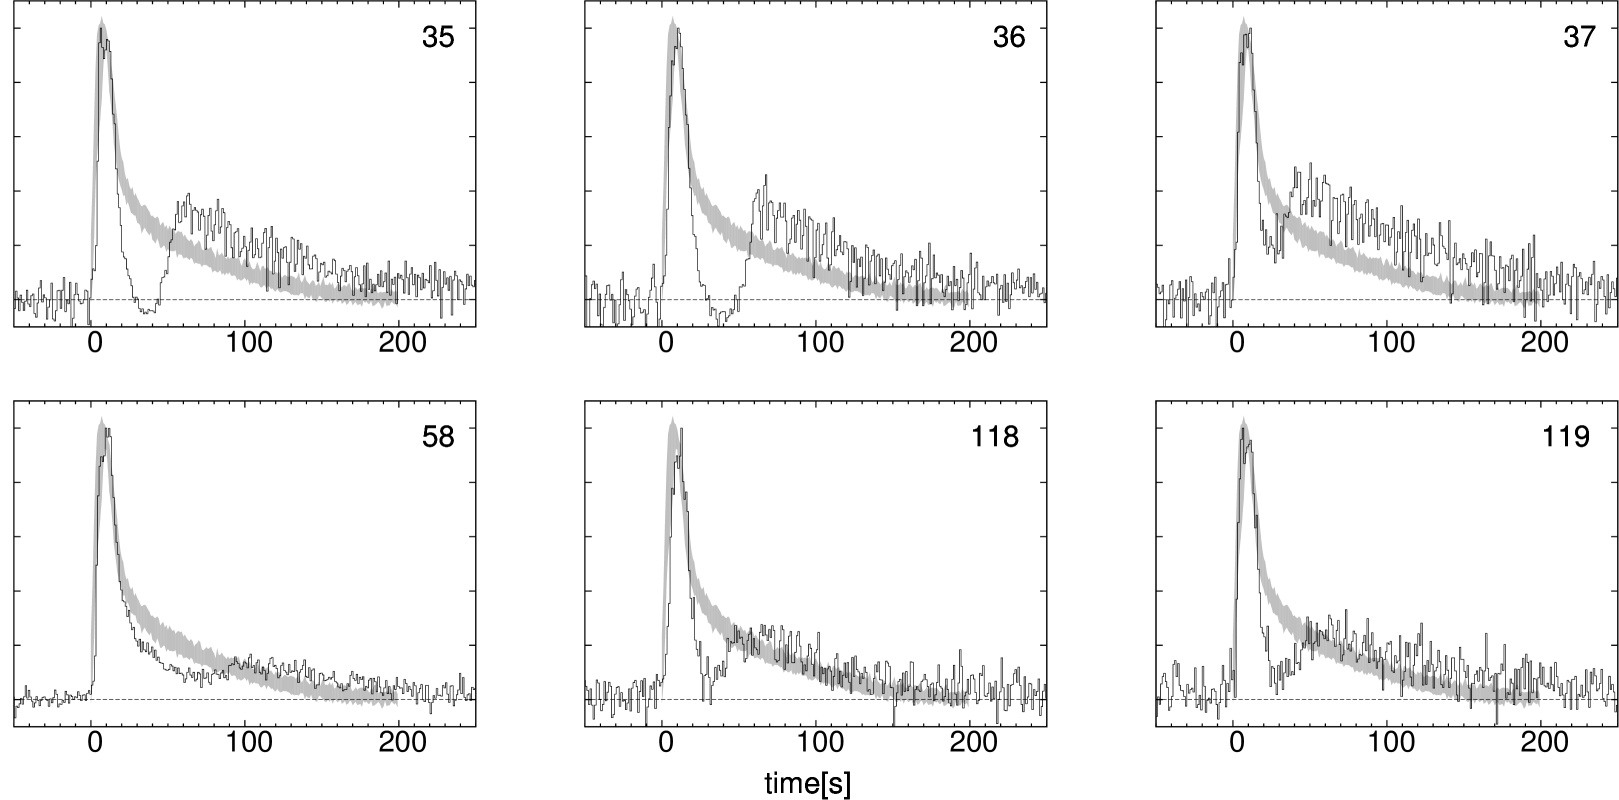
Fig. 2 shows the six double-peaked type I bursts under analysis and Table 1 lists their characteristics. Bursts 35 through 37 occurred with a recurrence time of about 2.2 ks, which is in the middle of the range of observed values of all RB type I bursts (B13). In bursts 35 and 36 the dip clearly lasts longer ( s) and the flux even drops to about 5 per cent below the pre-burst emission level. The dip in burst 37 is instead shorter, at 25 s, and the flux only drops to about 20 per cent of the net burst peak count rate. While the QPO is not visible during the dips of bursts 35 and 36, it is still present in that of burst 37.
The second peak is about 40 to 50 per cent as large as the first one. It is higher in burst 37, where it occurs earlier. The QPO modulation is clearly visible again in the second portion of the decays.
Looking at Fig. 2, it is clear that the post-dip portion of the decay is significantly brighter than in the rest of the type I bursts sample. As a result, the bursts are also longer. If however one only looks at the minima of the QPO, the decays might have durations comparable to those observed in the rest of the sample.
Burst 58 has a much dimmer second peak with respect to the other bursts, only about 15 per cent above the net burst count rate, which is however still significantly above the persistent emission. It features the longest dip, at s, going down to just about 4 per cent above the persistent emission, but still significantly above the noise fluctuations.
The recurrence time for bursts 118 and 119 is 1.8 ks, similar to what is observed for bursts 35–37. Their dips are about 30 s long, and briefly drop to count rates within 1 per cent of those observed right before the bursts. Like in burst 37, the QPO remains visible during the dip. Their second peaks are about 30 per cent as large as the first ones.
3.2.2 Spectral properties of the pre-burst emission
| Burst | Obs ID | ||||||
|---|---|---|---|---|---|---|---|
| [ erg cm-2 s-1] | [ erg cm-2 s-1] | [ erg cm-2] | [s] | ||||
| 35 | 30079-01-03-00R | 6.00.5 | 2.30.6 | 23.41.1 | % | 46 | 44% |
| 36 | 30079-01-03-00R | 5.70.4 | 1.80.4 | 20.71.1 | % | 46 | 56% |
| 37 | 30079-01-03-01R | 5.90.5 | 2.70.6 | 28.81.7 | % | 25 | 11% |
| 58 | 40433-01-02-00R | 9.50.5 | 1.10.3 | 29.91.5 | % | 72 | 26% |
| 118 | 95410-01-01-00 | 5.20.8 | 1.20.3 | 17.11.9 | % | 33 | 17% |
| 119 | 95410-01-01-00 | 5.40.8 | 1.20.3 | 19.12.1 | % | 30 | 16% |
All fluxes and fluences are bolometric. (a) First-peak flux. (b) Second-peak flux. (c) Burst fluence. (d) Fractional fluence before the dip. (e) Dip duration. (f) Dip depth, the fraction of photons lost to the dip. See Sec.2 for explanation.
Burst 35 and 36 were observed during a direct pointing, while burst 37 took place in an offset configuration (see Sec.2). The pre-burst spectrum of the RB was derived from the available 182 s-long segment of the lightcurve prior to burst 37. We fitted this with a model that is a good description of all RB non-burst data (B13) and consists of a disc black body (Mitsuda et al., 1984), a power law and a Gaussian line at 6.4 keV. Low-energy absorption by the interstellar medium was taken into account using the model of Morrison & McCammon (1983), with an equivalent hydrogen column density of cm-2 (Frogel, Kuchinski & Tiede 1995; Masetti et al. 2000; Falanga et al. 2004). The resulting blackbody temperature is keV, the apparent disc radius (with the source distance and the disc inclination; for the relation between the apparent and realistic inner disc radius, see Kubota et al., 1998) and the power-law photon index is . The goodness of the fit is for 46 degrees of freedom (dof). We call this the “RB spectrum”.
For the persistent emission prior to bursts 35 and 36, whose observations are contaminated by the nearby source 4U 1728-34, which dominates above 20 keV, simply renormalizing the RB spectrum according to the collimator responses (1.0 and 0.42 for the on- and offset pointings respectively) while leaving the other parameters frozen (under the assumption that the spectrum does not change significantly over the short time separating the observations) yields unacceptable fits [for burst 35, (51)]. We therefore also added an absorbed Comptonization model (; Egron et al. 2011), which we refer to as the “4U 1728-34 spectrum”. This fit gave (46) and 1.04(46) for the persistent-emission spectrum before bursts 35 and 36 respectively.
Analogously, a persistent emission spectrum was extracted from an offset pointing 1200 s after burst 58, corrected for the collimator response, and added to a component describing 4U 1728-34, for an overall good fit with (42). Finally, no offset observations were available near bursts 118 and 119. Therefore, we simply fit a model similar to the one described above (a “RB” plus a “4U 1728-34” component) to each of their pre-burst spectra, which gave (49) and 0.88(49) respectively.
3.2.3 Spectral properties of the bursts

Spectra during the bursts were modelled by the combination of black body radiation (leaving free temperature and emission area, to account for the varying burst emission, and multiplied by a model for interstellar absorption with ) and the model as found for the non-burst spectrum discussed above, keeping the parameters of the latter fixed. The spectral properties of the bursts are listed in Table 1.
Bursts 35 to 37 reach remarkably similar bolometric peak fluxes (in units of erg cm-2 s-1), from 5.70.4 to 6.00.5 in the first peak, while ranging from 1.80.4 to 2.70.6 in the second one. Burst 58 has instead a 50 per cent brighter first peak, at 9.50.5, and a dimmer second peak, at 1.10.3. Finally, bursts 118 and 119 have bright first peaks, comparable to those of bursts 35–37, and dim second peaks like that of burst 58. Such fluxes are all significantly sub-Eddington: for the quoted distance, the Eddington flux is 2.1 erg cm-2 s-1 for a “canonical” NS with mass accreting solar-composition material (hydrogen fraction ).
The total burst fluence spans from (17.11.9) erg cm-2 to (29.91.5) erg cm-2. Despite its brighter first peak, burst 58 is not more energetic than burst 37. This is again because there are differences in how the energy is distributed before and after the second peak: in bursts 35–37, 118 and 119, 27 to 35 per cent of the fluence is emitted before the dip, and 65 to 73 per cent after it. In burst 58 instead, 73 per cent of the fluence is emitted up to the dip minimum and only 27 per cent after it.
The results of the time-resolved spectroscopic analysis for burst 35 are plotted in Fig. 3. Two main conclusions can be drawn. Firstly, a decreasing temperature accompanied by an increasing radius while the flux drops out of the instrumental bandpass, the hallmarks of photospheric expansion (see e.g. Galloway et al. 2008), are not visible in the spectral evolution. This is also true during the other dips. Therefore, we conclude that they are not due to PRE.
Secondly, the goodness of fits worsens during the decay into the dips of bursts 35 and 36, until (dof) becomes as large as 8.5(27) and 4.2(26) respectively when the count rate is roughly at the pre-burst level. We therefore examined whether the spectrum in these dips is different from that in the persistent emission prior to the burst.
We attempted to fit the dip spectrum of burst 35 with three different models. The spectrum was extracted between 32 and 40 s after the burst start, when the flux is stable at about 5 per cent below the count rate of the persistent emission prior to the burst (see Fig. 2). The model that fitted the pre-burst emission (see Sec.3.2.2) was unacceptable for the burst dip, with (29). Letting the two additive components that make up the persistent emission (the RB and 4U 1728-34 spectra) free to vary in normalization also yielded an unacceptable fit, with (27). This means that the fit cannot be improved by simply allowing the normalization of the subtracted pre-burst spectrum vary, as successfully done by Worpel, Galloway & Price (2013) for PRE bursts. The energy dependence of the ratio of the model to the data rather suggests that the discrepancy results from an intrinsically different spectral shape.
We therefore fitted the dip by keeping the 4U 1728-34 spectrum frozen and leaving free to vary different components of the RB spectrum. The only solution with an acceptable fit required a column density (6.860.96), more than four times larger than the quoted value, which we normally employ for the pre-burst emission. The required blackbody temperature and radius were (2.030.06) keV and (2.551.04) km. This choice gave the best-fit model, with (26). Conversely, it was not applicable to the pre-burst emission, where it yielded (52).
As a final test, we extracted the spectrum of the persistent emission 1000 s after the burst start. In this stretch of data, the count rate is on average 2.5 per cent below the pre-burst emission. We tried to fit the spectrum of this post-burst emission with both the model for the pre-burst emission and for the dip, letting the “RB spectrum” free to vary in normalization while freezing all the other components. The pre-burst model gave (51) with a normalization 4.2 per cent lower, while the model that best fit the dip resulted in a (51), with a 2.5 per cent higher normalization.
Therefore, the dip has a truly different spectral shape than both the pre- and post-burst emission, even though they are roughly at the same count rate.
3.3 Timing analysis
| Obs ID | date | start time | rms | Q | significance | count rate | ||
|---|---|---|---|---|---|---|---|---|
| (UTC) | [ks] | [%] | [Hz] | [c/s/PCU] | ||||
| 30079-01-03a | 1998 Aug 22 | 08:10:36 | 8.7 | 3.93 | 2.290.21 | 0.250.004 | 16.64 | 569 |
| 40058-02-03 | 1999 Mar 19 | 18:12:43 | 17.2 | 1.91 | 1.420.43 | 0.200.016 | 5.33 | 320 |
| 40433-01-02b | 1999 Oct 08 | 12:06:23 | 3.0 | 2.28 | 0.430.13 | 0.200.017 | 12.13 | 555 |
| 50420-01-09 | 2001 Feb 16 | 14:12:45 | 11.7 | 5.03 | 0.790.10 | 0.260.011 | 11.68 | 266 |
| 95410-01-01c | 2010 Jan 15 | 20:41:33 | 2.8 | 2.61 | 2.010.66 | 0.180.006 | 5.74 | 405 |
Errors on the parameters were determined using . aIncludes bursts 35 to 37. bIncludes burst 58. cIncludes bursts 118 and 119.
A timing analysis of a dataset which included the double-peaked bursts 35 through 37 was already performed by Fox et al. (2001). However, their main focus was the search of high-frequency burst oscillations, and they calculated Fourier transforms of 1 s long data stretches, thereby ignoring the entire sub-Hz portion of the power spectrum.
For the timing analysis we used all Good Xenon and Event data, with a time resolution of and s, respectively. The Good Xenon data were rebinned to the same resolution as the Event data. No background subtraction or dead-time correction was applied to the data before calculating the power spectra, but type I and II bursts were removed. Following a well-established procedure (see e.g. Klein-Wolt, Homan & van der Klis 2004) we determined the Poisson noise using the formula by Zhang et al. (1995) and then shifted it to the featureless level between 3072 and 4096 Hz, a region in the power spectra dominated by photon counting noise. This mean value was then subtracted from the power spectra. The background was calculated for each observation (Obs ID) with the ftool pcabackest over the entire energy range. We used 128 s-long segments to calculate power spectra with no energy selection. The frequency boundaries for the power spectra are therefore 1/128 Hz and 4096 Hz. The power spectra were normalized to the relative rms (van der Klis, 1995) which yields the power density in units of (rms/mean)2 Hz-1.
We scanned all the PCA power spectra. Each power spectrum was inspected by eye to look for the presence of the LF QPO. When it is present, we fit the logarithmically-sampled low frequency ( Hz) portion of the spectrum with a sum of Lorentzian components, following Belloni, Psaltis & van der Klis (2002). Each Lorentzian peaks at a frequency
| (1) |
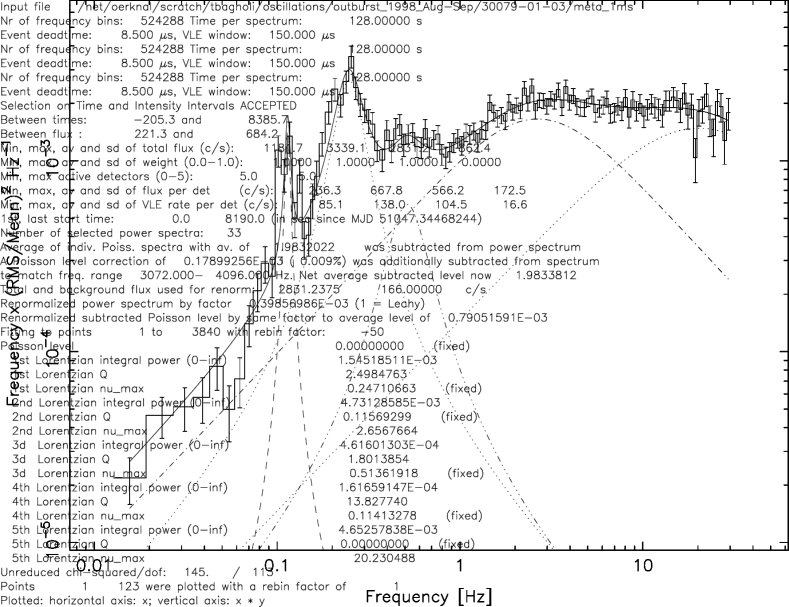
with centroid frequency and coherence factor corresponding to the ratio of to the FWHM. An example of these fits can be seen in Fig. 4. We then integrated the fractional rms of each Lorentzian over the whole frequency range, and over smaller energy bands, to quantify the energy dependence of the rms (see Fig. 5). Table 2 lists all observations in which the 0.25 Hz QPO was found, and the QPO properties.
We detect the QPO in five distinct Obs IDs, across five different outbursts. They all feature either double-peaked type I bursts or the kind of type II bursts (long, bright, flat-topped) which are the first to appear and are only present in a short phase of an outburst decay (see Sec. 3.1). The count rates vary by a factor of two across these observations. The fits yielded acceptable (dof), varying between 0.92(118) and 1.19(108), across the different observations. The significance of the detection, defined as the ratio of the integrated power over its negative error varies between 5.33 and 16.64 .
The power spectrum of the observation which includes bursts 35 through 37 is shown in Fig. 4. This is the most significant detection of the 0.25 Hz QPO. Besides the main feature an accompanying QPO is visible at 0.1 Hz. Also present are QPOs that peak at 0.5 and 3 Hz, which are known to appear in the run-up to a large type II burst (Stella et al., 1988). The former is probably in a harmonic relation to the 0.25 Hz QPO.
Our newly discovered QPO, relatively well fit by a Lorentzian, covers a relatively narrow frequency range in the different observations, between 0.18 and 0.26 Hz. Its rms amplitude varies between (1.910.83) to (5.031.47) per cent. At its peak, it is also clearly observed in the time domain (see Fig. 2). As can be seen in Fig. 5, the amplitude seems to grow monotonically over the 2–17 keV (channels 5-64 of the PCA) energy range. The error bars are however quite large, and a constant value could also fit the rms- relation. We performed an F-test to compare the fits for a constant value and a linear dependence on energy. The linear function yields a better fit, and the probability of the improvement being due to random chance is . We therefore consider the growing trend real. The coherence factor is rather low, between 0.43 and 2.29. However, we must stress that the feature is sometimes observed to increase in frequency during the intensity decrease that precedes the longest type II burst. This degrades its coherence in our fit, which is averaged over an entire observation.
The weaker 0.1 Hz QPO feature was only detected on the same date as the double-peaked bursts 35–37, while it is not present in the other power spectra, and it is poorly fit by a Lorentzian. Therefore, we cannot establish whether it might be in a harmonic relation with the 0.25 Hz oscillation, nor can we exactly quantify its amplitude or coherence. It is however quite a narrow feature, and it seems weaker than the 0.25 Hz QPO.
We did not fit the power spectra of the remainder of the observations, but a visual inspection of the power spectra indicated that the QPO disappears as the rare, 300 s long, flat-topped type II bursts (which are the first to appear in an outburst, Guerriero et al. 1999) evolve into shorter, more frequent ones at lower count rates.

3.4 The colour-colour diagram
There are 335 ks of non-contaminated exposures with 4U 1728-34 outside the field of view and the active RB inside. We employed 16 s time resolution standard 2 data for these observations to calculate X-ray colours.
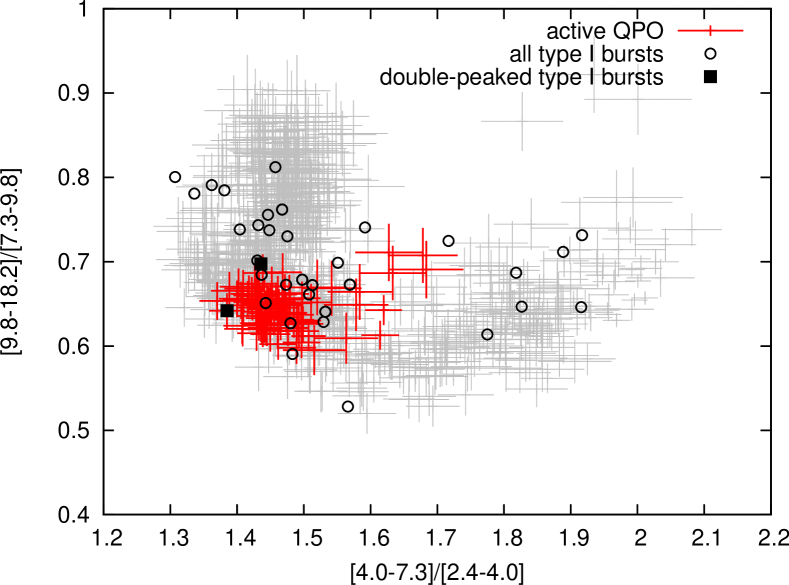
Following Homan et al. (2010), soft and hard colours are defined as the ratio of counts in the 4.1-7.3 keV to that in the 2.5-4.1 keV band, and in the 9.8-18.1 keV and 7.3-9.8 keV bands, respectively. Type I and II bursts were removed, background was subtracted, and dead-time corrections were made. The energy-channel conversion was determined from the pca_e2c_e05v01 table provided by the RXTE team. In order to correct for gain changes as well as for differences in effective area between the PCUs, we normalized our colours to the corresponding Crab source colour values (van Straaten, van der Klis & Méndez, 2003) that are closest in time and in the same RXTE gain epoch, to make sure the same high-voltage settings of the PCUs apply. Continuous stretches of data points were combined until the relative error of each colour was below 5 per cent. Finally, we flagged the colours closest in time to the double-peaked bursts 37 and 58. The former measurement is also very close to bursts 35 and 36. Bursts 118 and 119 have no close-by non-contaminated exposure.
Fig. 6 shows the resulting colour-colour diagram (CCD). Two clearly distinct branches are present which indicate that the RB is an atoll source, with the so-called banana and island states (Hasinger & van der Klis, 1989). Type I bursts take place in a wide range of mass accretion rates, as already shown by B13. Interestingly, the double-peaked bursts and the accompanying 0.25 Hz QPO concentrate at the vertex where the RB transits from the lower banana to the island state.
4 Discussion
4.1 Observational summary
In a comprehensive analysis of all RXTE data on the RB we found six type I X-ray bursts during three outbursts that feature a dip that is not due to photospheric radius expansion, resulting in the appearance of two peaks in the light curves. The dips are relatively long with durations between 25 and 72 s and ingresses and egresses that have a typical time scale of 10 s. In two bursts, the dips drop for about 10 s below the pre-burst flux level, by up to 5%. The dip is therefore also in the persistent emission, although never outside a burst. When that happens, the spectral shape is different from the pre-burst spectrum with an increase of the absorption column density by a factor of 4. After the burst, the persistent emission recovers its pre-burst spectral shape. Such a peculiar and repetitive morphology of type I burst light curves has, to the best of our knowledge, never been observed before (see Sec. 4.2).
With respect to the other type I bursts from the RB, the duration of the double-peaked bursts seems longer and the decays after the second peak brighter, but that may be due to the addition of the QPO on the tail and not on the first peak. The fluence of the bursts ranges between 17.12 and 28.80 erg cm-2. This compares with 17.6 to 51.5 erg cm-2 for the other 121 bursts (B13). If the dips hide part of the actual fluence, the total fluence would be between 10 and 50% larger, varying between about 20 and 37 erg cm-2. Instead, the pre-dip fluence alone is between 4.80 and 9.01 erg cm-2 which is significantly below the lowest value for all other bursts. These ranges are a strong indication that the second peaks are thermonuclear in nature and not, for instance, completely due to accretion. The other burst properties, like peak flux, rise and recurrence times are quite unremarkable compared to the rest of the sample. However, it must be noted that the recurrence time of the bursts spans a rather limited range, between 1.7 and 2.2 ks, and that they appear at similar persistent count rates. B13 showed that the RB produces bursts over a very large range of persistent fluxes, and that the recurrence time scales accordingly. It seems therefore likely that the double-peaked bursts are peculiar to a limited range of mass accretion rates.
RXTE data of the RB suffer from contamination of another bright LMXB in the same field of view: 4U 1728-34. This does not affect the analysis of X-ray bursts since those of the RB are easily discerned from those of 4U 1728-34, but the analysis of the non-burst radiation is seriously affected, which precluded thus far the identification of the RB as an atoll or Z-source (Rutledge et al., 1995). However, a portion of the observations were pointed such that 4U 1728-34 is outside the field of view, while the RB remains inside, though at a less favorable off-axis angle. Thanks to the large size of the dataset collected by RXTE during its mission, we generated a CCD from these data and are able, for the first time, to identify the RB as an atoll source with unambiguous ‘island’ and ‘banana’ branches (Hasinger & van der Klis, 1989).
The double-peaked bursts seem to occur at a phase in the decay of the transient outburst when type II bursts commence, as signalled by the presence of very energetic, flat-topped and long type II bursts (Guerriero et al., 1999). Furthermore, the double-peaked bursts are coincident with a special location in the CCD - the vertex where the source transits between the banana and the island state, indicating a change in the accretion-flow geometry (van der Klis, 2006).
The non-burst light curve also shows a peculiar feature, around the double-peaked bursts: a QPO with a typical frequency of about 0.25 Hz. This QPO is present before and after the bursts, and during the second peak of the bursts. The amplitude peaks at 5.031.47% fractional rms. Notably, it is absent during the first burst peak and the deep dips. It remains visible during shallow dips with a smaller amplitude. When compared to other type I bursts from the RB and considering the depth of the deepest dips, this strongly suggests that the QPO represents an additional radiation component to the burst and the persistent emission.
We searched all RXTE data on the RB and found a total of five statistically significant detections (see Sec. 3.3). The feature is present in all the consecutive power spectra that make up each observation and it also always lies in the same portion of the CCD across five different outbursts, at the transition between the island and banana states. Furthermore, all the observations featuring the 0.25 Hz QPO coincide with either double-peaked bursts or the kind of type II bursts (long, bright, flat-topped) which only appear in a short-lived phase of an outburst decay (Guerriero et al., 1999).
The observations of mid-burst dips during type-I X-ray bursts and the simultaneous behavior of the 0.25 Hz QPO at a state transition are unique. How do they come about and how are they related to each other? Why do they take place during a state transition? Are they related to the unique type II bursting behavior of the RB and, if so, can they provide us further constraints on the origin of that behavior?
| Model | Bursts | QPO | Accretion state | |||||
|---|---|---|---|---|---|---|---|---|
| Double peaks (a) | Spectrum(c) | rms | rms/Energy(d) | Soft/Hard(e) | Type II burst(f) | |||
| Unburnt layer | Y | P | N | … | … | … | … | … |
| Reaction chain stalling | Y | N | N | … | … | … | … | … |
| Equatorial stalling | Y | P | N | … | … | … | P | … |
| Magnetic confinement | Y | P | N | … | … | … | N | … |
| Burst-induced corona | N | N | Y | … | … | … | … | … |
| Marginally-stable burning | … | … | … | N | Y | N | Y | … |
| High inclination (dipper) | Y | Y | Y | Y | Y | N | N | … |
| Disc-magnetosphere instability | … | … | … | Y | N | Y | N | Y |
| Low inclination, two channels | Y | P | Y | P | … | … | Y | P |
The table compares the properties of the bursts, the QPO and the source state against the predictions made by the various models discussed in Sec.4. Y/N (yes/no) indicates that the model can/cannot explain the property in a given column. The symbol P (possible) indicates that the model might be able to explain the property if certain conditions are met. An empty field indicates that the model makes no specific prediction for that property. (a)Non-PRE, double-peaked bursts; (b)dip duration; (c)enhanced absorption in the dip spectrum and dip going below the persistent flux level; (d)QPO fractional amplitude growing with energy; (e)appearance of the dip and the QPO only at the soft/hard transition; (f)appearance of the dip and QPO at the same time as the first type II bursts.
4.2 Nature of the dips
Other LMXBs exhibit double-peaked bursts that are not due to PRE. For example 4U 1636-53 shows bursts with two (Sztajno et al., 1985; Bhattacharyya & Strohmayer, 2006a, b) and even three peaks (van Paradijs et al., 1986; Zhang et al., 2009). However, the time scales for this source are different than for the RB (the peaks are separated by at most 5 s) and the flux never drops below the pre-burst emission. The similarities are that the peak flux is also a factor of 2 to 3 below the Eddington limit, the inferred mass accretion rate is relatively large and the bursts concentrate around the vertex of the island/banana branch of the CCD. Non-PRE double-peaked type I bursts have also been observed from 4U 1608-52 (Penninx et al., 1989), GX 17+2 (Kuulkers et al., 2002) and 4U 1709-267 (Jonker et al., 2004), all with durations shorter than 20 s.
There is great diversity in the observations of other sources, precluding a single explanation for all irregularities. The double-peaked bursts in the RB are no exception: they too are unique, particularly because of relatively long time scales for the dip ingress and egress and the simultaneous QPO behavior. We will now discuss several explanations for the double-peaks phenomenon in the other sources.
4.2.1 Two-stage energy release on the surface?
One possibility is that the multiple peaks are the result of a variation in either the rate at which the energy is transported to the surface of the NS, or in the rate at which energy is released in the flash. A shear instability could mix layers which have undergone a thermonuclear flash with unburnt material lying above them (Fujimoto et al., 1988), or there could be a waiting point in the rp-processes (Fisker, Thielemann & Wiescher, 2004). However, it is difficult to keep unburnt fuel above burnt material without the two mixing (Spitkovsky, Levin & Ushomirsky, 2002), or to have the burning reaction chain stalling as long as the dips are sometimes observed to last (Bhattacharyya & Strohmayer, 2006a).
Other explanations discussed in literature involve stalling of the burning front. For a weak burst with high-latitude ignition, the spreading of the flame could stall at the equator if that is where most of the disc material is accreted (Bhattacharyya & Strohmayer, 2006a). Otherwise, a temporary boosting of the magnetic field , due to the motion of the fluid upon ignition, could temporarily confine the burning region (Cavecchi et al., 2011). Obviously is not expected to be different for the double-peaked bursts and the rest of the RB bursts, nor is the fuel composition, given their similar timescales and energetics. The ignition location and the mass-accretion rate are therefore the remaining possible triggers for a confining mechanism that could give rise to the double peaks. Perhaps high-latitude ignition could be rare enough to only happen in 6 bursts out of 125, although these are not among the weakest in the sample as observed for double-peaked bursts in 4U 1636-53 (Bhattacharyya & Strohmayer, 2006a). On the other hand, the possibility of magnetic confinement is at odds with the fact that the RB double-peaked bursts occur in a limited range of intermediate mass-accretion rates, with single-peaked bursts being observed at both higher and lower .
4.2.2 Transient obscuration from the disc?
Generally speaking, all the scenarios discussed above revolve around phenomena confined to the surface. None of them can therefore explain why, in bursts 35 and 36, the flux drops below pre-burst levels while the absorption column density increases. The accretion flow, responsible for the non-burst emission, must clearly also be affected.
For example, the multi-peaked structure could result from scattering of the X-rays by material evaporated from the accretion disc during the flash, forming a burst-induced accretion disc corona. Models seem however to require Eddington-limited bursts (Melia & Zylstra, 1992), and indeed observations of radiative or dynamical interactions with the accretion disc have so far been limited to very energetic PRE bursts (in’t Zand et al., 2011, 2013; Degenaar et al., 2013). Instead, the double-peaked bursts in the RB are sub-Eddington by at least a factor of 2, implying that the burst flux delivers insufficient radiation pressure to influence the accretion flow. Even resorting to beaming, to raise the flux in a direction outside the line of sight to a sufficient level, the problem remains that the time scales are dynamical in nature and much shorter than those observed (e.g. Melia & Zylstra, 1992).
The energetic properties of these bursts are unremarkable with respect to the rest of the type I sample, which makes explaining their exceptionality difficult. None the less, the dips seem to be initiated by the bursts, responding to the burst with a delay of about 10 s. As a way around this, the origin of the dips might lie in a short-lived, peculiar geometry of the inner accretion flow rather than in the bursts themselves.
For a scenario that is independent of burst properties and features longer dips, one can look at dipping sources. These show periodic dips in their light curves that are thought to be caused by periodic obscuration of the central source by a structure formed in an interplay between the gas stream from the companion and the accretion disc (White & Swank, 1982). Therefore, they have generally been inferred to be at inclination angles larger than (Frank, King & Lasota, 1987), unless the splash traverses over the compact object to the other side of the accretion disc (e.g., Armitage & Livio, 1998).
The depth, duration and spectral properties of the dips vary from source to source and from cycle to cycle (Parmar & White, 1988). The time scale of the dips in the RB is similar to that shown by some dipping sources (e.g. Kitamoto et al., 1984), and, as we said, the fact that the dips go twice below the pre-burst flux indicates that, as in dipping sources, the persistent emission is also partially obscured. Most importantly, the RB dips spectrum is consistent with a larger portion of the flow coming in the line of sight. Unlike in all other sources, however, in the RB the dips only occur during bursts. Likely this means that the inclination angle is lower, since at a high inclination angle dips in the persistent emission should also be visible.
None the less, obscuration phenomena of the surface might be possible even at low inclinations. 3D MHD simulations by Romanova et al. (2008, 2012) and Kulkarni & Romanova (2008) showed that two different regimes of accretion on magnetized stars like AMXPs are possible in presence of a tilt () between the rotational axis and the magnetic dipole. At large , in what they call the “boundary layer” regime, matter can accrete directly through the magnetosphere via narrow and tall “tongues” due to Raleigh-Taylor instability, forming a belt-shaped hot region on the surface of the star. Instead at lower , in the so-called “magnetospheric regime”, the accretion flow forms few (two or four) ordered funnel streams toward the magnetic poles.
If these predictions are correct, for a low inclination the appearance of obscuring funnels is indeed to be expected as goes down. Furthermore, as these funnels are nothing but transient accretion episodes at low , they might help explain the onset of the type II burst activity at the transition from the soft to the hard state. However, if this change in geometry is behind the obscuration, it remains unclear why double peaks would not be an overall characteristic of all bursts in the low state, and also whether the a burst-funnel interaction could reproduce the observed dip durations.
4.3 Nature of 0.25 Hz QPO
QPOs in LMXBs, no matter how difficult to explain, are always ascribed to a phenomenon in the accretion flow (see van der Klis, 2006, and references therein). The only exceptions are mHz QPOs which are thought to be due to marginal nuclear burning on the NS surface (Revnivtsev et al. 2001; Heger, Cumming & Woosley 2007). However, those QPOs are interrupted by type I X-ray bursts (Altamirano et al., 2008) and have frequencies one to two orders of magnitude smaller than the 0.25 Hz QPOs in the RB. Thus, it is most likely that the dipping behavior and the 0.25 Hz QPO in the RB are related to the accretion flow.
We explore in this section two possible scenarios to explain the QPO: periodic obscurations and modulation of the accretion flow via interactions between the disc and the magnetosphere.
4.3.1 QPOs in dipping sources
At least three dipping bursting LMXBs (XB 1323-619, Jonker et al. 1999; EXO 0748-676, Homan et al. 1999; and 4U 1746-37, Jonker et al. 2000) show 1 Hz QPOs. Their rms amplitudes are about 10 per cent, and the energy dependence of the rms amplitude is nearly flat. The fractional rms amplitude was found to be consistent with being constant during the persistent emission, the X-ray dips and, most importantly, type I X-ray bursts. The fact that the 1 Hz QPOs persist during a dip with unchanged rms indicates that they are formed in a region at a smaller radius than that where the obscuration takes place.
It seems therefore likely that the 1 Hz QPOs detected in dipping LMXBs are caused by matter periodically obscuring our line of sight to the NS, perhaps due to Lense-Thirring precession of a tilted inner accretion disk around a compact object (Homan, 2012). Despite the rough match in frequency and amplitude, no dips have ever been observed in the persistent emission of the RB outside a burst, which seems at odds with a system viewed at a high inclination. Also, the 1 Hz QPOs of dipping sources span a much larger range of accretion states, whereas the QPO in the RB appears to be confined to the transition between the island and banana states. Therefore we consider this scenario not likely to explain the 0.25 Hz QPO in the RB.
4.3.2 QPOs from disc-magnetosphere interactions
First reported by van der Klis et al. (2000), the 1 Hz QPO that is observed in the final stages of the outbursts of SAX J1808.4-3658 was extensively studied by Patruno et al. (2009). They report a QPO frequency in the (0.8-1.6) Hz range, and an rms amplitude that grows monotonically with energy up to about 17 keV. A 1 Hz QPO of similar properties has been reported from NGC 6440 X-2 by Patruno & D’Angelo (2013), who suggest this feature has the same origin in both these AMXPs.
The most likely origin for the QPO is an accretion flow instability arising at the inner edge of the disk (Patruno et al., 2009). Among the variety of mechanisms at hand, the most promising seems to be the one first proposed by Spruit & Taam (1993) and further explored by D’Angelo & Spruit (2010, 2012). In this model an instability can develop when the magnetosphere truncates the inner accretion disc at a radius that is outside but still close to the corotation radius . A new disk solution known as “dead disc” is then found (Sunyaev & Shakura, 1977; D’Angelo & Spruit, 2010, 2012) which is alternative to the “propeller” regime (Illarionov & Sunyaev, 1975), where the transfer of angular momentum effectively expels matter from the system, and the inner disc radius keeps increasing as decreases. When the transfer of angular momentum happens from the neutron star to the disk, spinning down the neutron star and changing the radial gas density distribution at the inner disc region without matter expulsion. In a dead disc does not evolve far from and the matter keeps flowing in from the outer disc regions piling up there. If certain conditions are met at the magnetosphere-disk interaction (D’Angelo & Spruit, 2010, 2012) a critical pressure is eventually reached under which the gas slips inside , thereby initiating a sudden accretion event. After that, the accumulated mass reservoir is depleted, and a new cycle begins.
This instability is a potentially interesting model for the 0.25 Hz QPO in the RB. The frequency of the instability depends on the viscous timescale at the inner disk edge, which in turn depends on the mass accretion rate and on the location of the inner disk (see e.g., Eq. 9 in Patruno & D’Angelo 2013). Unfortunately, the inner disk radius is not known for the Rapid Burster, since neither the spin frequency of the neutron star nor the strength of its magnetic dipole are known.
Also, a slightly growing rms- relation is observed in the RB, which is also observed in the other two sources. While the increase is weaker than in SAX J1808.4-3658 or NGC 6440 X-2, this can be explained with the smaller fractional amplitude of the QPO in the RB. Patruno & D’Angelo (2013) explain the monotonic increase in rms with energy in SAX J1808.4-3658 and NGC 6440 X-2 arguing that as the instability is caused by changes in , and the latter change the density and temperature of the corona where the photons are upscattered, the QPO fluctuations will translate to a varying hardness of the spectrum, making the high energy flux more variable than the low energy one. In case of a strong persistent emission, as is the case in the RB, the effect will obviously be weaker.
Differences are, however, clearly present. The QPO in the two AMXPs cannot be fit with a Lorentzian because of its fast decline in power at low frequencies. This is however not seen in the RB QPO. Furthermore, the rms amplitude of the QPO is more than one order of magnitude larger in the two other sources than in the RB. This is because nearly no accretion takes place during the QPO minima in SAX J1808.4-3658 and NGC 6440 X-2, which show the oscillation at moderately low luminosities. The higher count rates and the different QPO shape observed in the RB are therefore challenging to this scenario. Even though the results from D’Angelo & Spruit (2010) show that for certain ranges of parameters accretion can in fact continue to take place in the minima of the QPO, the instability is predicted to produce a much larger modulation of the mass accretion rate than observed in the RB, when at the time of the double-peaked bursts , roughly one order of magnitude larger than what observed in the two other sources at the time of the appearance of the QPO there.
If however we again invoke a two-channel accretion (see Sec. 4.2), with a polar and an equatorial channels, one controlled by the instability and the other one unaffected by it, the lower amplitude would naturally follow. For example, while the centrifugal barrier could act to modulate the equatorial accretion, matter could be leaking from above and below it, and accrete along the lines.
Also involving two-channel accretion, the disc-magnetospheric interactions described in Romanova et al. (2008) and Kulkarni & Romanova (2008) can as well explain the appearance of periodicities in the lightcurve, via accretion-induced hotspots. While at high sporadically forming “tongues” hit the star in random places, so that the light curve is irregular, at low the funnels driving matter from the disc to the magnetic poles are relatively stable, so that the position of the hot spots is almost constant, resulting in a modulation of the lightcurve. Again, the problem with this model is that it does not explain why the QPO is short-lived, rather than being an overall characteristic of the island state.
4.4 Linking the dips and the QPO
In Table 3 we list the possible scenarios for the dips and the QPO, and which relevant observables they are capable of explaining.
The only model that is not ruled out by any observable involves a relatively short-lived accretion state consisting of two different accretion channels, an equatorial and a polar one, in a system viewed at low inclination. As part of the inner accretion flow in this particular state goes along the magnetic field lines to the NS poles, it is then easier for material to come in the line of sight if the inclination angle is low, and for the burst to disturb the accretion flow, thereby causing the flux to dip below the pre-burst level, even if the burst flux is sub-Eddington.
Since the 0.25 Hz QPO disappears during some of the dips, its place of origin would also seem to be obscured by the same material. This suggests that the QPO originates close to the NS and closer than the X-ray emitting part of the accretion disk. The latter region probably reaches out to 104 km (Mitsuda et al., 1984; Makishima et al., 1986), so the obscuring material would have to be substantially closer than that. If the QPO originates in the equatorial flow, the accretion channel along the magnetic field could be disturbed by the burst so that, given the low inclination, the radiation from the NS surface and the equatorial flow would be obscured, making the dips deeper than the pre-burst emission and causing the temporary disappearance of the QPO. If instead the QPO originates in the disrupted polar flow, its disappearance at the time when the dips are deeper than the pre-burst emission would still naturally follow.
To match the observations, this peculiar configuration should be short-lived, appearing roughly at the same time when the type II burst do, and disappearing within days. It is generally thought that in the banana state, at larger mass-accretion rates, a geometrically thin and optically thick disc probably extends down to very close to the NS surface, whereas the lack of dips in the island state, at lower mass-accretion rates, could be due to a quasi-spherically symmetric accretion via an optically thin corona (see e.g. review by Done, Gierliński & Kubota, 2007). The rarity of the double-peaked bursts and of the 0.25 Hz QPO would then match the fact that they occur in a particular accretion state of the RB, when part of the accretion flow is starting to become diverted to the type II bursting mechanism.
5 Conclusions
We have reported the coincident observation of non-PRE, double-peaked type I bursts and a LF QPO with a frequency of about 0.25 Hz. They occur at the transition from the banana to the island state, when the geometry of the accretion flow is expected to change. This transition also coincides with the appearance of type II bursts. Despite being sometimes at roughly the same count rate as the pre-burst persistent emission, the dip between the two peaks has a distinctively different spectrum, with a much larger hydrogen column density required to fit the data. This is suggestive of some kind of temporary obscuration of the NS surface. Also, the dips in two bursts go below the pre-burst emission level, meaning part of the accretion flow is also obscured, or perhaps even disrupted. No dips are ever observed in the persistent emission outside a burst.
We have explored several models to explain the dips, the QPO, and the peculiar accretion state in which they appear, including confining mechanisms on the NS surface, obscuration of the surface and inner accretion flow in a high-inclination system, and accretion instabilities borne out of the interaction between the accretion disc and the magnetosphere.
Although no single model can explain all the observables, we favour a two-channel accretion state, transitional between the soft and hard state. Mass accretion onto the magnetic poles would allow for the burst to disturb the accretion flow even if the burst flux is sub-Eddington. If the source is viewed at a low inclination, the temporary disruption of the polar accretion channel by the burst could then obscure the NS surface, which would cause the flux to go below its pre-burst level, and in some cases even the inner equatorial accretion flow. If the instability causing the QPO controlled the equatorial channel, the disappearance of the QPO in the deepest dips could also be explained.
Further investigation is necessary to develop this model beyond this qualitative picture. It remains to be seen whether such an accretion geometry could indeed be sustainable, confined to a very narrow range of accretion rates, and whether this scenario could reproduce the fairly long dips. The difficulty of constraining such a model notwithstanding, the obscuration that is responsible from the dip must be connected with the disc instability that is responsible for the QPO and the type II bursts.
Acknowledgments
We wish to thank Diego Altamirano, Yuri Cavecchi, Jeroen Homan, Daniela Huppenkothen and Hauke Worpel for useful discussions and occasional guidance offered during the preparation of this paper. TB and AW are members of an International Team in Space Science on type I X-ray bursts sponsored by the International Space Science Institute (ISSI) in Bern, and we thank ISSI for hospitality during part of this work.
References
- Altamirano et al. (2008) Altamirano D., van der Klis M., Wijnands R., Cumming A., 2008, ApJ, 673, L35
- Armitage & Livio (1998) Armitage P. J., Livio M., 1998, ApJ, 493, 898
- Baan (1977) Baan W. A., 1977, ApJ, 214, 245
- Baan (1979) Baan W. A., 1979, ApJ, 227, 987
- Bagnoli et al. (2013) Bagnoli T., in’t Zand J. J. M., Galloway D. K., Watts A. L., 2013, MNRAS, 431, 1947
- Belloni et al. (2002) Belloni T., Psaltis D., van der Klis M., 2002, ApJ, 572, 392
- Bhattacharyya & Strohmayer (2006a) Bhattacharyya S., Strohmayer T. E., 2006a, ApJ, 636, L121
- Bhattacharyya & Strohmayer (2006b) Bhattacharyya S., Strohmayer T. E., 2006b, ApJ, 641, L53
- Cavecchi et al. (2011) Cavecchi Y., Patruno A., Haskell B., Watts A. L., Levin Y., Linares M., Altamirano D., Wijnands R., van der Klis M., 2011, ApJ, 740, L8
- Cornelisse et al. (2003) Cornelisse R., in ’t Zand J. J. M., Verbunt F., Kuulkers E., Heise J., den Hartog P. R., Cocchi M., Natalucci L., Bazzano A., Ubertini P., 2003, A&A, 405, 1033
- D’Angelo & Spruit (2010) D’Angelo C. R., Spruit H. C., 2010, MNRAS, 406, 1208
- D’Angelo & Spruit (2012) D’Angelo C. R., Spruit H. C., 2012, MNRAS, 420, 416
- Degenaar et al. (2013) Degenaar N., Miller J. M., Wijnands R., Altamirano D., Fabian A. C., 2013, ApJ, 767, L37
- Done et al. (2007) Done C., Gierliński M., Kubota A., 2007, A&A Rev., 15, 1
- Egron et al. (2011) Egron E., di Salvo T., Burderi L., Papitto A., Barragán L., Dauser T., Wilms J., D’Aì A., Riggio A., Iaria R., Robba N. R., 2011, A&A, 530, A99
- Falanga et al. (2004) Falanga M., Farinelli R., Goldoni P., Frontera F., Goldwurm A., Stella L., 2004, A&A, 426, 979
- Fisker et al. (2004) Fisker J. L., Thielemann F.-K., Wiescher M., 2004, ApJ, 608, L61
- Fox et al. (1998) Fox D., Smith D., Lewin W., Rutledge R., 1998, The Astronomer’s Telegram, 32, 1
- Fox et al. (2001) Fox D. W., Lewin W. H. G., Rutledge R. E., Morgan E. H., Guerriero R., Bildsten L., van der Klis M., van Paradijs J., Moore C. B., Dotani T., Asai K., 2001, MNRAS, 321, 776
- Frank et al. (1987) Frank J., King A. R., Lasota J.-P., 1987, A&A, 178, 137
- Frogel et al. (1995) Frogel J. A., Kuchinski L. E., Tiede G. P., 1995, AJ, 109, 1154
- Fujimoto et al. (1988) Fujimoto M. Y., Sztajno M., Lewin W. H. G., van Paradijs J., 1988, A&A, 199, L9
- Galloway et al. (2008) Galloway D. K., Muno M. P., Hartman J. M., Psaltis D., Chakrabarty D., 2008, ApJS, 179, 360
- Guerriero et al. (1999) Guerriero R., Fox D. W., Kommers J., Lewin W. H. G., Rutledge R., Moore C. B., Morgan E., van Paradijs J., van der Klis M., Bildsten L., Dotani T., 1999, MNRAS, 307, 179
- Hasinger & van der Klis (1989) Hasinger G., van der Klis M., 1989, A&A, 225, 79
- Heger et al. (2007) Heger A., Cumming A., Woosley S. E., 2007, ApJ, 665, 1311
- Hoffman et al. (1978) Hoffman J. A., Marshall H. L., Lewin W. H. G., 1978, Nat, 271, 630
- Homan (2012) Homan J., 2012, ApJ, 760, L30
- Homan et al. (1999) Homan J., Jonker P. G., Wijnands R., van der Klis M., van Paradijs J., 1999, ApJ, 516, L91
- Homan et al. (2010) Homan J., van der Klis M., Fridriksson J. K., Remillard R. A., Wijnands R., Méndez M., Lin D., Altamirano D., Casella P., Belloni T. M., Lewin W. H. G., 2010, ApJ, 719, 201
- Illarionov & Sunyaev (1975) Illarionov A. F., Sunyaev R. A., 1975, A&A, 39, 185
- in’t Zand et al. (2011) in’t Zand J. J. M., Galloway D. K., Ballantyne D. R., 2011, A&A, 525, A111
- in’t Zand et al. (2013) in’t Zand J. J. M., Galloway D. K., Marshall H. L., Ballantyne D. R., Jonker P. G., Paerels F. B. S., Palmer D. M., Patruno A., Weinberg N. N., 2013, A&A, 553, A83
- Jahoda et al. (2006) Jahoda K., Markwardt C. B., Radeva Y., Rots A. H., Stark M. J., Swank J. H., Strohmayer T. E., Zhang W., 2006, ApJS, 163, 401
- Jonker et al. (2004) Jonker P. G., Galloway D. K., McClintock J. E., Buxton M., Garcia M., Murray S., 2004, MNRAS, 354, 666
- Jonker et al. (2000) Jonker P. G., van der Klis M., Homan J., Wijnands R., van Paradijs J., Méndez M., Kuulkers E., Ford E. C., 2000, ApJ, 531, 453
- Jonker et al. (1999) Jonker P. G., van der Klis M., Wijnands R., 1999, ApJ, 511, L41
- Kitamoto et al. (1984) Kitamoto S., Miyamoto S., Tanaka Y., Ohashi T., Kondo Y., Tawara Y., Nakagawa M., 1984, PASJ, 36, 731
- Klein-Wolt et al. (2004) Klein-Wolt M., Homan J., van der Klis M., 2004, Nuclear Physics B Proceedings Supplements, 132, 381
- Kouveliotou et al. (1996) Kouveliotou C., van Paradijs J., Fishman G. J., Briggs M. S., Kommers J., Harmon B. A., Meegan C. A., Lewin W. H. G., 1996, Nat, 379, 799
- Kubota et al. (1998) Kubota A., Tanaka Y., Makishima K., Ueda Y., Dotani T., Inoue H., Yamaoka K., 1998, PASJ, 50, 667
- Kulkarni & Romanova (2008) Kulkarni A. K., Romanova M. M., 2008, MNRAS, 386, 673
- Kuulkers et al. (2002) Kuulkers E., Homan J., van der Klis M., Lewin W. H. G., Méndez M., 2002, A&A, 382, 947
- Lamb et al. (1977) Lamb F. K., Fabian A. C., Pringle J. E., Lamb D. Q., 1977, ApJ, 217, 197
- Levine et al. (1996) Levine A. M., Bradt H., Cui W., Jernigan J. G., Morgan E. H., Remillard R., Shirey R. E., Smith D. A., 1996, ApJ, 469, L33
- Lewin et al. (1993) Lewin W. H. G., van Paradijs J., Taam R. E., 1993, Space Sci. Rev., 62, 223
- Linares et al. (2012) Linares M., Altamirano D., Chakrabarty D., Cumming A., Keek L., 2012, ApJ, 748, 82
- Lubin et al. (1992) Lubin L. M., Lewin W. H. G., Rutledge R. E., van Paradijs J., van der Klis M., Stella L., 1992, MNRAS, 258, 759
- Makishima et al. (1986) Makishima K., Maejima Y., Mitsuda K., Bradt H. V., Remillard R. A., Tuohy I. R., Hoshi R., Nakagawa M., 1986, ApJ, 308, 635
- Masetti (2002) Masetti N., 2002, A&A, 381, L45
- Masetti et al. (2000) Masetti N., Frontera F., Stella L., Orlandini M., Parmar A. N., Del Sordo S., Amati L., Palazzi E., Dal Fiume D., Cusumano G., Pareschi G., Lapidus I., Remillard R. A., 2000, A&A, 363, 188
- Melia & Zylstra (1992) Melia F., Zylstra G. J., 1992, ApJ, 398, L53
- Mitsuda et al. (1984) Mitsuda K., Inoue H., Koyama K., Makishima K., Matsuoka M., Ogawara Y., Suzuki K., Tanaka Y., Shibazaki N., Hirano T., 1984, PASJ, 36, 741
- Morrison & McCammon (1983) Morrison R., McCammon D., 1983, ApJ, 270, 119
- Parmar & White (1988) Parmar A. N., White N. E., 1988, Journal of the Italian Astronomical Society, 59, 147
- Patruno & D’Angelo (2013) Patruno A., D’Angelo C., 2013, ApJ, 771, 94
- Patruno et al. (2009) Patruno A., Watts A., Klein Wolt M., Wijnands R., van der Klis M., 2009, ApJ, 707, 1296
- Penninx et al. (1989) Penninx W., Damen E., van Paradijs J., Tan J., Lewin W. H. G., 1989, A&A, 208, 146
- Revnivtsev et al. (2001) Revnivtsev M., Churazov E., Gilfanov M., Sunyaev R., 2001, A&A, 372, 138
- Romanova et al. (2008) Romanova M. M., Kulkarni A. K., Lovelace R. V. E., 2008, ApJ, 673, L171
- Romanova et al. (2012) Romanova M. M., Ustyugova G. V., Koldoba A. V., Lovelace R. V. E., 2012, MNRAS, 421, 63
- Rutledge et al. (1995) Rutledge R. E., Lubin L. M., Lewin W. H. G., Vaughan B., van Paradijs J., van der Klis M., 1995, MNRAS, 277, 523
- Spitkovsky et al. (2002) Spitkovsky A., Levin Y., Ushomirsky G., 2002, ApJ, 566, 1018
- Spruit & Taam (1993) Spruit H. C., Taam R. E., 1993, ApJ, 402, 593
- Stella et al. (1988) Stella L., Haberl F., Lewin W. H. G., Parmar A. N., van Paradijs J., White N. E., 1988, ApJ, 324, 379
- Strohmayer & Bildsten (2006) Strohmayer T., Bildsten L., 2006, New views of thermonuclear bursts. pp 113–156
- Sunyaev & Shakura (1977) Sunyaev R. A., Shakura N. I., 1977, Soviet Astronomy Letters, 3, 138
- Sztajno et al. (1985) Sztajno M., van Paradijs J., Lewin W. H. G., Trumper J., Stollman G., Pietsch W., van der Klis M., 1985, ApJ, 299, 487
- Valenti et al. (2010) Valenti E., Ferraro F. R., Origlia L., 2010, MNRAS, 402, 1729
- van der Klis (1995) van der Klis M., 1995, in Alpar M. A., Kiziloglu U., van Paradijs J., eds, The Lives of the Neutron Stars Rapid Variability in X-ray Binaries - Toward a Unified Description. p. 301
- van der Klis (2006) van der Klis M., 2006, Rapid X-ray Variability. pp 39–112
- van der Klis et al. (2000) van der Klis M., Chakrabarty D., Lee J. C., Morgan E. H., Wijnands R., Markwardt C. B., Swank J. H., 2000, IAU Circ, 7358, 3
- van Paradijs et al. (1986) van Paradijs J., Sztajno M., Lewin W. H. G., Trumper J., Vacca W. D., van der Klis M., 1986, MNRAS, 221, 617
- van Straaten et al. (2003) van Straaten S., van der Klis M., Méndez M., 2003, ApJ, 596, 1155
- Watts (2012) Watts A. L., 2012, ARA&A, 50, 609
- White & Swank (1982) White N. E., Swank J. H., 1982, ApJ, 253, L61
- Worpel et al. (2013) Worpel H., Galloway D. K., Price D. J., 2013, ApJ, 772, 94
- Zhang et al. (2009) Zhang G., Méndez M., Altamirano D., Belloni T. M., Homan J., 2009, MNRAS, 398, 368
- Zhang et al. (1995) Zhang W., Jahoda K., Swank J. H., Morgan E. H., Giles A. B., 1995, ApJ, 449, 930