Trends in Ultracool Dwarf Magnetism. I. X-Ray Suppression and Radio Enhancement
Abstract
Although ultracool dwarfs (UCDs) are now known to generate and dissipate strong magnetic fields, a clear understanding of the underlying dynamo is still lacking. We have performed X-ray and radio observations of seven UCDs in a narrow range of spectral type (M6.5–M9.5) but spanning a wide range of projected rotational velocities (–40 km s-1). We have also analyzed unpublished archival Chandra observations of four additional objects. All of the newly-observed targets are detected in the X-ray, while only one is detected in the radio, with the remainder having sensitive upper limits. We present a database of UCDs with both radio and X-ray measurements and consider the data in light of the so-called Güdel-Benz relation (GBR) between magnetic activity in these bands. Some UCDs have very bright radio emission and faint X-ray emission compared to what would be expected for rapid rotators, while others show opposite behavior. We show that UCDs would still be radio-over-luminous relative to the GBR even if their X-ray emission were at standard rapid-rotator “saturation” levels. Recent results from Zeeman-Doppler imaging and geodynamo simulations suggest that rapidly-rotating UCDs may harbor a bistable dynamo that supports either a stronger, axisymmetric magnetic field or a weaker, non-axisymmetric field. We suggest that the data can be explained in a scenario in which strong-field objects obey the GBR while weak-field objects are radio-over-luminous and X-ray-under-luminous, possibly because of a population of gyrosynchrotron-emitting coronal electrons that is continuously replenished by low-energy reconnection events.
Subject headings:
brown dwarfs — radio continuum: stars — stars: activity — stars: coronae — X-rays: stars1. Introduction
The magnetic activity of very low mass stars and brown dwarfs (collectively, “ultracool dwarfs” or UCDs; here, objects of spectral types M7 or later) raises several challenging astrophysical questions. UCD activity cannot be driven by a solar-type shell dynamo, in which the tachocline (the shearing interface layer between the radiative and convective zones) plays a crucial role; full convection sets in around spectral type M4, and so the tachocline simply does not exist in UCDs (Chabrier & Baraffe, 2000). Nonetheless, observations reveal persistent, strong (kG) magnetic fields at the bottom of the main sequence (Berger et al., 2001; Berger, 2002, 2006; Berger et al., 2010; Hallinan et al., 2006; Reiners & Basri, 2007; Osten et al., 2009; Reiners & Basri, 2010; Morin et al., 2010; Antonova et al., 2013). Despite substantial theoretical work to understand the fully-convective dynamo (e.g., Durney et al., 1993; Chabrier & Küker, 2006; Dobler et al., 2006; Browning, 2008), its properties, and those of the resulting magnetic fields, remain unclear. Further progress requires observational input based on studies of magnetic activity indicators.
X-ray and emission are two common indicators, and decades of study of solar-type stars have yielded several important relationships between these quantities and other stellar properties. One such relationship is between X-ray activity (, where the denominator is the bolometric stellar luminosity) and stellar rotation (Noyes et al., 1984), which follows a “saturation” pattern in which activity increases with rotation until it reaches (Vilhu, 1984; Pizzolato et al., 2003; Jeffries et al., 2011; Wright et al., 2011). The same general pattern is observed in emission (e.g., Delfosse et al., 1998).
Radio emission is another powerful magnetic activity indicator, and there are also well-known correlations between the radio and soft X-ray (SXR) luminosities of magnetically active stellar systems. Drake et al. (1989) first noted a correlation betwen and in RS CVn systems. Güdel & Benz (1993) analyzed a larger sample and found that for the most active F–M stars, Hz. This result was then extended to solar flares and other active binaries by Benz & Güdel (1994). Over their whole dataset, spanning 10 orders of magnitude in radio spectral luminosity, with , a result now commonly known as the Güdel-Benz relation (GBR). Continuity over such a broad range strongly suggests both a common driver of emission in the two bands (despite the fact that the fundamental emission processes operate in very different conditions), as well as common physical processes across this range of emitters. In the standard interpretation, magnetic reconnection accelerates a population of nonthermal particles, leading to radio emission; these particles then deposit some of their energy in the chromosphere, where ablated material concentrates in coronal loops and emits thermally in the SXR band. This model is supported by the observed “Neupert effect” (Neupert, 1968), in which , suggesting that the SXR emission tracks the total energy deposited by the particle acceleration process. This effect is well-established though far from universal in both the solar and stellar contexts (e.g., Dennis & Zarro, 1993; Güdel et al., 1996; Osten et al., 2004).
Observations of magnetic activity tracers in UCDs paint a different picture. Despite the demonstrated existence of strong fields in at least some UCDs, their X-ray and emission both drop off precipitously (Stelzer et al., 2006a; Berger et al., 2010; Gizis et al., 2000; West et al., 2004). The rotation/activity relation evolves significantly in UCDs, with evidence for trends in which X-ray and activity decrease as rotation increases (Basri & Marcy, 1995; Mohanty & Basri, 2003; West & Basri, 2009; Berger et al., 2010), reminiscent of the much weaker “supersaturation” effect seen in active stars (Prosser et al., 1996; Jeffries et al., 2011). But UCD radio emission remains stubbornly unchanged: in this regime, radio activity and radio surface flux () increase with rotation, with no evidence of saturation (McLean et al., 2012).
These trends offer clues toward a deeper understanding of the fully convective dynamo and the structures of (sub)stellar magnetic fields and outer atmospheres. Progress toward this understanding, however, is hampered by the relatively small number of UCDs detected in the X-ray regime. In an attempt to improve this situation, we have observed numerous UCDs with the Chandra X-ray Observatory (Berger et al., 2005, 2008a, 2008b, 2009, 2010). In this work, we report new Chandra observations of 7 UCDs of spectral type M7 with a wide range of rotational velocities, all of which were detected. Every source was also observed (non-simultaneously) with the upgraded Karl G. Jansky Very Large Array (VLA), yielding one detection. Our Chandra detections offer a striking counterpoint to previous observations of objects objects only a few spectral subtypes later, in which X-ray detections have been elusive (e.g., Berger et al., 2005, 2010). We also report the analysis of several unpublished measurements from archival data. We combine these results with data from our previous work and the literature to form a comprehensive database of UCD activity measurements.
In this work, we use this database to investigate the correlation between X-ray and radio emission in UCDs. We proceed here by describing the targets for which we present new results (§2) and our data analysis (§§3, 4). We then discuss our results in the context of the full sample of UCDs with X-ray and radio observations (§5). We offer a physical model that explains the observations (§6). In Cook et al. (2013, hereafter Paper ii), we use the same database to investigate the correlation between UCD X-ray emission and rotation.
Throughout this work, we use the notation , with being measured in cgs units if it is a dimensional quantity, unless its units are specified otherwise.
2. Targets with New Results
Candidates for new radio and X-ray observations were selected by searching dwarfarchives.org for nearby UCDs of spectral type M7 that were visible to the VLA and had measurements of in the literature. We also searched the Chandra data archive for unpublished observations of late-type objects with measurements. Seven targets were observed with Chandra and the VLA, and we identified and analyzed four archival targets. The main characteristics of these objects, along with the appropriate references and 2MASS identifications (Skrutskie et al., 2006), are provided in Table 2, while their properties are discussed in greater detail in the Appendix. The Appendix also describes our method for computing bolometric luminosities.
| 2MASS Identifier | Name | Distance | SpT | References | |||||||||||
|---|---|---|---|---|---|---|---|---|---|---|---|---|---|---|---|
| (pc) | (km s-1) | ||||||||||||||
| (1) | (2) | (3) | (4) | (5) | (P) | (C) | (M) | (D) | (S) | (V) | |||||
| Newly-observed targets | |||||||||||||||
| 010951170343264 | LP 647–13aaPossible binary; see Guenther & Wuchterl (2003). | M9 | 1 | 2 | 3 | 3 | 4 | ||||||||
| 104812581120082 | LHS 292 | M6.5 | 5 | 6 | 8 | 7 | 4 | ||||||||
| 112149241313084 A | LHS 2397a A | M8 | 5 | 9 | 10 | 8 | 10 | 11 | |||||||
| B | B | L7.5 | 10 | 11 | |||||||||||
| 115542862224586 | LP 851–346 | M7.5 | 5 | 12 | 13 | 13 | 4 | ||||||||
| 152101035053230 | NLTT 40026 | M7.5 | 1 | 3 | 3 | 3 | 4 | ||||||||
| 184322134040209 | LHS 3406 | M8 | 5 | 14 | 8 | 3 | 4 | ||||||||
| 222854401325178 | LHS 523 | M6.5 | 5 | 15 | 8 | 16 | 17 | ||||||||
| Chandra archival targets | |||||||||||||||
| 002755922219328 A | LP 349–25 A | M8 | 5 | 18 | 19 | 20 | 19 | 11 | |||||||
| B | B | M9 | 19 | 11 | |||||||||||
| 025503574700509 | DENIS 02554700 | L8 | 21 | 22 | 23 | 3 | 24 | ||||||||
| 195354434424541 A | G 208–44 A | M5.0 | 5 | 25 | 26 | 28 | 27 | 17 | |||||||
| B | B | M8.5 | bbMeasurement is a blend of both system components. | 5 | 29 | 27 | 28 | ||||||||
| 195355084424550 | G 208–45 | M5.5 | 5 | 25 | 14 | 28 | |||||||||
Note. — See Appendix for additional details and references.
References. — Columns are (P), discovery of substantial proper motion; (C), classification as very cool dwarf; (M), discovery of multiplicity; (S), spectral type; (D), distance; (V), . [1] Luyten (1979), [2] Cruz & Reid (2002), [3] Cruz et al. (2003), [4] Reiners & Basri (2010), [5] Luyten (1976), [6] Dahn et al. (1986), [7] Henry et al. (1994), [8] van Altena et al. (1995), [9] Gliese & Jahreiß (1991), [10] Freed et al. (2003), [11] Konopacky et al. (2012), [12] Phan-Bao et al. (2003), [13] Crifo et al. (2005), [14] Reid et al. (1995), [15] Liebert et al. (1979), [16] Kirkpatrick et al. (1991), [17] Mohanty & Basri (2003), [18] Gizis et al. (2000), [19] Forveille et al. (2005), [20] Gatewood & Coban (2009), [21] Casewell et al. (2008), [22] Martín et al. (1999), [23] Costa et al. (2006), [24] Reiners & Basri (2008), [25] Harrington et al. (1974), [26] Harrington & Dahn (1984), [27] Law et al. (2008), [28] Delfosse et al. (1998), [29] McCarthy et al. (1988)
2.1. Observations
The new observations were performed with Chandra/ACIS-S between 2011 December and 2013 February (proposal 13200167; Chandra observation IDs 13603–13609; PI: Berger), using the S3 backside-illuminated chip. All exposures were 20 ks, except for LHS 292 which was observed for 10 ks. Parameters of the observations are provided in Table 2. No grating was used, the data mode was VFAINT, and the exposure mode was “timed” (TE).
| Name | Observation Date | ObsId | Integ. Time | Raw Counts | ||
|---|---|---|---|---|---|---|
| Gregorian | MJD[TT] | (s) | ||||
| (1) | (2) | (3) | (4) | (5) | (6) | |
| Newly-observed targets | ||||||
| LHS 292 | 2011 Dec 14 | 13603 | 51 | |||
| LHS 523 | 2012 Dec 08 | 13604 | 15 | |||
| LHS 2397a AB | 2012 Nov 05 | 13606 | 252 | |||
| LHS 3406 | 2012 Dec 05 | 13609 | 74 | |||
| LP 647–13 | 2012 Oct 24 | 13605 | 12 | |||
| LP 851–346 | 2012 Jul 09 | 13607 | 43 | |||
| NLTT 40026 | 2013 Feb 07 | 13608 | 6 | |||
| Chandra archival targets | ||||||
| G 208–44 AB | 2003 Dec 14 | 4476 | aaAffected by background flaring (see §3). | 1607bbAffected by pileup (see §3). | ||
| G 208–45 | 2003 Dec 14 | 4476 | aaAffected by background flaring (see §3). | 1072bbAffected by pileup (see §3). | ||
| DENIS 02554700 | 2008 Dec 02 | 8903 | 0 | |||
| DENIS 02554700 | 2008 Dec 04 | 10828 | 1 | |||
| LP 349–25 AB | 2009 Sep 15 | 9225 | 60 | |||
Note. — Cols. (2) and (3) are the approximate midpoint of the on-source integration. Col. (4) is the Chandra observation ID. Col. (5) is the on-source integration time, not accounting for the background flares described in the text. Col. (6) is the number of counts in a 2′′ aperture around the predicted source position after processing in the VFAINT background mode, not accounting for pileup.
The targets were also observed with the Karl G. Jansky Very Large Array (VLA) between 2012 February and 2012 May (project VLA/12A-089; PI: Berger). These observations were not simultaneous with the X-ray observations, and the relative timing between observations in the two bands was arbitrary. Each observing session lasted 1 hr, with a total correlated bandwidth of 2048 MHz divided into two basebands centered at 5000 and 7100 MHz, each containing 512 spectral channels. Bandpass, flux density scale, and complex gain calibrations were obtained in the usual way; the sources used are listed in Table 3, along with other parameters of the observations. Approximately 65% of each session was spent integrating on the target source.
| Name | Observation Date | Integ. Time | Config. | Flux Cal. | Gain Cal. | |
|---|---|---|---|---|---|---|
| Gregorian | MJD[TT] | (s) | ||||
| (1) | (2) | (3) | (4) | (5) | (6) | (7) |
| LHS 292 | 2012 Feb 22 | C | 3C 286 | J10391541 | ||
| LHS 523 | 2012 Mar 17 | C | 3C 48 | J22461206 | ||
| LHS 523 | 2012 May 21 | CnB | 3C 48 | J22461206 | ||
| LHS 2397a AB | 2012 Feb 22 | C | 3C 286 | J11301449 | ||
| LHS 3406 | 2012 Mar 17 | C | 3C 48 | J18454007 | ||
| LP 647–13 | 2012 Feb 22 | C | 3C 48 | J01100741 | ||
| LP 851–346 | 2012 Feb 28 | C | 3C 286 | J11592148 | ||
| NLTT 40026 | 2012 Mar 16 | C | 3C 286 | J15455135 | ||
Note. — LHS 523 was observed twice. Cols. (2) and (3) are the approximate midpoint of the on-source integration. Col. (4) is the on-source integration time. Col. (5) is the configuration of the VLA at the time of the observation.
The archival data were obtained as follows. G 208-44AB/45 was observed with Chandra/ACIS-S on 2003 December 14 (proposal 05200058; Chandra observation ID 4476; PI: Garmire) for 24 ks. DENIS 02554700 was observed in two parts (proposal 09200200; observation IDs 8903 and 10828; PI: Audard) on 2008 December 2 and 2008 December 4, for a total exposure time of 28 ks. LP 349–25 AB was observed on 2009 September 15 (proposal 10200468; observation ID 9925; PI: Osten) with an exposure time of 37 ks. In all cases, the instrumental configuration was the same as in our new observations.
3. X-Ray Analysis
We analyzed the Chandra data in CIAO version 4.5 (Fruscione et al., 2006) with CalDB version 4.5.5.1. We used the date of each observation and astrometric information from the Simbad database to predict positions for each target at the time of our observations. Based on Monte Carlo simulations, all of our predictions have uncertainties of , and most of them have uncertainties of . This is comparable to the astrometric precision of Chandra. We defined initial source apertures in radius centered on our astrometric predictions of the source positions. As discussed below, two of our targets (G 208–44 AB and G 208–45) are affected by pileup, leading us to use annular apertures instead. For the rest of the targets, the initial apertures needed no modification.
Following VFAINT reprocessing to eliminate a substantial fraction of the background events, we estimated the mean residual background in each dataset by extracting events in an energy range of 0.3–7 keV in large, source-free regions near the target locations. In all cases, the expected number of background counts in the source aperture is 1.
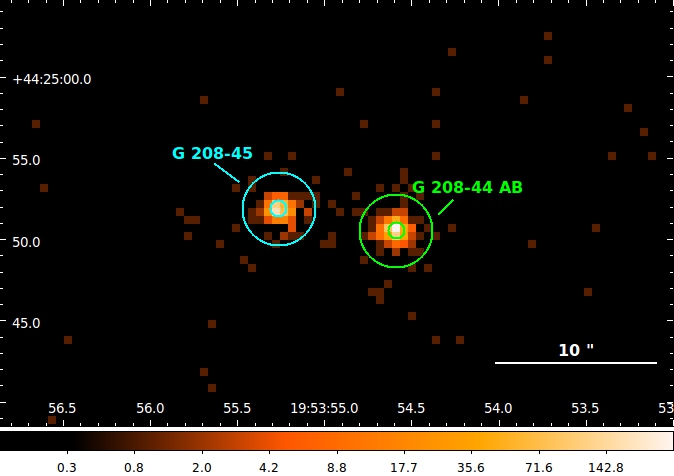
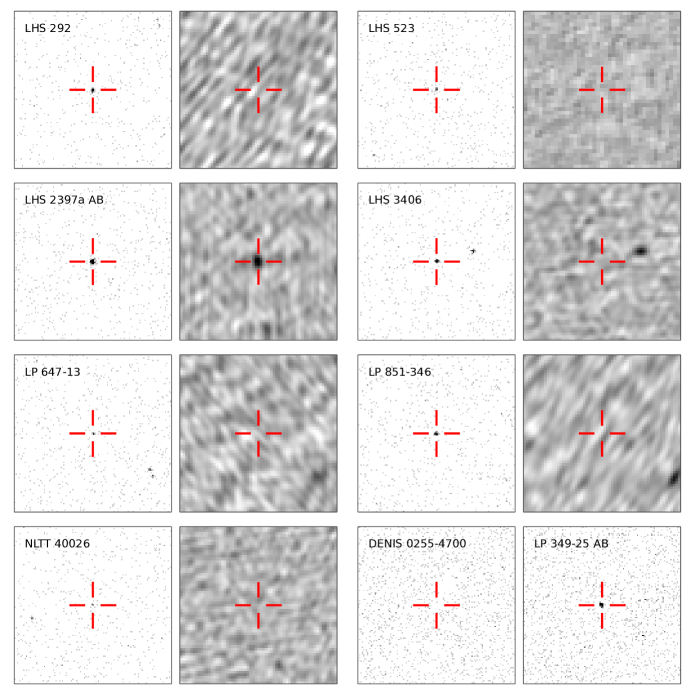
Every source except the archival L8 dwarf DENIS 02554700 was detected at 5 significance. In our new observations, the number of counts at the source location ranges between 6 (NLTT 40026, with expected background events) and 252 (LHS 2397a AB). With the high success rate in our new observations, we nearly double the number of UCDs with X-ray detections (cf. Table 5). The only target with nontrivial X-ray structure and annular source extraction apertures, the triple system G 208-44AB/45, is shown in Figure 1. Cutouts of the X-ray images around the predicted locations of the other sources (as well as radio images; see next section) are shown in Figure 2.
During extraction we also checked for background flaring. The only dataset in which flares were seen was the observation of G 208-44AB/45. We discuss our handling of this dataset separately below.
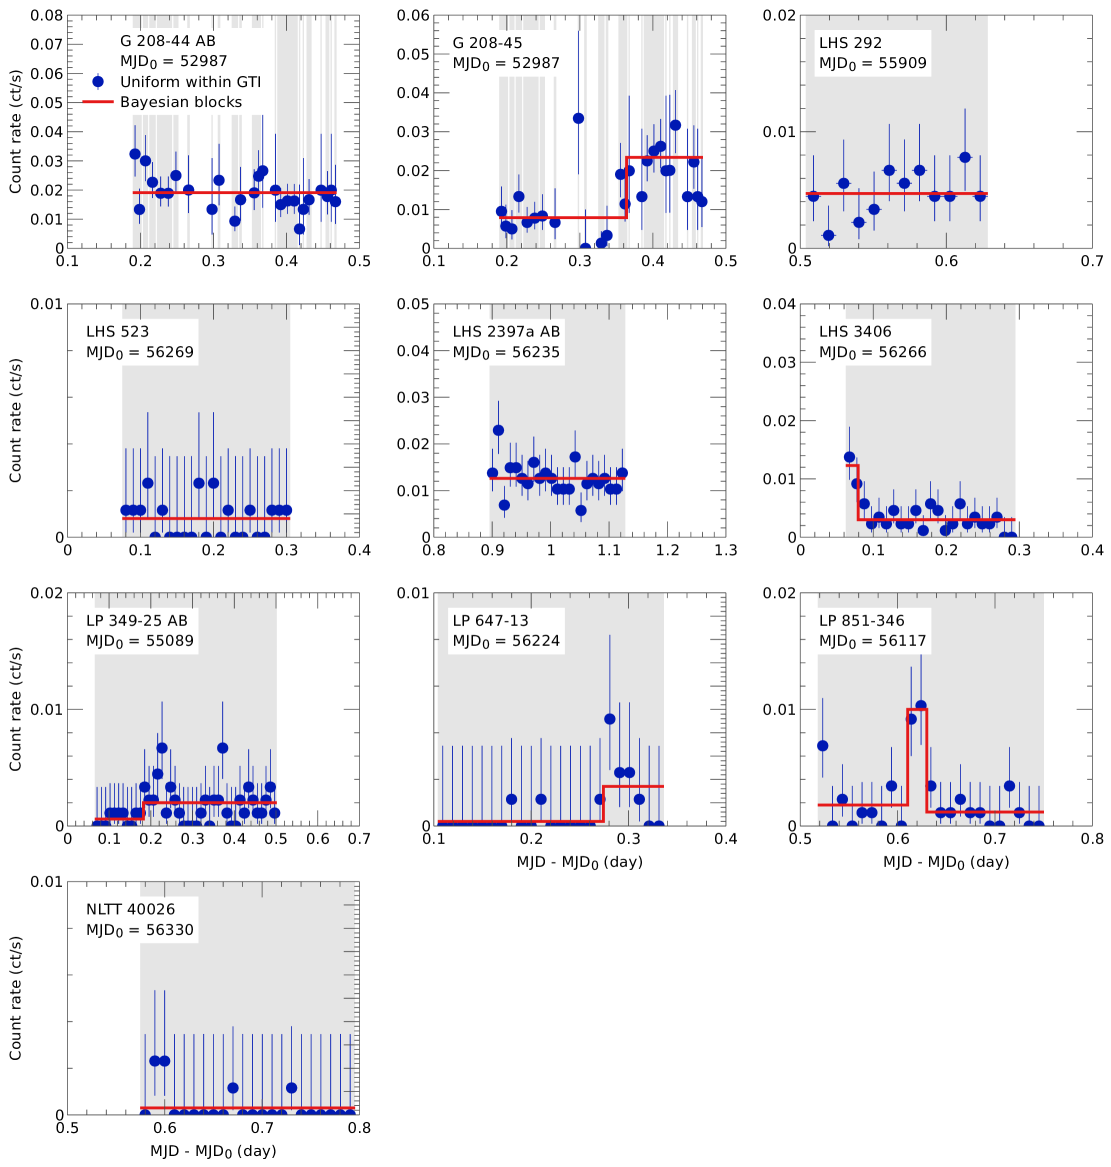
We searched for variability in the X-ray emission of the detected sources using a Bayesian blocks analysis (Scargle, 1998; Scargle et al., 2013). This approach models the source flux as a series of independent, piecewise constant “blocks,” with overfitting being controlled by the use of a downward-sloping prior on the number of blocks (). Our implementation of the algorithm uses the iterative approach described in Scargle et al. (2013) with a Monte-Carlo-derived parametrization of the prior on that sets the probability of false detection of an extraneous block at 5%. This parametrization is given in Equation 21 of Scargle et al. (2013) but is misstated; the correct equation is
| (1) |
as may be verified with the example given in that work. Our implementation is in Python and derives from the MatLab™ code provided by Scargle et al. (2013) and the AstroML Python module (VanderPlas et al., 2012). Compared to the latter module, our system adds support for time-tagged events and datasets with gaps in coverage (due to the background flaring in our case). It also fixes several minor bugs such as the mistaken equation above. Our implementation is publicly available111The implementation is versioned using Git and is currently available at https://github.com/pkgw/pwpy/blob/master/scilib/xbblocks.py. The version used in this work is that included in commit 606218c47d667e97d58c38f1fd09e7dc5540b38f. The design of Git ensures that this commit identifier uniquely specifies the exact content and complete revision history of the code in question..
The Bayesian blocks analysis finds more than one block — that is, significant evidence of variability — in five sources. We plot the X-ray light curves resulting from this analysis in Figure 3, also showing the results of uniform binning for reference. The plots also indicate the “good time intervals” in which background flares were not an issue; they are continuous except for the observations of G 208-44AB/45. Table 4 includes information on the flare durations and fluxes. Of the five sources with more than one block, four of them contain two blocks, suggesting partially-observed flares. The last, LP 851–346, has three blocks, with the pre- and post-flare fluxes agreeing at the 20% level. From visual inspection of Figure 3, one may conclude that both a flatter prior on (i.e., an assumption of a higher likelihood that sources are variable) and that a non-piecewise-constant emission model would lead to more faithful approximations of the data. Because the aim of our analysis is limited to identifying representative quiescent and (when appropriate) flaring X-ray fluxes, we do not explore these possible elaborations here.
| Name | State | Integ. Time | Counts | [] | |||
|---|---|---|---|---|---|---|---|
| (s) | [erg s-1 cm-2] | ||||||
| (1) | (2) | (3) | (4) | (5) | |||
| Newly-observed targets | |||||||
| LHS 292 | M | ||||||
| LHS 523 | M | ||||||
| LHS 2397a AB | M | ||||||
| LHS 3406 | M | ||||||
| Q | |||||||
| F | |||||||
| LP 647–13 | M | ||||||
| Q | |||||||
| F | |||||||
| LP 851–346 | M | ||||||
| Q | |||||||
| F | |||||||
| NLTT 40026 | M | ||||||
| Chandra archival targets | |||||||
| G 208–44 AB | M | ||||||
| G 208–45 | M | ||||||
| Q | |||||||
| F | |||||||
| DENIS 02554700 | M | ||||||
| LP 349–25 AB | M | ||||||
| Q | |||||||
| F | |||||||
Note. — Col. (2) is the source state, one of mean (M), quiescent (Q), or flaring (F). Col. (3) is the integration time after background flares have been removed. Col. (4) is counts in the final apertures, accounting for the flagging of periods of background flaring and removal of piled-up pixels. Col. (5) is the X-ray flux in the 0.2–2 keV band.
We determined X-ray fluxes in the 0.2–2 keV band using either spectral modeling or a simple energy conversion factor (ECF). We used the ECF approach for all but the three brightest sources: LHS 2397a AB, G 208–44 AB, and G 208–45. After extracting spectra from the event data of these three sources, grouping into bins of 12 events, we used Sherpa version 1 (Freeman et al., 2001) for the modeling, ignoring energies outside of the standard ACIS energy filter of 0.3–7 keV. We used the Sherpa implementation of the Nelder & Mead (1965) simplex algorithm to optimize the modified statistic of Gehrels (1986). Solar abundances were taken from Lodders (2003). Our X-ray flux results and the outcomes of the modeling are discussed below. We summarize the fluxes in Table 4, where the uncertainties are properly propagated and account for Poisson statistics as appropriate. Derived quantities for the UCDs, including X-ray luminosities, are presented in Table .3.3.
3.1. LHS 2397a AB
In LHS 2397a AB, a one-temperature, solar-abundance APEC (Astrophysical Plasma Emission Code; Smith et al., 2001) model yields a satisfactory fit, achieving a reduced statistic with 18 degrees of freedom (DOF), although there are strong correlations among the residuals. The data and best-fit model are shown in Figure 4.
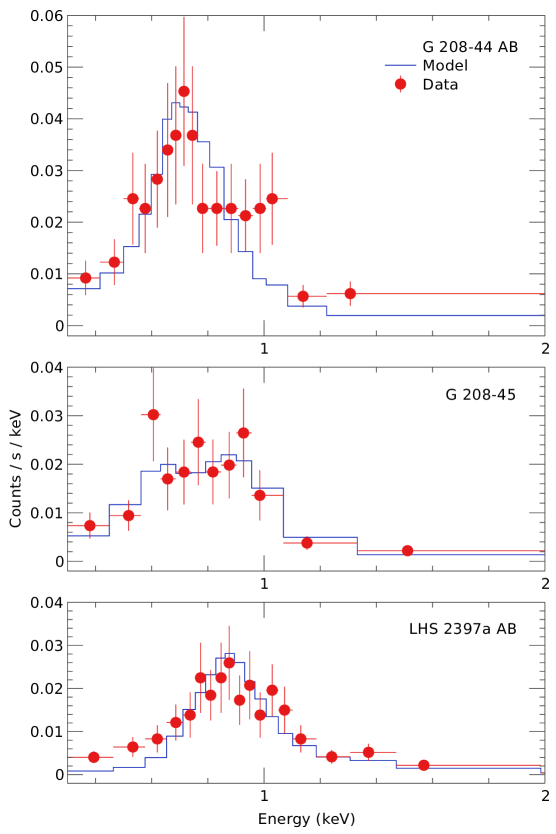
The model-fitting procedure finds keV, but we caution generally against overinterpreting the parameters derived from our spectral fits. While the data we present cannot rule out a single-temperature solar-abundance model, the truth is likely more complicated. In particular, the value of we report above is quite possibly an approximate average of multiple temperature components. Intriguingly, if we overfit the data by adopting a two-temperature model, we find temperatures of 0.3 and 1.2 keV, in good agreement with other results from mid-to-late M dwarfs (e.g., Robrade & Schmitt, 2005). Similarly, if we use a single-temperature model with variable abundances, the fits tend to converge on an inverse first ionization potential (FIP) effect, with higher abundances found for elements with higher FIPs, as is commonly seen in higher-S/N spectra of similar objects (e.g., Robrade & Schmitt, 2005). We emphasize, however, that these findings are not statistically significant.
Granting these caveats, the fluxes we derive from our spectral modeling are robust, because the essential shapes of the X-ray spectra are well-constrained by the data. For LHS 2397a AB we find the X-ray flux in the 0.2–2 keV band to be . At our adopted distance, this corresponds to and , near the canonical “saturation” value of the X-ray/rotation activity relation observed in solar-type stars (e.g., Pizzolato et al., 2003).
3.2. G 208-44AB/45
While G 208–44 AB and G 208–45 are clearly resolved in the Chandra image (Figure 1), the tighter binary (G 208–44 A and B) is not. The following analysis considers only the blended emission of G 208–44 AB.
During our analysis of the G 208-44AB/45 dataset, we discovered significant background flaring activity. We used standard CIAO tools to extract a light curve of non-source regions on the source chip (S3), binning by 150 s in time and finding a non-flaring background rate of 0.32 s-1 across the whole chip, which is consistent with typical nonflaring behavior. We flagged bins in which the measured background rate varied from this value by 4. After processing, the good exposure time was reduced from 23.8 to 12.1 ks. We note that the Bayesian blocks method can be applied to data with observational gaps without adjustment (Scargle et al., 2013), making it well-suited for these data.
Both components of the system additionally achieved count rates sufficiently high (0.1 s-1) to make pileup a concern. We used the Portable, Interactive Multi-Mission Simulator (PIMMS) to estimate the pileup percentages during the observations. For both objects, pileup was estimated at the 5% level. To compensate for this we analyzed both components using annuli centered on the source positions, removing the centermost pixels where the count rate and hence pileup were greatest. For both sources, the annuli had inner (outer) radii of 0.5 (2.25) arcsec. This approach discards significant signal, but both sources were bright enough that we still retained strong detections sufficient for spectral modeling. The reported fluxes account for the reduced portion of the PSF being sampled. Filtering of background flares and removal of the central pixels reduced the number of counts detected at the position of G 208–44 AB from 1607 to 234; for G 208–45, the numbers are 1072 and 170, respectively.
In G 208–44 AB, the Bayesian blocks analysis detects no significant variability, and a one-temperature, solar-abundance APEC model yields a satisfactory fit, achieving with 16 DOF. In this case as well there are strong correlations among the residuals. The best-fit temperature in the adopted model is keV, subject to the same caveats mentioned above. We find (0.2–2 keV). At our adopted distance, and .
In G 208–45, the Bayesian blocks analysis finds that the count rate in the final 9 ks of the observation is elevated by a factor of 3. Although flaring is often associated with spectral variability (e.g., Osten et al., 2005), there were few enough counts available that we chose to only model the mean spectrum of the source. We found that a one-temperature, solar-abundance model yielded a less satisfactory fit, with for 11 DOF. A two-temperature, solar-abundance model yields (9 DOF) with keV and keV. We find (0.2–2 keV), , and . For comparison, a one-temperature fit with variable abundance finds (10 DOF), keV, , and . Despite their differences, the two models yield values of that agree within their uncertainties.
3.2.1 Did ROSAT observe G 208-44AB/45 during a flare?
Previous X-ray observations of the G 208-44AB/45 system were performed as part of the ROSAT All-Sky Survey (RASS), with follow-up on the ROSAT High Resolution Imager (HRI). While the latter was capable of resolving the triple system into its two main components (resolution 2′′; separation 7′′), the former, with a resolution of 5–10′ (Voges et al., 1999), was not. While Schmitt & Liefke (2004) correctly identify the ROSAT source as the blend of all three components, we note that Law et al. (2008) failed to highlight this in their summary of the X-ray properties of G 208–44 AB.
The RASS catalog luminosity for G 208-44AB/45 is in the 0.1–2.4 keV band. After correction to the ROSAT bandpass, this exceeds the sum of our resolved measurements by a factor of 6. This suggests that the RASS observations of G 208-44AB/45 may have occurred during a strong flare. The RASS exposure time during the observation was 730 s (Schmitt & Liefke, 2004), shorter than the typical timescale of such events. The later ROSAT HRI measurements find with an integration time of 2849 seconds (Schmitt & Liefke, 2004), in better agreement with the Chandra results, though still exceeding them by a factor of 2. As X-ray flares may easily result in luminosity increases of an order of magnitude (cf. Figure 5), it would not take an unusually large flare to reconcile the two measurements. On the other hand, the fact that both ROSAT measurements exceed the combined Chandra flaring luminosity, despite their separation in time (8 months), suggests that perhaps the X-ray activity of this system has decreased since the time of the RASS, possibly due to a long-term magnetic activity cycle (e.g., Baliunas et al., 1996).
3.3. Other Detected Sources
We determined X-ray fluxes for the other detected sources by assuming an energy conversion factor (ECF) of erg cm-2 count-1, where the uncertainty approximately accounts for the range of plasma temperatures and abundances commonly encountered. The applicable theoretical ECF reported by WebPIMMS version 4.6a for a 0.5 keV APEC plasma with is erg cm-2 count-1. Our adopted value agrees with those derived for LHS 2397a AB, G 208–44 AB, and G 208–45 (ECF , respectively) as well as our previous observations of X-ray-emitting UCDs (Berger et al., 2008a, b). Spectral modeling of the other sources with larger numbers of events (LHS 292, LHS 3406, LP 851–346) yields results consistent with those reported here.
3.4. Undetected Source: DENIS 02554700
Only one photon in the 0.3–7 keV range was detected at the predicted location of DENIS 02554700 throughout both observations, compared to the expected background level of 0.7 counts in 28 ks. The resulting 95% confidence upper limit is 4.3 counts (Kraft et al., 1991). Using the above energy conversion factor, the time-averaged flux limit is . At our adopted distance of 5.0 pc, we can thus constrain the persistent emission of DENIS 02554700 to be , or .
4. Radio Analysis
We calibrated the VLA using standard procedures in the CASA software system (McMullin et al., 2007). Radio-frequency interference was flagged automatically using the aoflagger tool, which provides post-correlation (Offringa et al., 2010) and morphological (Offringa et al., 2012) algorithms for identifying interference. At the time of analysis, aoflagger did not include a set of tuning parameters suitable for the processing of VLA data, so these were developed manually.
| Name | Integ. Time | rms | Synthesized Beam | |||
|---|---|---|---|---|---|---|
| Major | Minor | PA | ||||
| (s) | (Jy) | (Jy bm-1) | (arcsec) | (arcsec) | (deg) | |
| (1) | (2) | (3) | (4) | (5) | (6) | (7) |
| LHS 292 | < | |||||
| LHS 523 | < | |||||
| LHS 2397a AB | ||||||
| LHS 3406 | < | |||||
| LP 647–13 | < | |||||
| LP 851–346 | < | |||||
| NLTT 40026 | < | |||||
Note. — Col. (4) is the background rms in a region near the source. Cols. (5) and (6) are FWHM sizes. The reference frequency of each image is 6.05 GHz. Further parameters regarding the detection of LHS 2397a AB are given in the text.
We created deep Stokes I images of each field with 20482048 pixels, each arcsec2, except the image of LHS 523, for which a pixel scale of arcsec2 was used to include the nearby, bright blazar QSO B2227136 (catalog QSO B2227-136) in the image. The imaging process used multi-frequency synthesis (Sault & Wieringa, 1994) and CASA’s multi-frequency CLEAN algorithm with 1500 iterations. Two spectral Taylor series terms were used for each CLEAN component; this approach models both the flux and spectral index of each source. The reference frequency for each image is 6.05 GHz. Properties of the images are listed in Table 5. Astrometric predictions of the source locations were computed as described above, and cutouts of the VLA images around the predicted source locations are show in Figure 2. The accuracy of VLA astrometry in our observing configuration is , comparable to that of our predictions. While our targets have relatively high proper motions, the time baseline between the pairs of VLA and Chandra observations is sufficiently small that the differences in the predicted positions are negligible.
We detect a radio source in the image of the LHS 2397a AB field at position RA = 11:21:48.78, Dec = 13:13:09.4, coincident with our astrometric prediction of RA = 11:21:48.77, Dec = 13:13:09.5. We re-imaged this field, rephasing the data to place this position on a pixel center to obtain the most accurate source parameters from image-domain modeling. Fitting the rephased image with a point-source model yields a flux density of Jy and a positional uncertainty of . Fomalont et al. (1991) used the VLA to find the areal density of sources brighter than 50 Jy at 5 GHz to be arcsec-2, making the probability of a chance positional coincidence (taking our search area to be the synthesized beam size). We therefore identify this source with LHS 2397a AB. The multi-frequency cleaning algorithm determines a spectral index of (). We imaged the source in the Stokes V parameter and made no detection, with an image rms of 5.4 Jy bm-1. Taking the Stokes V upper limit to be three times this value, we find that . We searched for flares and other forms of variability using a visibility-domain analysis of the Stokes I data as described in Williams et al. (2013). No significant indications of variability were seen.
There is a 50 Jy (7) radio source in the image of the LHS 3406 field at RA = 18:43:20.72, Dec = 40:40:33.01, which is 15′′ distant from the astrometric prediction. We checked the image astrometry against two NVSS sources (NVSS J184331404756 (catalog ) and NVSS J184314403302 (catalog )), finding agreement down to the uncertainty in the survey’s astrometry. We conclude that this source is not LHS 3406. There are no sources within 1′ of our astrometric predictions in all of the other fields. In each of these cases, we place an upper limit on the target flux density of three times the image rms. The field of LHS 523 was visited twice; no source is detected in the individual visits or in a deep image formed by combining the two datasets. The results of our radio observations, including flux densities, are summarized in Table 5. Derived parameters, including radio spectral luminosities, are presented in Table .3.3.
5. Trends in Radio and X-Ray Emission
We have combined our new measurements with data from the literature to compile a comprehensive database of UCDs with both radio and X-ray observations. In Table 5, we list these objects and provide some of their properties. Different authors report X-ray luminosities that are integrated over varying energy regimes; for consistency we normalize all X-ray fluxes and luminosities to a common band of 0.2–2.0 keV. We used PIMMS to compute the appropriate conversion factors, evaluating flux ratios in a range of different plasma temperatures in the APEC model. The resulting factors are listed in Table 7. The conversion factors represent an approximate median for several temperatures in the range – keV and are stable to within for temperatures within this range. In Table .3.3 we report all paired UCD radio and X-ray luminosities available, giving detailed references and using simultaneous measurements when available.
| 2MASS Identifier | Other Name | SpT | [] | References | |||||||||
|---|---|---|---|---|---|---|---|---|---|---|---|---|---|
| (mag) | (mag) | (pc) | [] | ||||||||||
| (1) | (2) | (3) | (4) | (5) | (6) | (7) | (S) | (D) | |||||
| ¶ | 104812581120082 (catalog ) | LHS 292 | M6.5 | 1 | 2 | ||||||||
| ¶ | 222854401325178 (catalog ) | GJ 4281 | M6.5 | 3 | 2 | ||||||||
| 131420391320011 AB (catalog ) | NLTT 33370 AB | M7 | 4 | 4 | |||||||||
| 145638312809473 (catalog ) | LHS 3003 | M7 | 5 | 2 | |||||||||
| 165535290823401 (catalog ) | vB 8 | M7 | 1 | 6 | |||||||||
| ¶ | 115542862224586 (catalog ) | LP 851346 | M7.5 | 7 | 7 | ||||||||
| ¶ | 152101035053230 (catalog ) | NLTT 40026 | M7.5 | 5 | 5 | ||||||||
| ¶ | 002755922219328 AB (catalog ) | LP 34925 AB | M8 | 5 | 8 | ||||||||
| 032059651854233 (catalog ) | LP 41231 | M8 | 5 | 9 | |||||||||
| ¶ | 112149241313084 AB (catalog ) | LHS 2397a AB | M8 | 10 | 2 | ||||||||
| ¶ | 184322134040209 (catalog ) | LHS 3406 | M8 | 5 | 2 | ||||||||
| 191657620509021 (catalog ) | vB 10 | M8 | 11 | 11 | |||||||||
| 145429231606039 Bab (catalog ) | Gl 569 Bab | M8.5 | 12 | 13 | |||||||||
| 183537903259545 (catalog ) | LSPM J18353259 | M8.5 | 5 | 9 | |||||||||
| ¶ | 010951170343264 (catalog ) | LP 64713 | M9 | 5 | 5 | ||||||||
| 033935213525440 (catalog ) | LP 94420 | M9 | 5 | 9 | |||||||||
| 085336190329321 (catalog ) | LHS 2065 | M9 | 5 | 2 | |||||||||
| 104814633956062 (catalog ) | M9 | 14 | 15 | ||||||||||
| 142843233310391 (catalog ) | LHS 2924 | M9 | 15 | 2 | |||||||||
| 150108182250020 (catalog ) | TVLM 51346546 | M9 | 15 | 2 | |||||||||
| 002424630158201 (catalog ) | BRI B00210214 | M9.5 | 16 | 2 | |||||||||
| 002741970503417 (catalog ) | PC 00250447 | M9.5 | 17 | 17 | |||||||||
| 074642562000321 AB (catalog ) | L0 | 18 | 5 | ||||||||||
| 060230453910592 (catalog ) | LSR J06023910 | L1 | 19 | 19 | |||||||||
| 130540192541059 AB (catalog ) | Kelu1 AB | L2 | 5 | 5 | |||||||||
| 052338221403022 (catalog ) | L2.5 | 5 | 9 | ||||||||||
| 003616171821104 (catalog ) | LSPM J00361821 | L3.5 | 20 | 15 | |||||||||
| 122815231547342 AB (catalog ) | L5 | 5 | 5 | ||||||||||
| 150747691627386 (catalog ) | L5 | 20 | 9 | ||||||||||
Note. — Rows marked with a pilcrow (¶) indicate sources with new measurements presented in this work. Col. (3) is spectral type. Cols. (4) and (5) are from 2MASS (Skrutskie et al., 2006). Col. (7) is the bolometric luminosity, the calculation of which is described in the Appendix; note that here it is given in units of , not cgs.
References. — Columns are (S), spectral type; and (D), distance. [1] Henry et al. (1994), [2] van Altena et al. (1995), [3] Kirkpatrick et al. (1991), [4] Lépine et al. (2009), [5] Cruz et al. (2003), [6] Gliese & Jahreiß (1991), [7] Crifo et al. (2005), [8] Gatewood & Coban (2009), [9] Cruz et al. (2007), [10] Freed et al. (2003), [11] Berger et al. (2008b), [12] Zapatero Osorio et al. (2004), [13] Stelzer (2004), [14] Reiners & Basri (2010), [15] Reid et al. (2008), [16] Reid et al. (1995), [17] McLean et al. (2012), [18] Berger et al. (2009), [19] Berger et al. (2010), [20] Berger et al. (2005)
| Band | Factor |
|---|---|
| (keV) | |
| – | |
| – | |
| – | |
| – | |
| – | |
| – | |
| – | |
| – | |
| – |
Although we focused on X-ray and radio fluxes when constructing our database, it contains many ancillary measurements such as distances, spectral types, photometry, and effective temperatures. It is compiled from simple textual tables that are maintained in the Git distributed version control system, taking inspiration from the architecture of the Open Exoplanet Catalogue (Rein, 2012). Its design is intended to enable continuous refinement in a decentralized, collaborative manner. Further details will be presented in a future publication.
5.1. X-Ray Luminosity vs. Spectral Type
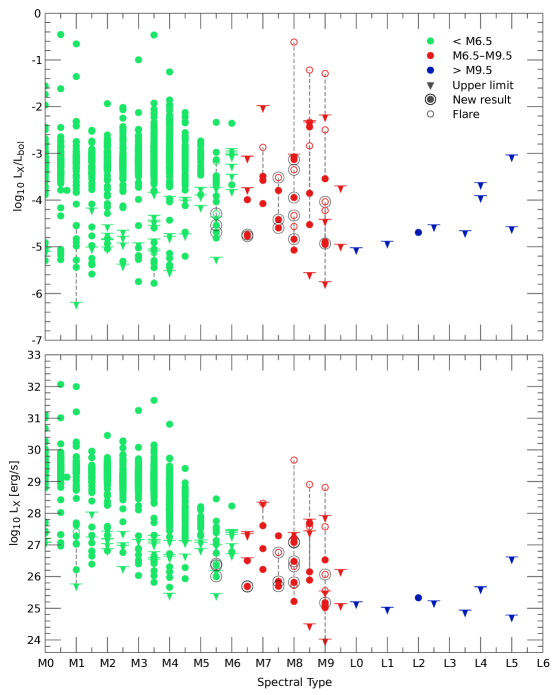
Low-mass stars of spectral types earlier than M6 obey an X-ray activity/rotation relationship with “saturation” at (Pizzolato et al., 2003; Jeffries et al., 2011; Wright et al., 2011). Because main-sequence late-type stars are generally rapid rotators (Irwin & Bouvier, 2008), most of them have X-ray emission around this saturation level, as demonstrated in Figure 5. The M6 objects in this figure having are likely flares. All come from the work of Riaz et al. (2006), who obtained 1080 M dwarf X-ray fluxes from the ROSAT All-Sky Survey, a fraction of which will inevitably have been measured during a flare. All of the M6 objects with and measured are slow rotators, and thus their low levels of X-ray emission are expected. There is a noticeable underdensity of sources with or ; it can also be seen clearly in the data of Pizzolato et al. (2003). This underdensity is reminiscent of the “Vaughan-Preston gap” (Vaughan & Preston, 1980), a similar feature seen in the distribution of various chromospheric activity indicators observed in F and G stars, for which a variety of explanations have been offered, including changes in dynamo modes, evolutionary stages of rapid angular momentum loss, or two distinct waves of star formation in the solar neighborhood (e.g., Durney et al., 1981). Somewhat surprisingly, we are unable to locate in the literature any investigation of this feature; such an undertaking is beyond the scope of this work.
Figure 5 shows that our observations lend further support to the conclusion that the standard X-ray “saturation” effect breaks down at spectral types M6 (Fleming et al., 2003; Berger et al., 2010), an effect that is also seen in (Gizis et al., 2000; Mohanty & Basri, 2003). Although the cause of this breakdown has been the subject of much study, the number of detected objects is small while there are many possibly-relevant physical effects: decreasing , increasing rotation, a disappearing radiative core, and an increasingly dipolar magnetic field (Morin et al., 2008). The role of rotation is of particular interest because of its known effect on X-ray activity and its strong correlation with spectral type; this issue is explored in Paper ii.
The data show a similar breakdown in terms of , with for spectral types M4 but decreasing by 1 dex for each later spectral subtype. This empirical relationship indicates a breakdown of the relationship around where full convection sets in, at spectral types of M3.5–M4 (Chabrier & Baraffe, 2000). Furthermore, there are indications that it may be more appropriate to consider rather than in this regime: results from Zeeman-Doppler imaging studies suggest that mid-to-late M dwarfs harbor relatively weak, disordered magnetic fields similar to those of slowly-rotating solar-type stars (Morin et al., 2010), and there is substantially less scatter in the slow-rotator region of the X-ray activity/rotation relationship when rather then is considered (Pizzolato et al., 2003).
5.2. The Güdel-Benz Relation
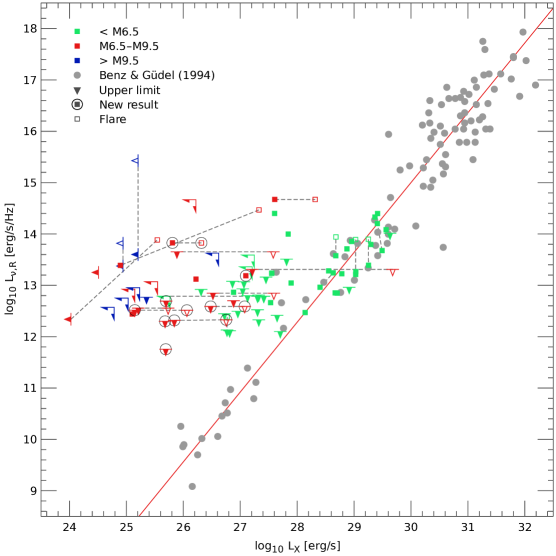
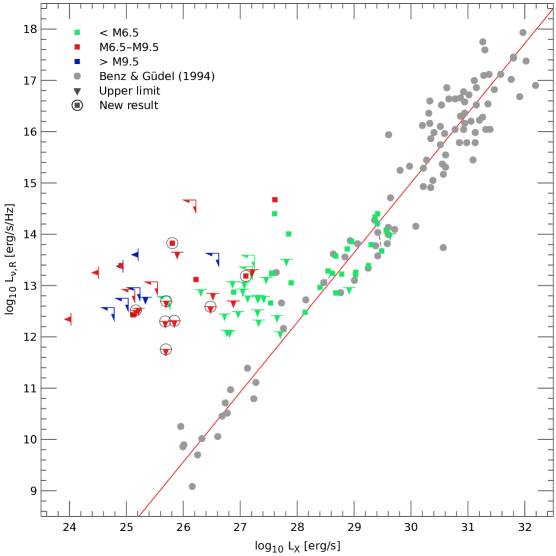
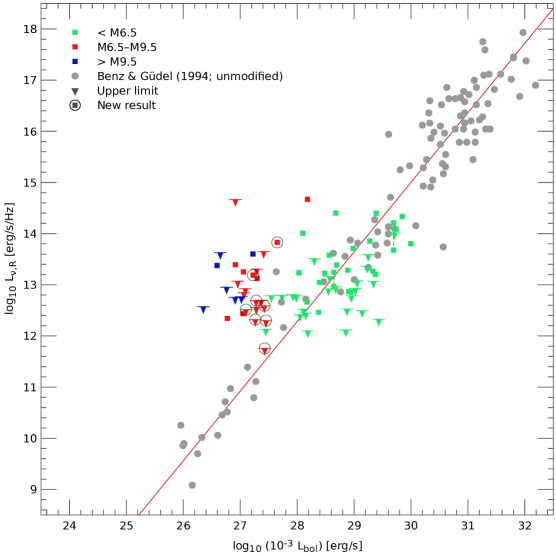
Our paired radio and X-ray observations allow us to consider ultracool dwarfs in the context of the GBR. This is particularly salient in the UCD regime because the first detection of radio emission from a brown dwarf implied a severe divergence from the GBR (Berger et al., 2001), and subsequent observations have confirmed that this divergence is not uncommon (e.g., Berger et al., 2008a, 2010). In Figure 6, we plot our full database of UCDs with both radio and X-ray measurements as well as the original data of Benz & Güdel (1994). Figure 7 is similar but omits known flares. In these and several subsequent plots, we show the best linear fit to the Benz & Güdel (1994) data from Berger et al. (2010),
| (2) |
The scatter of the Benz & Güdel (1994) data around this fit is 0.6 dex when is treated as an independent variable (i.e., the distance from the best-fit line is measured at fixed ). The scatter relative to the best-fit line (i.e., measured perpendicular to it) is 0.2 dex. In the Benz & Güdel (1994) dMe data, typically, a value we adopt as a reference when quantifying radio over-luminosity relative to the GBR.
As may be seen in Figure 6, almost all of our new results could be consistent with the established GBR. Since the radio upper limits are 2 dex above the best-fit line. The lone new radio detection, LHS 2397a AB, has and lies 1.3 dex away from the best-fit line. It is thus an outlier but not nearly as extreme as, for example, TVLM 513–46546, which has and is 3.2 dex away from the fit in quiescence. We find no significant signs of variability in the emission of LHS 2397a AB in either band, which suggests that the observed fluxes correspond to a quiescent rather than flaring state. LP 349–25 AB, for which we have combined a new X-ray analysis with a radio measurement from the literature, has and lies 2.7 dex away from the best-fit line in quiescence, making it a strong violator of the GBR.
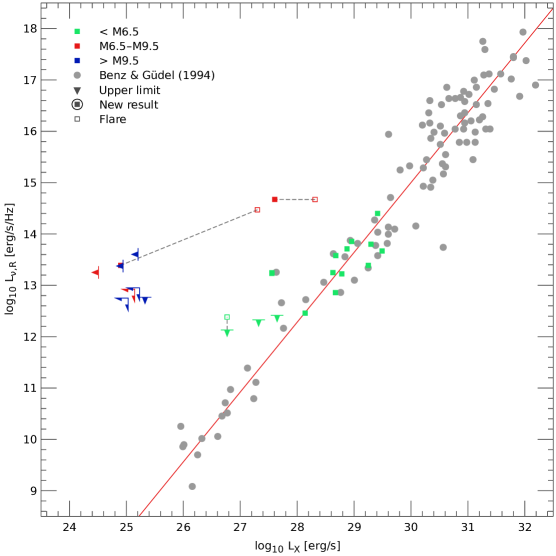
UCD emission in both the radio and X-ray bands can show significant flaring during typical observational timescales (e.g., Berger et al., 2001; Burgasser & Putman, 2005; Rutledge et al., 2000; Stelzer et al., 2006b), and the radio emission is additionally known to evolve over year timescales in some cases (e.g., Antonova et al., 2007). The simultaneity of measurements is thus important to consider in the context of the GBR. In Table .3.3, we annotate which radio/X-ray measurements arise from simultaneous observations, and we isolate these measurements in Figure 8. Simultaneous observations constitute about one third of the existing dataset, with many of the measurements coming from an observational campaign we have conducted over the past several years (Berger et al., 2005, 2008b, 2008a, 2009, 2010, Williams et al., in preparation). These simultaneous measurements include several of the most extreme GBR violators, showing that strong divergence from the GBR is a genuine phenomenon and not merely due to flaring. There is only one simultaneously-observed UCD to be detected in the X-ray but not the radio: the L2+L3.5 (1 subtype) binary Kelu-1 AB (Audard et al., 2007). Its detection by Chandra was marginal (4 counts), precluding a detailed analysis.
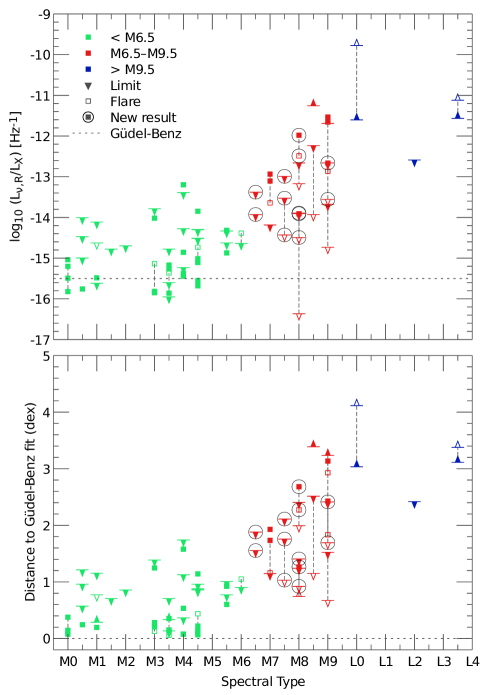
In Figure 9 we plot as a function of spectral type. There is clear evidence for new behavior at spectral types M7: while there are no measurements of in objects earlier than M7, there are seven in later objects. The lower panel plots distance from the GBR linear fit (Equation 2) rather than the simple ratio . As can be seen, the choice of ordinate does not significantly affect the structure of the data, and we discuss trends in terms of because that quantity is closer to the observables.
In both panels of Figure 9, divergence from the GBR seems to increase unconditionally with spectral type. This seeming trend is partially misleading because of radio sensitivity limitations. While there is new behavior at spectral types M7, a population of M7 objects consistent with the early- and mid-M dwarfs () is not excluded. The new observations presented in this work, which are of nearby objects and were obtained with a highly sensitive radio telescope (the upgraded VLA), reach limits of . As shown in Figure 6, our data include the most sensitive upper limit on M dwarf radio emission available, for LHS 292. Nonetheless, in our sample , so that we are insensitive to . A source obeying the GBR with and pc would have a radio flux density of nJy, accessible only to the proposed Square Kilometer Array (SKA; Carilli & Rawlings, 2004). Until the arrival of an SKA-class telescope, the only way to probe UCDs in this regime will be through observations of objects at distances of 3 pc, such as the recently-discovered L/T binary Luhman 16 (Luhman, 2013; Burgasser et al., 2013).
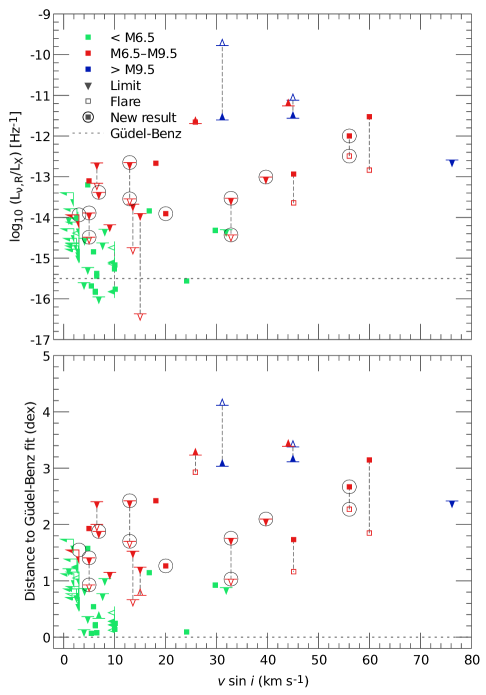
Another issue affecting Figure 9 is the correlation between mass and rotational velocity in main-sequence late-type stars (e.g., Irwin & Bouvier, 2008), which obscures the true physical process underlying the observed trend. We plot as a function of in Figure 10. Similar to Figure 9, appears to increase with but the trend requires care in interpretation. Along with the limitations in sensitivity to small values of , some objects with low values of may be rapid rotators seen at low inclinations. In this context, it is striking that out of 13 objects with km s-1, seven have ; that is, the fraction of radio-over-luminous objects is large. The lack of radio-over-luminous sources with small values of is consistent with the argument of Hallinan et al. (2008) that viewing angle is an important factor affecting the observed radio emission: if increases with but is independent of , there should exist sources seen nearly pole-on with low values of and large radio excess. Such sources have not yet been observed. The presence of both lower and upper limits at high values of prevents a simple characterization of the trend in . A more full analysis should not only account for inclination effects, but also for source-to-source variation. Studies of the relationship between X-ray emission and rotation have shown that a useful parameter for doing so is the Rossby number, , where is the rotation period and is the characteristic convective overturn time (Noyes et al., 1984; Pizzolato et al., 2003). We pursue these matters in Paper ii.
Finally, although we have discussed departure from the GBR in terms of “radio over-luminosity,” it could clearly be expressed in terms of “X-ray under-luminosity” as well, a framing well-motivated by the dropoff in seen in UCDs. This prompts us to consider a modification of the GBR in terms of the benchmark “saturation” level of X-ray emission, defining . In Figure 11 we plot the same radio data as in Figure 6 but replace with . We omit flaring measurements and do not alter the data from Benz & Güdel (1994). As should be expected from Figure 5, the UCD measurements move closer to the canonical GBR. The data for objects M6.5 straddle the canonical relation nicely, with a substantial subset of measurements that are radio underluminous. The UCDs, however, remain displaced to the left of the GBR; in other words, even if they emitted X-rays at the canonical “saturation” level, they would still be over-luminous in the radio. Any explanation of GBR divergence in UCDs must therefore not merely account for the suppression of X-ray emission relative to the stellar “saturation” trends, but also account for a comparative increase in radio emission. For instance, if the suppression of UCD X-ray emission is entirely due to less efficient heating of the corona leading to a temperature appreciably lower than the typical coronal value of 1 keV (e.g., Berger et al., 2008a), a mechanism must still be proposed to explain the unexpectedly bright radio emission. We argue below that in the radio-over-luminous sources, no longer scales with .
5.3. Summary of Observed Trends
The X-ray emission of UCDs drops off rapidly with spectral type, with slightly different properties depending on whether or is considered (Figure 5). Some UCDs diverge strongly from the GBR, with values of exceeding the typical value of by 4 orders of magnitude; others may be consistent with it, with the limited sensitivity of radio observations allowing us only to conclude that (Figure 6). Although variability is an important consideration, extreme GBR divergence is seen in simultaneous radio and X-ray observations, confirming its reality (Figure 8). More extreme divergence from the GBR seems to become possible at later spectral types (Figure 9). Even if UCD X-ray activity () did not drop off rapidly with spectral type, but rather remained at the standard “saturation” level of , UCDs would still be radio-over-luminous compared to the GBR (Figure 11).
The interpretation of these trends is complicated by the correlation between mass and rotational velocity in main-sequence late-type stars (e.g., Irwin & Bouvier, 2008). Only objects with km s-1 are seen to diverge strongly from the GBR, and 50% of such objects do so (Figure 10). Although we discuss the role of rotation below, we defer detailed investigation of the relationship between rotation and magnetic activity in UCDs to Paper ii.
6. Discussion
Our results underscore the wide range of magnetic phenomenology seen in the UCD regime. For instance, our new observations of the M7.5 dwarf LP 851–346 yield a radio over-luminosity of 2.5 orders of magnitude. Meanwhile, simultaneous observations of the nearby M8.5 dwarf LSR J18353259 have revealed a radio over-luminosity of 5 orders of magnitude (Berger et al., 2008b; Hallinan et al., 2008); this assessment is relative to its mean radio emission (0.5 mJy), not the bright, highly polarized pulses that it has also been seen to emit (2 mJy; Hallinan et al., 2008). Both objects are relatively rapid rotators, with and km s-1, respectively. (We emphasize that while inclination effects may cause a rapid rotator to appear as a slow rotator, they cannot cause a slow rotator to appear as a rapid rotator.) Both are nearby (9.7 and 5.7 pc; Crifo et al., 2005; Reid et al., 2003), and neither is known to have a companion (e.g., Faherty et al., 2009; Siegler et al., 2005). Despite these similarities, our new data show that while LP 851–346 is least an order of magnitude brighter than LSR J18353259 in the X-ray, it is also at least an order of magnitude fainter in the radio.
Stelzer et al. (2012) considered the GBR in the UCD regime and proposed the existence of two populations: one comprising rapidly rotating, radio-bright, X-ray-dim UCDs; the other comprising slower-rotating, radio-dim, X-ray-bright objects. They additionally noted that only the radio-bright objects display bright, highly polarized radio pulses, while only the radio-dim objects produce X-ray flares, with the exception of LP 944–20 which seems to flare in both bands. Our data show that rotational velocity is not strictly tied to this dichotomy. LP 851–346 and NLTT 40026 are both rapid rotators (33 and 40 km s-1, respectively) that are nonetheless radio dim and X-ray bright. The late-M binary NLTT 33370 AB is also a rapid rotator (45 km s-1; McLean et al., 2011) that has relatively low divergence from the GBR, being radio over-luminous by 2.5 orders of magnitude in quiescence (Williams et al., in preparation).
We propose that the range of observed UCD behavior may be due to varying topology of their magnetic fields. In their study of the relationship between rotation and radio activity in UCDs, McLean et al. (2012) proposed such a connection; here, we extend it to include X-ray emission as well. The connection to magnetic topology is motivated by a series of studies of M dwarfs using Zeeman-Doppler imaging (ZDI) techniques (Donati et al., 2008; Morin et al., 2008, 2010). In ZDI, the magnetic field topology is reconstructed from measurements of the Zeeman effect in time-resolved optical spectropolarimetry (Semel, 1989)222While the Zeeman effect provides a direct measurement of the field, it is important to note that the quantity being measured is the net signed field in each resolution element. FeH spectroscopy, discussed below, probes the magnitude but not the topology of the unsigned field.. Morin et al. (2010) find that some M dwarfs have strong, axisymmetric fields, while others have fields that are weak and non-axisymmetric. While early-M dwarfs inhabit the weak-field regime and mid-M dwarfs inhabit the strong-field regime, late-M dwarfs inhabit both regimes. This observational finding led Morin et al. (2010) to propose two magnetic dynamo modes leading to differing magnetic topologies, with late-M dwarfs having a bistable dynamo that may inhabit either mode. This concept is supported by recent results from geodynamo simulations that show bimodal dynamo outcomes in rapid rotators (Morin et al., 2011; Gastine et al., 2013).
We suggest that UCDs with strong, axisymmetric fields tend to have values of in line with the GBR, while the ones with weak, non-axisymmetric fields are radio over-luminous. Slow rotators (20 km s-1) have strong-field dynamos and thus stay close the GBR, as found by Stelzer et al. (2012). Rapid rotators may have dynamos in either mode, so some are strong GBR violators while others are not, explaining the results of McLean et al. (2012) and this work. The association of sources that stay near the GBR with strong fields provides continuity with the ZDI and X-ray observational results for mid-M dwarfs. The similar patterns seen in the ZDI topology and results are the primary motivation for our hypothesis.
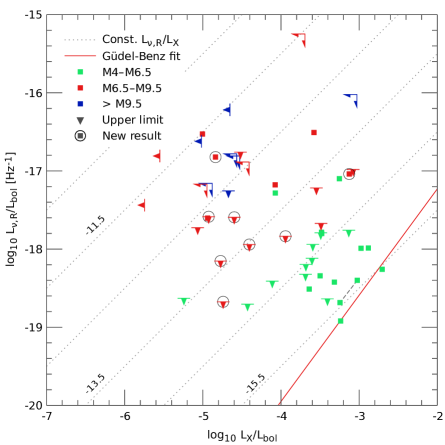
We have described the difference between the proposed strong-field and weak-field sources in terms of , and argued that the weak-field sources are radio over-luminous and X-ray under-luminous. However, the weak-field sources also tend to have later spectral types, and as shown in Figure 5 these sources have lower values of . Some component of the X-ray under-luminosity of the weak-field sources may be due to their cooler temperates rather than the proposed effects of field topology. To clarify this issue, we plot in Figure 12 a modified Güdel-Benz relation in which we restrict the data to fully-convective dwarfs and normalize by , thereby rearranging the data points along lines of constant . It is noteworthy that even after accounting for changes in , the radio-bright sources are still X-ray underluminous compared to the radio-dim ones. Hypothetically, if the mean of the radio-bright objects were much lower than that of the radio-dim objects, the two groups might have indistinguishable values of , and the scatter in Figure 12 might be narrow in the direction and broad in the direction. This is not the case. Instead, even after taking the changing into account, the radio-bright sources seem to require both smaller and larger . We argue below that for the radio-bright sources is in fact a more appropriate quantity to consider than , whereas for the radio-faint ones the opposite is true.
The obvious issue to consider in the bimodal dynamo scenario is how the two field topologies lead to such different values of . We start first with the weak-field, radio-bright mode. It is plausible that this mode extracts energy from stellar convective motions less efficiently than the strong-field mode, leading to a decrease in overall magnetic activity that manifests itself in decreased compared to the strong-field objects. Meanwhile, Figure 6 shows that these objects tend to have similar values of . We conjecture that in this mode, tangled magnetic field structures lead to persistent small-scale reconnection events that are sufficient to maintain a population of gyrosynchrotron-emitting electrons filling a coronal region a few stellar radii () in size. This model has already been suggested for the radio-bright sources (e.g., Berger et al., 2008b, 2009; McLean et al., 2011). Because the radio luminosity is energetically unimportant compared to or , the radio-emitting population could be maintained even at very low levels of magnetic activity. The observed spectral luminosity , where is the brightness temperature and is the characteristic size of the emitting region. In the UCD regime, with very weak dependence on mass. Supposing , we find that in the radio-bright population K. These results are consistent with values found in the dM1e binary YY Gem, for which K and were derived from VLBI observations (Alef et al., 1997). Taking to be insensitive to mass, should be a characteristic value for radio-bright UCDs observed at 8.5 GHz. Hallinan et al. (2008) pointed out the relatively stable values of across the M spectral type and argued for a different emission mechanism (see below). Our interpretation differs in that we argue that emission from early-M dwarfs is instead due to magnetic reconnection in the standard chromospheric heating picture, leading to consistency with the GBR. In this scenario, the similar values of in the early-M dwarfs and the radio-bright UCDs are coincidental.
In the strong-field mode, we hypothesize that the coupling to internal stellar convective motions is stronger, resulting in comparatively higher levels of magnetic activity and . These are nonetheless lower than what is found in rapidly-rotating earlier-type stars, an effect often attributed to the outer layers of UCD atmospheres becoming appreciably neutral, reducing their coupling to the coronal magnetic field and thus their ability to inject energy into it through surface convective motions (Mohanty et al., 2002). The standard chromospheric evaporation model still applies, leading to values of compatible with the GBR. However, these objects are apparently unable to sustain a corona-filling population of gyrosynchrotron-emitting particles, perhaps because reconnection events are simply too rare. The rarer reconnection events would be more energetic than those seen in the weak-field sources, perhaps explaining the observation of Stelzer et al. (2012) that the radio-quiet sources are seen to flare in the X-ray while the radio-loud ones are not. This may also explain the conjecture of Robrade et al. (2010) that some UCDs exhibit large X-ray flares and low-level X-ray variability but, unlike active early-M dwarfs, not a continuous spectrum of flare energies.
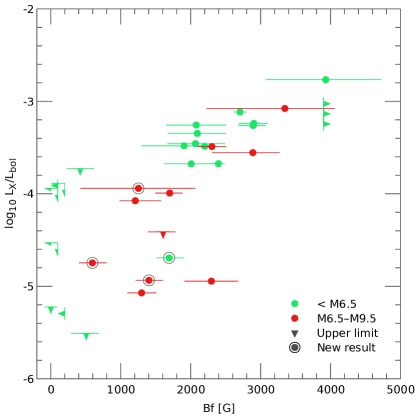
This model posits that UCDs with stronger magnetic fields should be associated with higher values of . Figure 13 shows that this is qualitatively the case when the field strength is diagnosed with FeH spectroscopy (Reiners & Basri, 2006), a technique that has the advantage of having been applied to numerous cool dwarfs (Reiners & Basri, 2007; Reiners et al., 2009; Reiners & Basri, 2010). This technique measures , the average unsigned magnetic field at the photosphere with being a filling factor term. ZDI, being sensitive to the net signed field in each resolution element, measures strictly smaller values. Despite this distinction, the two measures are generally correlated, with ZDI values being 5–15% of FeH values depending on mass (Reiners & Basri, 2009; Morin et al., 2010). A correlation similar to that in Figure 13 exists between and (Reiners & Basri, 2010). Figure 12 shows that the very radio-bright UCDs have ; the five UCDs in Figure 13 meeting this criterion (2MASSI J1048147395606, LHS 292, LHS 2924, LP 647–13, vB 10) have relatively low values of kG. Three UCDs have and kG (LHS 248, LHS 3003, LHS 3406), consistent with the idea that both field topology and field strength are important parameters. All of the objects with kG have .
A striking characteristic of the radio-bright UCDs is that several of them emit periodic, bright, highly polarized radio pulses (Hallinan et al., 2006, 2008; Berger et al., 2008a, 2009). These are characteristic of the electron cyclotron maser instability (ECMI; Wu & Lee, 1979; Treumann, 2006), a coherent process that results in radio emission at the cyclotron frequency . This process is responsible for auroral radio bursts in the magnetic solar system planets, which have many similarities to those observed in the UCDs (Zarka, 1998). In particular, the periodic nature of the pulses is strongly suggestive of beamed emission tied to the stellar rotation. We suggest that, despite their generally tangled fields, the weak-field sources are able to maintain the large-scale converging magnetic structures needed to produce these auroral bursts. These structures need not dominate the ZDI-diagnosed field since their footpoints may cover only a small fraction of the photosphere; hence their possible existence is not inconsistent with the overall finding of a weak, non-axisymmetric field. (In Morin et al. (2010), the ratio of the maximum and mean ZDI-diagnosed fields, , can exceed 5, and may be underestimated if the filling factor of the relevant field structure is low.) We have argued that the weak-field sources maintain a population of energetic electrons filling the coronal volume, providing a continual supply of particles capable of driving the bursts as well. The strong-field sources are likely also able to maintain the requisite converging fields but, lacking the corona-filling supply of particles, do not display the periodic bursts. As pointed out by Stelzer et al. (2012), however, the strong-field sources are slower rotators, and so the lack of observed bursts may be a selection effect because UCD radio observations are generally shorter in duration than the rotational period. Hallinan et al. (2008) identify another possible selection effect, providing evidence that the sources with ECMI bursts are observed at high inclinations.
Hallinan et al. (2006, 2008) further argue that the GBR violators are radio bright because the vast majority of their radio emission is due to the ECMI, including the non-burst emission that has generally been attributed to gyrosynchrotron processes (e.g., Berger, 2002, 2006). They suggest that depolarization and steady particle acceleration could cause ECMI emission to have the low variability and polarization that are associated with the non-burst emission of these sources. While this argument may apply to some UCDs, we disfavor its application to all of them, because it calls for an implausible physical configuration in sources such as 2MASS J074642562000321. This L dwarf binary periodically emits rapid (100 s) pulses of 10 mJy and 100% circular polarization atop seemingly quiescent emission at 0.3 mJy with 15% circular polarization and a spectral index of () (Berger et al., 2009). Any variation besides the pulses is at the 1 mJy level. If the quiescent emission also originates in the ECMI, two emitting regions of identical field strengths would be required, both with the physical conditions suitable for ECMI cascade, but producing vastly different observed emission. It seems simpler to posit that both ECMI and gyrosynchrotron emission occur in this case. In other sources such as 2MASS J003616171821104, both polarized and unpolarized emission of comparable flux densities and variability characteristics are observed, and the arguments of Hallinan et al. (2006, 2008) are more persuasive.
In our scenario it is still not entirely clear what factors determine the overall level of magnetic activity, i.e. . There are substantial correlations among , spectral type (Figure 5), GBR deviation (Figure 12), and rotational velocity (Paper ii). In the quest to understand these interconnections, two particular issues call for investigation. The first is to what extent the observed UCD “supersaturation”-like effect, an anticorrelation between and (Berger et al., 2010), is a causal relationship, relating perhaps to evolution in the nature of the dynamo. The second is the question of which processes drive the observed dropoff in as a function of spectral type (Figure 5), relating perhaps to rotation, changes in internal structure, or increased photospheric neutrality (Mohanty et al., 2002). Because of the correlations among the variables in question, the role of rotation must be considered carefully in attempts to resolve these issues, and so we defer further analysis to Paper ii.
Finally, we wish to emphasize that although we have discussed a model of two distinct dynamo modes, these modes are not necessarily mutually exclusive within a given source – it is plausible that one object could host multiple field-generating processes. With a sample of 29 sources and many non-detections, it would be premature to claim that there are two distinct subpopulations.
7. Summary and Conclusions
We presented new X-ray (Chandra) and radio (VLA) observations of seven ultracool dwarfs with spectral types between M6.5 and M9.5 and a wide range of . We have detected all of them in the X-ray band, nearly doubling the number of UCDs with X-ray detections. Despite the increased sensitivity of the upgraded VLA, only one of the sources was detected in the radio. Our results are thus broadly consistent with the Güdel-Benz relationship between radio and X-ray emission in stellar flare phenomena, though they still admit radio over-luminosities of a factor of . This is in contrast to several spectacular recent results, in which some UCDs are seen to be radio-over-luminous by 5 orders of magnitude. Although UCDs are highly variable in both bands, making simultaneous observations important tools in the analysis of correlations such as the GBR, we have argued that the nonsimultaneity of our observations does not significantly affect their interpretation.
We have also assembled a comprehensive sample of UCDs with both radio and X-ray observations (Figure 6; Table .3.3), including all known measurements in which the observations were simultaneous. With the addition of our new measurements, there is strong evidence that UCDs display a wide range of behavior with regards to the GBR: some are strongly radio over-luminous, while others could be consistent with it. This range can be, and has been, interpreted as a bimodality in the UCD population (McLean et al., 2012; Stelzer et al., 2012), which has support from both ZDI observations and geodynamo simulations (Morin et al., 2010; Gastine et al., 2013). We have argued that one group of sources can maintain a population of gyrosynchrotron-emitting particles in the corona, setting an effective floor on , while the other group is less active than earlier-type stars but emits following the standard chromospheric evaporation model. Interpretation of the data, however, is made difficult by the many variables at play: , , , age, metallicity, binarity, and long- and short-term variability. It is not clear that the population can be neatly divided into two distinct subgroups at this time.
Although the study of UCD magnetism continues to present many puzzles, we see several reasons to be optimistic for the future. Studies of progressively larger samples will help clarify trends and allow more robust examination of subsamples that control for variables such as mass, age, or rotation. The upgrade of the VLA presents a major opportunity in this regard, because it is becoming clear that radio observations present the best opportunity for exploring the magnetism of the coolest objects, whose faintness and rapid rotation make extremely difficult the application of techniques such as ZDI. Furthermore, new benchmark objects are being discovered that offer the chance for detailed study. These include the radio-brightest UCD, NLTT 33370 AB (McLean et al., 2011, Williams et al., in preparation), and the coolest UCD yet detected in the radio, 2MASS J104753852124234 (T6.5; Route & Wolszczan, 2012; Williams et al., 2013). Wide-field infrared surveys and proper motion searches are discovering substantial numbers of UCDs, including extremely nearby examples such as the 2-pc L/T binary Luhman 16 (Luhman, 2013; Burgasser et al., 2013). Finally, theoretical studies of the operation of dynamo action in fully convective bodies are progressing, with numerical geodynamo models being adapted to be able to simulate density contrasts closer to those seen in UCDs (e.g., Christensen et al., 2009). Advances in all of these areas will greatly increase our understanding of the magnetism of brown dwarfs and, eventually, extrasolar planets.
References
- Alef et al. (1997) Alef, W., Benz, A. O., & Güdel, M. 1997, A&A, 317, 707
- Antonova et al. (2007) Antonova, A., Doyle, J. G., Hallinan, G., Golden, A., & Koen, C. 2007, A&A, 472, 257
- Antonova et al. (2013) Antonova, A., Hallinan, G., Doyle, J. G., et al. 2013, A&A, 549, A131
- Audard et al. (2007) Audard, M., Osten, R. A., Brown, A., et al. 2007, A&A, 471, L63
- Baliunas et al. (1996) Baliunas, S. L., Nesme-Ribes, E., Sokoloff, D., & Soon, W. H. 1996, ApJ, 460, 848
- Basri & Marcy (1995) Basri, G., & Marcy, G. W. 1995, AJ, 109, 762
- Benz & Güdel (1994) Benz, A. O., & Güdel, M. 1994, A&A, 285, 621
- Berger (2002) Berger, E. 2002, ApJ, 572, 503
- Berger (2006) —. 2006, ApJ, 648, 629
- Berger et al. (2001) Berger, E., Ball, S., Becker, K. M., et al. 2001, Nature, 410, 338
- Berger et al. (2005) Berger, E., Rutledge, R. E., Reid, I. N., et al. 2005, ApJ, 627, 960
- Berger et al. (2008a) Berger, E., Gizis, J. E., Giampapa, M. S., et al. 2008a, ApJ, 673, 1080
- Berger et al. (2008b) Berger, E., Basri, G., Gizis, J. E., et al. 2008b, ApJ, 676, 1307
- Berger et al. (2009) Berger, E., Rutledge, R. E., Phan-Bao, N., et al. 2009, ApJ, 695, 310
- Berger et al. (2010) Berger, E., Basri, G., Fleming, T. A., et al. 2010, ApJ, 709, 332
- Bower et al. (2009) Bower, G., Bolatto, A., Ford, E., & Kalas, P. 2009, ApJ, 701, 1922
- Browning (2008) Browning, M. K. 2008, ApJ, 676, 1262
- Burgasser & Putman (2005) Burgasser, A., & Putman, M. 2005, ApJ, 626, 486
- Burgasser et al. (2013) Burgasser, A., Sheppard, S., & Luhman, K. L. 2013, ApJ, submitted, arxiv:1303.7283
- Carilli & Rawlings (2004) Carilli, C., & Rawlings, S. 2004, New A Rev., 48, 979
- Carson et al. (2011) Carson, J. C., Marengo, M., Patten, B. M., et al. 2011, ApJ, 743, 141
- Casewell et al. (2008) Casewell, S. L., Jameson, R. F., & Burleigh, M. R. 2008, MNRAS, 390, 1517
- Chabrier & Baraffe (2000) Chabrier, G., & Baraffe, I. 2000, ARA&A, 38, 337
- Chabrier & Küker (2006) Chabrier, G., & Küker, M. 2006, A&A, 446, 1027
- Christensen et al. (2009) Christensen, U., Holzwarth, V., & Reiners, A. 2009, Nature, 457, 167
- Cook et al. (2013) Cook, B. A., Williams, P. K. G., & Berger, E. 2013, paired paper 2
- Costa et al. (2006) Costa, E., Méndez, R., Jao, W. C., et al. 2006, AJ, 132, 1234
- Crifo et al. (2005) Crifo, F., Phan-Bao, N., Delfosse, X., et al. 2005, A&A, 441, 653
- Cruz et al. (2003) Cruz, K., Reid, N., Liebert, J., Kirkpatrick, D., & Lowrance, P. 2003, AJ, 126, 2421
- Cruz et al. (2007) Cruz, K., Reid, N., Kirkpatrick, D., et al. 2007, AJ, 133, 439
- Cruz & Reid (2002) Cruz, K. L., & Reid, N. 2002, AJ, 123, 2828
- Dahn et al. (1986) Dahn, C. C., Liebert, J., & Harrington, R. S. 1986, AJ, 91, 621
- Deacon et al. (2005) Deacon, N. R., Hambly, N. C., & Cooke, J. A. 2005, A&A, 435, 363
- Delfosse et al. (1998) Delfosse, X., Forveille, T., Perrier, C., & Mayor, M. 1998, A&A, 331, 581
- Dennis & Zarro (1993) Dennis, B., & Zarro, D. 1993, Solar Physics, 146, 177
- Deshpande et al. (2012) Deshpande, R., Martín, E. L., Montgomery, M. M., et al. 2012, AJ, 144, 99
- Dobler et al. (2006) Dobler, W., Stix, M., & Brandenburg, A. 2006, ApJ, 638, 336
- Donati et al. (2008) Donati, J. F., Morin, J., Petit, P., et al. 2008, MNRAS, 390, 545
- Drake et al. (1989) Drake, S., Simon, T., & Linsky, J. 1989, ApJS, 71, 905
- Dupuy et al. (2010) Dupuy, T., Liu, M., Bowler, B., et al. 2010, ApJ, 721, 1725
- Dupuy et al. (2009) Dupuy, T., Liu, M., & Ireland, M. 2009, ApJ, 699, 168
- Durney et al. (1993) Durney, B. R., de Young, D. S., & Roxburgh, I. W. 1993, Solar Physics, 145, 207
- Durney et al. (1981) Durney, B. R., Mihalas, D., & Robinson, R. D. 1981, PASP, 93, 537
- Faherty et al. (2009) Faherty, J., Burgasser, A., Cruz, K., et al. 2009, AJ, 137, 1
- Fleming et al. (2003) Fleming, T. A., Giampapa, M. S., & Garza, D. 2003, ApJ, 594, 982
- Fleming et al. (1993) Fleming, T. A., Giampapa, M. S., Schmitt, J. H. M. M., & Bookbinder, J. A. 1993, ApJ, 410, 387
- Fomalont et al. (1991) Fomalont, E. B., Windhorst, R. A., Kristian, J. A., & Kellerman, K. I. 1991, AJ, 102, 1258
- Forveille et al. (2005) Forveille, T., Beuzit, J. L., Delorme, P., et al. 2005, A&A, 435, L5
- Freed et al. (2003) Freed, M., Close, L., & Siegler, N. 2003, ApJ, 584, 453
- Freeman et al. (2001) Freeman, P., Doe, S., & Siemiginowska, A. 2001, Proc. SPIE, 4477, 76
- Fruscione et al. (2006) Fruscione, A., McDowell, J., Allen, G., et al. 2006, Proc. SPIE, 6270, 62701V
- Gastine et al. (2013) Gastine, T., Morin, J., Duarte, L., et al. 2013, A&A, 549, L5
- Gatewood & Coban (2009) Gatewood, G., & Coban, L. 2009, AJ, 137, 402
- Gehrels (1986) Gehrels, N. 1986, Astrophys. J., 303, 336
- Giampapa & Liebert (1986) Giampapa, M. S., & Liebert, J. 1986, ApJ, 305, 784
- Gizis et al. (2000) Gizis, J., Monet, D., Reid, N., et al. 2000, AJ, 120, 1085
- Gliese & Jahreiß (1991) Gliese, W., & Jahreiß, H. 1991, Preliminary Version of the Third Catalogue of Nearby Stars (Heidelberg: Astron. Rechen-Institut)
- Güdel & Benz (1993) Güdel, M., & Benz, A. 1993, ApJ, 405, L63
- Güdel et al. (1996) Güdel, M., Benz, A. O., Schmitt, J. H. M. M., & Skinner, S. L. 1996, ApJ, 471, 1002
- Güdel et al. (1993) Güdel, M., Schmitt, J. H. M. M., Bookbinder, J. A., & Fleming, T. A. 1993, ApJ, 415, 236
- Guenther & Wuchterl (2003) Guenther, E. W., & Wuchterl, G. 2003, A&A, 401, 677
- Hallinan et al. (2006) Hallinan, G., Antonova, A., Doyle, J. G., et al. 2006, ApJ, 653, 690
- Hallinan et al. (2008) —. 2008, ApJ, 684, 644
- Harrington & Dahn (1984) Harrington, R. S., & Dahn, C. C. 1984, IAU Circ., 3989, 1
- Harrington et al. (1974) Harrington, R. S., Dahn, C. C., & Guetter, H. H. 1974, ApJL, 194, L87
- Henry et al. (1994) Henry, T. J., Kirkpatrick, J. D., & Simons, D. A. 1994, AJ, 108, 1437
- Irwin & Bouvier (2008) Irwin, J., & Bouvier, J. 2008, Proc. IAU, 4, 363
- Jeffries et al. (2011) Jeffries, R. D., Jackson, R. J., Briggs, K. R., Evans, P. A., & Pye, J. P. 2011, MNRAS, 411, 2099
- Jenkins et al. (2009) Jenkins, J. S., Ramsey, L. W., Jones, H. R. A., et al. 2009, ApJ, 704, 975
- Kirkpatrick et al. (1991) Kirkpatrick, J. D., Henry, T. J., & McCarthy, D. W. 1991, ApJS, 77, 417
- Koen (2013) Koen, C. 2013, MNRAS, 428, 2824
- Konopacky et al. (2010) Konopacky, Q. M., Ghez, A. M., Barman, T. S., et al. 2010, ApJ, 711, 1087
- Konopacky et al. (2012) Konopacky, Q. M., Ghez, A. M., Fabrycky, D. C., et al. 2012, ApJ, 750, 79
- Kraft et al. (1991) Kraft, R., Burrows, D., & Nousek, J. 1991, ApJ, 374, 344
- Law et al. (2008) Law, N. M., Hodgkin, S. T., & Mackay, C. D. 2008, MNRAS, 384, 150
- Lee et al. (2010) Lee, K.-G., Berger, E., & Knapp, G. 2010, ApJ, 708, 1482
- Lépine et al. (2009) Lépine, S., Thorstensen, J., Shara, M., & Rich, M. 2009, AJ, 137, 4109
- Liebert et al. (1979) Liebert, J., Dahn, C. C., Gresham, M., & Strittmatter, P. A. 1979, ApJ, 233, 226
- Liu et al. (1999) Liu, W., Hu, J. Y., Li, Z. Y., & Cao, L. 1999, ApJS, 122, 257
- Lodders (2003) Lodders, K. 2003, ApJ, 591, 1220
- Luhman (2013) Luhman, K. L. 2013, ApJL, 767, L1
- Luyten (1979) Luyten, W. 1979, New Luyten Catalogue of Stars with Proper Motions Larger than Two Tenths of an Arcsecond (Minneapolis: University of Minnesota Press)
- Luyten (1976) Luyten, W. J. 1976, A Catalogue of 1849 Stars with Proper Motions greater than 0.5′′ Annually (Minneapolis: University of Minnesota Press)
- Lyubchik et al. (2012) Lyubchik, Y., Jones, H. R. A., Pavlenko, Y. V., Pinfield, D. J., & Covey, K. R. 2012, MNRAS, 422, 2195
- Martín et al. (1999) Martín, E., Delfosse, X., Basri, G., et al. 1999, AJ, 118, 2466
- McCarthy & Zuckerman (2004) McCarthy, C., & Zuckerman, B. 2004, AJ, 127, 2871
- McCarthy et al. (1988) McCarthy, D. W., Henry, T. J., Fleming, T. A., et al. 1988, ApJ, 333, 943
- McLean et al. (2011) McLean, M., Berger, E., Irwin, J., Forbrich, J., & Reiners, A. 2011, ApJ, 741, 27
- McLean et al. (2012) McLean, M., Berger, E., & Reiners, A. 2012, ApJ, 746, 23
- McMullin et al. (2007) McMullin, J. P., Waters, B., Schiebel, D., Young, W., & Golap, K. 2007, ASP Conf. Ser., 376, 127
- Mohanty & Basri (2003) Mohanty, S., & Basri, G. 2003, ApJ, 583, 451
- Mohanty et al. (2002) Mohanty, S., Basri, G., Shu, F., Allard, F., & Chabrier, G. 2002, ApJ, 571, 469
- Morin et al. (2010) Morin, J., Donati, J. F., Petit, P., et al. 2010, MNRAS, 407, 2269
- Morin et al. (2011) Morin, J., Dormy, E., Schrinner, M., & Donati, J. F. 2011, MNRAS Lett., 418, L133
- Morin et al. (2008) Morin, J., Donati, J. F., Petit, P., et al. 2008, MNRAS, 390, 567
- Nakajima et al. (2004) Nakajima, T., Tsuji, T., & Yanagisawa, K. 2004, ApJ, 607, 499
- Nelder & Mead (1965) Nelder, J. A., & Mead, R. 1965, The Computer Journal, 7, 308
- Neupert (1968) Neupert, W. 1968, ApJ, 153, L59
- Noyes et al. (1984) Noyes, R. W., Hartmann, L. W., Baliunas, S. L., Duncan, D. K., & Vaughan, A. H. 1984, ApJ, 279, 763
- Offringa et al. (2010) Offringa, A. R., de Bruyn, A. G., Biehl, M., et al. 2010, MNRAS, 405, 155
- Offringa et al. (2012) Offringa, A. R., van de Gronde, J. J., & Roerdink, J. B. T. M. 2012, A&A, 539, A95
- Osten et al. (2005) Osten, R., Hawley, S., Allred, J., Johns-Krull, C., & Roark, C. 2005, ApJ, 621, 398
- Osten et al. (2004) Osten, R., Brown, A., Ayres, T., et al. 2004, ApJS, 153, 317
- Osten et al. (2009) Osten, R. A., Phan-Bao, N., Hawley, S. L., Reid, I. N., & Ojha, R. 2009, ApJ, 700, 1750
- Phan-Bao et al. (2007) Phan-Bao, N., Osten, R. A., Lim, L., Martín, E. L., & Ho, P. T. P. 2007, ApJ, 658, 553
- Phan-Bao et al. (2003) Phan-Bao, N., Crifo, F., Delfosse, X., et al. 2003, A&A, 401, 959
- Pizzolato et al. (2003) Pizzolato, N., Maggio, A., Micela, G., Sciortino, S., & Ventura, P. 2003, A&A, 397, 147
- Prosser et al. (1996) Prosser, C., Randich, S., Stauffer, J., Schmitt, J. H. M. M., & Simon, T. 1996, AJ, 112, 1570
- Reid et al. (2008) Reid, N., Cruz, K., Kirkpatrick, J. D., et al. 2008, AJ, 136, 1290
- Reid et al. (1995) Reid, N., Hawley, S., & Gizis, J. 1995, AJ, 110, 1838
- Reid et al. (2003) Reid, N., Cruz, K. L., Laurie, S., et al. 2003, AJ, 125, 354
- Rein (2012) Rein, H. 2012, A proposal for community driven and decentralized astronomical databases and the Open Exoplanet Catalogue, arxiv:1211.7121
- Reiners & Basri (2006) Reiners, A., & Basri, G. 2006, ApJ, 644, 497
- Reiners & Basri (2007) —. 2007, ApJ, 656, 1121
- Reiners & Basri (2008) —. 2008, ApJ, 684, 1390
- Reiners & Basri (2009) —. 2009, A&A, 496, 787
- Reiners & Basri (2010) —. 2010, ApJ, 710, 924
- Reiners et al. (2009) Reiners, A., Basri, G., & Browning, M. 2009, ApJ, 692, 538
- Riaz et al. (2006) Riaz, B., Gizis, J., & Harvin, J. 2006, AJ, 132, 866
- Robrade et al. (2010) Robrade, J., Poppenhaeger, K., & Schmitt, J. H. M. M. 2010, A&A, 513, A12
- Robrade & Schmitt (2005) Robrade, J., & Schmitt, J. H. M. M. 2005, A&A, 435, 1073
- Robrade & Schmitt (2008) —. 2008, A&A, 487, 1139
- Rodono et al. (1980) Rodono, M., Ciatti, F., & Vittone, A. 1980, AJ, 85, 298
- Rojas-Ayala et al. (2012) Rojas-Ayala, B., Covey, K., Muirhead, P., & Lloyd, J. 2012, ApJ, 748, 93
- Route & Wolszczan (2012) Route, M., & Wolszczan, A. 2012, ApJL, 747, L22
- Rutledge et al. (2000) Rutledge, R. E., Basri, G., Martín, E. L., & Bildsten, L. 2000, ApJL, 538, L141
- Sault & Wieringa (1994) Sault, R. J., & Wieringa, M. H. 1994, A&AS, 108, 585
- Scargle (1998) Scargle, J. 1998, ApJ, 504, 405
- Scargle et al. (2013) Scargle, J., Norris, J., Jackson, B., & Chiang, J. 2013, ApJ, 764, 167
- Schmidt et al. (2007) Schmidt, S., Cruz, K., Bongiorno, B., Liebert, J., & Reid, N. 2007, AJ, 2258
- Schmitt et al. (1995) Schmitt, J., Fleming, T., & Giampapa, M. 1995, ApJ, 450, 392
- Schmitt & Liefke (2002) Schmitt, J. H. M. M., & Liefke, C. 2002, A&A, 382, L9
- Schmitt & Liefke (2004) —. 2004, A&A, 417, 651
- Semel (1989) Semel, M. 1989, A&A, 225, 456
- Siegler et al. (2005) Siegler, N., Close, L., Cruz, K., Martín, E., & Reid, N. 2005, ApJ, 621, 1023
- Skrutskie et al. (2006) Skrutskie, M. F., Cutri, R. M., Stiening, R., et al. 2006, AJ, 131, 1163
- Smith et al. (2001) Smith, R., Brickhouse, N., Liedahl, D., & Raymond, J. 2001, ApJL, 556, L91
- Stelzer (2004) Stelzer, B. 2004, ApJL, 615, L153
- Stelzer et al. (2006a) Stelzer, B., Micela, G., Flaccomio, E., Neuhäuser, R., & Jayawardhana, R. 2006a, A&A, 448, 293
- Stelzer et al. (2006b) Stelzer, B., Schmitt, J. H. M. M., Micela, G., & Liefke, C. 2006b, A&A, 460, L35
- Stelzer et al. (2012) Stelzer, B., Alcalá, J., Biazzo, K., et al. 2012, A&A, 537, A94
- Treumann (2006) Treumann, R. 2006, A&A Rev., 13, 229
- van Altena et al. (1995) van Altena, W. F., Lee, J. T., & Hoffleit, E. D. 1995, The general catalogue of trigonometric parallaxes (New Haven: Yale University Observatory)
- VanderPlas et al. (2012) VanderPlas, J., Connolly, A., Ivezic, Z., & Gray, A. 2012, in 2012 Conference on Intelligent Data Understanding (IEEE), 47
- Vaughan & Preston (1980) Vaughan, A. H., & Preston, G. W. 1980, PASP, 92, 385
- Vilhu (1984) Vilhu, O. 1984, A&A, 133, 117
- Voges et al. (1999) Voges, W., Aschenbach, B., Boller, T., et al. 1999, A&A, 349, 389
- West & Basri (2009) West, A., & Basri, G. 2009, ApJ, 693, 1283
- West et al. (2004) West, A. A., Hawley, S. L., Walkowicz, L. M., et al. 2004, AJ, 128, 426
- White et al. (1989) White, S., Jackson, P., & Kundu, M. 1989, Astrophys. J. Supp., 71, 895
- Wilking et al. (1999) Wilking, B., Greene, T., & Meyer, M. 1999, AJ, 117, 469
- Williams et al. (2013) Williams, P., Berger, E., & Zauderer, A. 2013, ApJL, 767, L30
- Williams et al. (2014) Williams, P. K. G., et al. 2014, in preparation
- Wright et al. (2011) Wright, N., Drake, J., Mamajek, E., & Henry, G. 2011, ApJ, 743, 48
- Wu & Lee (1979) Wu, C. S., & Lee, L. C. 1979, ApJ, 230, 621
- Zapatero Osorio et al. (2004) Zapatero Osorio, M. R., Lane, B. F., Pavlenko, Y., et al. 2004, ApJ, 615, 958
- Zapatero Osorio et al. (2006) Zapatero Osorio, M. R., Martín, E. L., Bouy, H., et al. 2006, ApJ, 647, 1405
- Zarka (1998) Zarka, P. 1998, JGR, 103, 20159
Here we give our method for computing bolometric luminosities and discuss the properties of the sources for which we present new results.
.1. Bolometric luminosities
We compute bolometric luminosities using bolometric corrections to observed absolute magnitudes. In particular,
| (1) |
where is the absolute magnitude of the star in some band, BC is the bolometric correction in that band, and is the bolometric absolute magnitude of the Sun. For M dwarfs, we use the average of the bolometric luminosities calculated using and band magnitudes:
| (2) |
and
| (3) |
with SP = 0 (5) for spectral type M0 (M5) (Wilking et al., 1999). For L dwarfs, we use the -band magnitude only:
| (4) |
with SP used consistently as above (SP = 10 for L0) (Nakajima et al., 2004).
.2. Properties of Newly-Observed Targets
.2.1 LHS 292
LHS 292 (= GJ 3622, LP 731–58) is a nearby ( pc) M6.5 dwarf. It is a variable emitter with (Dahn et al., 1986; Lee et al., 2010; Reiners & Basri, 2010) and has been suggested as a candidate UV Cet flare star (Dahn et al., 1986). -band spectroscopy and modeling yield an estimated K and (Rojas-Ayala et al., 2012). Reiners & Basri (2010) used other spectroscopic measurements to determine km s-1 and G. ROSAT observations by Fleming et al. (1993) yielded an upper limit of in the 0.1–2.4 keV band. McLean et al. (2012) observed LHS 292 in the radio and did not detect it, obtaining a limit of Jy () at 8.46 GHz. Morin et al. (2010) used Zeeman-Doppler imaging to derive a low-resolution map of the stellar magnetic field structure. Although the S/N was low, their modeling indicates a dipolar field of 100 G with an inclination . From variability in its radial velocity on the 10 km s-1 level, Guenther & Wuchterl (2003) argue that LHS 292 is a binary system, but a companion has not yet been detected by other means.
.2.2 LHS 523
LHS 523 (= GJ 4281, LP 760–3) is an M6.5 dwarf at a distance of 11 pc. Giampapa & Liebert (1986) measured its EW to be 1.3 Å. Mohanty & Basri (2003) measure an EW of 4.4 Å () and km s-1, consistent with a later determination of km s-1 using a different method (Lyubchik et al., 2012). A proper motion of mas yr-1 has been determined (Deacon et al., 2005). Jenkins et al. (2009) determine K and M☉ from photometric modeling. LHS 523 was undetected in a ROSAT survey of very-low-mass stars (Fleming et al., 1993), with .
.2.3 LHS 2397a AB
LHS 2397a AB (= GJ 3655, LP 732–94) is an M8L7.5 binary at a distance of 14 pc. The brown dwarf companion was detected by direct imaging with adaptive optics by Freed et al. (2003). Long-term monitoring has led to a detailed model of the binary orbit (Dupuy et al., 2009; Konopacky et al., 2010), with the total system mass being estimated as (Konopacky et al., 2010). The projected rotational velocities of the primary and secondary have been measured as and , respectively (Konopacky et al., 2012). Mohanty & Basri (2003) detected strong emission with EW = 29.4 Å, computing . Comparable results were obtained by Schmidt et al. (2007), who found even stronger emission with , making it one of the most -luminous UCDs known.
.2.4 LHS 3406
LHS 3406 (= V492 Lyr, GJ 4073, LP 229–30) is an M8 dwarf at a distance of 14 pc. In an investigation of candidate cataclysmic variable systems, Liu et al. (1999) confirmed its dMe nature and measured . Subsequent activity observations by Schmidt et al. (2007) find . High-resolution spectra obtained by Reiners & Basri (2010) reveal a rotational velocity of km s-1, , and G. This is consistent with the results of Deshpande et al. (2012), who find km s-1. Previous radio observations with the VLA yielded an upper limit of Jy at 8.46 GHz (Berger, 2006). LHS 3406 was undetected in the ROSAT survey of Fleming et al. (1993) with an upper limit of . In a search for brown dwarf companions, no objects were found within limits of , (McCarthy & Zuckerman, 2004).
.2.5 LP 647–13
LP 647–13 (= NLTT 3868) is an M9 dwarf at a distance of 11 pc. In the survey of Schmidt et al. (2007), it was found that . Reiners & Basri (2010) found a rotational velocity of km s-1 as well as and G. Deshpande et al. (2012) obtain consistent results, with km s-1. Radio observations with the VLA have yielded an upper limit of Jy at 8.46 GHz (Berger, 2006).
.2.6 LP 851–346
LP 851–346 (= DENIS-P J115542.9222458) is an M7.5 dwarf at a distance of 9.7 pc. Despite the fact that it has been suspected to be a very nearby object for nearly 40 years (Luyten, 1976), it is poorly-studied. Reiners & Basri (2010) found a rotational velocity of km s-1 and . Radio observations with the VLA have yielded an upper limit of Jy at 8.46 GHz (McLean et al., 2012).
.2.7 NLTT 40026
NLTT 40026 (= LSPM J15215053) is an M7.5 dwarf at a distance of 16.1 pc. Schmidt et al. (2007) measured . Reiners & Basri (2010) measured km s-1 and . Radio observations with the VLA have yielded an upper limit of Jy at 8.46 GHz (Berger, 2006). Siegler et al. (2005) found no evidence for any companions to NLTT 40026 between 0.1–15 arcsec with a separation-dependent contrast of mag.
.3. Properties of Targets with New Analysis
.3.1 G 208-44AB/45
The G 208-44AB/45 system (= GJ 1245 ABC) is a well-studied, nearby ( pc), cool triple (McCarthy et al., 1988). G 208–44 AB (= GJ 1245 AC, LHS 3494 AB, LSPM J19534424W) is separated from G 208–45 (= GJ 1245 B, LHS 3495, LSPM J19534424E) by 7′′, and is itself a tighter binary of 1′′ separation. Both components of the overall system are flare stars (Rodono et al., 1980) and it has long been a target of activity studies (e.g., White et al., 1989). The blended pair G 208–44 AB has a radio flux density 192 Jy at 5 GHz (Bower et al., 2009), (Schmitt et al., 1995), (Mohanty & Basri, 2003), and km s-1 (Delfosse et al., 1998). Resolved measurements of G 208–44 AB are uncommon, with Law et al. (2008) recently providing the first spectral type estimate for G 208–44 B (M8.5); it is the only component of the system that fits our definition of being an ultracool dwarf. Mohanty & Basri (2003) were able to measure in G 208–44 A ( km s-1) and G 208–45 ( km s-1), but not G 208–44 B.
.3.2 DENIS 02554700
DENIS-P J025503.3470049 (= 2MUCD 10158; hereafter DENIS 02554700), an L8 dwarf at a distance of 5 pc, was identified as an extremely cool object by Martín et al. (1999), with K (Reiners & Basri, 2008). Its emission is extremely faint, (Reiners & Basri, 2008). Multiple measurements of its yield either 40 or 60 km s-1, depending on the analysis method used, likely due to its unusually late type (Mohanty & Basri, 2003; Zapatero Osorio et al., 2006; Reiners & Basri, 2008). Brown dwarf companions with separations of 7–165′′ are unlikely (Carson et al., 2011). Optical monitoring suggests short- and long-term aperiodic variations (Koen, 2013).
.3.3 LP 349–25 AB
LP 349–25 AB (= LSPM J00272219, NLTT 1470) is an M8+M9 binary at a distance of 10 pc. Gizis et al. (2000) found moderate activity in the blended system, with . Forveille et al. (2005) used adaptive-optics imaging to reveal the binarity of the system, finding a separation of 0.1′′ with mag. A measurement of the trigonometric parallax, mas, has only recently become available (Gatewood & Coban, 2009). Reiners & Basri (2010) found , in very good agreement with Gizis et al. (2000), but were unable to assess the magnetic field strength. Phan-Bao et al. (2007) discovered radio emission from the system with a flux density at 8.5 GHz of Jy. Both of the components are rapid rotators, although their projected rotational velocities differ by 15%: km s-1 and km s-1 for the A and B components, respectively (Konopacky et al., 2012). The total mass of the system is and it is also likely to be young, at Myr (Dupuy et al., 2010).
| 2MASS Identifier | SpT | [] | St. | X-Ray Band | [] | [] | [] | [] | [] | References | |||||||||||||
|---|---|---|---|---|---|---|---|---|---|---|---|---|---|---|---|---|---|---|---|---|---|---|---|
| [] | (keV) | [erg s-1] | [erg s-1 Hz-1] | [Hz-1] | [Hz-1] | ||||||||||||||||||
| (1) | (2) | (3) | (4) | (5) | (6) | (7) | (8) | (9) | (10) | (X) | (R) | ||||||||||||
| 104812581120082 (catalog ) | M6.5 | – | – | ||||||||||||||||||||
| 222854401325178 (catalog ) | M6.5 | – | – | ||||||||||||||||||||
| ¶ | 131420391320011 AB (catalog ) | M7 | Q | – | 5 | 5 | |||||||||||||||||
| ¶ | F | – | 5 | 5 | |||||||||||||||||||
| 145638312809473 (catalog ) | M7 | – | – | 7 | 8 | ||||||||||||||||||
| 165535290823401 (catalog ) | M7 | – | – | 10 | 10 | ||||||||||||||||||
| 115542862224586 (catalog ) | M7.5 | Q | – | ||||||||||||||||||||
| F | – | ||||||||||||||||||||||
| 152101035053230 (catalog ) | M7.5 | – | – | ||||||||||||||||||||
| 002755922219328 AB (catalog ) | M8 | Q | – | 8 | |||||||||||||||||||
| F | – | 8 | |||||||||||||||||||||
| 032059651854233 (catalog ) | M8 | Q | – | 14 | 8 | ||||||||||||||||||
| F | – | 14 | 8 | ||||||||||||||||||||
| 112149241313084 AB (catalog ) | M8 | – | – | ||||||||||||||||||||
| 184322134040209 (catalog ) | M8 | Q | – | ||||||||||||||||||||
| F | – | ||||||||||||||||||||||
| 191657620509021 (catalog ) | M8 | Q | – | 16 | 8 | ||||||||||||||||||
| F | – | 16 | 8 | ||||||||||||||||||||
| 145429231606039 Bab (catalog ) | M8.5 | Q | – | 19 | 8 | ||||||||||||||||||
| F | – | 19 | 8 | ||||||||||||||||||||
| ¶ | 183537903259545 (catalog ) | M8.5 | – | – | 16 | 16 | |||||||||||||||||
| 010951170343264 (catalog ) | M9 | Q | – | ||||||||||||||||||||
| F | – | ||||||||||||||||||||||
| 033935213525440 (catalog ) | M9 | Q | – | 20 | 8 | ||||||||||||||||||
| F | – | 20 | 8 | ||||||||||||||||||||
| 085336190329321 (catalog ) | M9 | Q | – | 21 | 22 | ||||||||||||||||||
| F | – | 23 | 22 | ||||||||||||||||||||
| 104814633956062 (catalog ) | M9 | – | – | 26 | 8 | ||||||||||||||||||
| 142843233310391 (catalog ) | M9 | – | – | 27 | 8 | ||||||||||||||||||
| ¶ | 150108182250020 (catalog ) | M9 | Q | – | 28 | 28 | |||||||||||||||||
| ¶ | F | – | 28 | 28 | |||||||||||||||||||
| ¶ | 002424630158201 (catalog ) | M9.5 | – | – | 30 | 30 | |||||||||||||||||
| 002741970503417 (catalog ) | M9.5 | – | – | 26 | 22 | ||||||||||||||||||
| ¶ | 074642562000321 AB (catalog ) | L0 | Q | – | 31 | 31 | |||||||||||||||||
| F | – | 31 | 8 | ||||||||||||||||||||
| ¶ | 060230453910592 (catalog ) | L1 | – | – | 30 | 30 | |||||||||||||||||
| ¶ | 130540192541059 AB (catalog ) | L2 | – | – | 32 | 32 | |||||||||||||||||
| ¶ | 052338221403022 (catalog ) | L2.5 | – | – | 30 | 30 | |||||||||||||||||
| ¶ | 003616171821104 (catalog ) | L3.5 | Q | – | 33 | 33 | |||||||||||||||||
| F | – | 33 | 22 | ||||||||||||||||||||
| 122815231547342 AB (catalog ) | L5 | – | – | 26 | 22 | ||||||||||||||||||
| 150747691627386 (catalog ) | L5 | – | – | 33 | 22 | ||||||||||||||||||
Note. — Rows marked with a pilcrow (¶) indicate simultaneous radio and X-ray observations. Col. (4) is the state of the source: quiescent (Q), flaring (F), or indeterminate/unknown (–). has been normalized to the 0.2–2 keV bandpass as described in the text.
References. — Columns are (X), X-ray flux; (R), radio flux. []: this work, [1] Henry et al. (1994), [2] van Altena et al. (1995), [3] Kirkpatrick et al. (1991), [4] Lépine et al. (2009), [5] Williams et al. (2014, in preparation), [6] Cruz et al. (2003), [7] Schmitt et al. (1995), [8] McLean et al. (2012), [9] Gliese & Jahreiß (1991), [10] Güdel et al. (1993), [11] Crifo et al. (2005), [12] Gatewood & Coban (2009), [13] Cruz et al. (2007), [14] Stelzer et al. (2006b), [15] Freed et al. (2003), [16] Berger et al. (2008b), [17] Zapatero Osorio et al. (2004), [18] Stelzer (2004), [19] Stelzer et al. (2006a), [20] Rutledge et al. (2000), [21] Robrade & Schmitt (2008), [22] Berger (2002), [23] Schmitt & Liefke (2002), [24] Reiners & Basri (2010), [25] Reid et al. (2008), [26] Stelzer et al. (2012), [27] Fleming et al. (1993), [28] Berger et al. (2008a), [29] Reid et al. (1995), [30] Berger et al. (2010), [31] Berger et al. (2009), [32] Audard et al. (2007), [33] Berger et al. (2005)