Long term observations of B2 1215+30 with VERITAS
Abstract
We report on VERITAS observations of the BL Lac object B2 1215+30 between 2008 and 2012. During this period, the source was detected at very high energies (VHE; E100 GeV) by VERITAS with a significance of and showed clear variability on time scales larger than months. In 2011, the source was found to be in a relatively bright state and a power-law fit to the differential photon spectrum yields a spectral index of with an integral flux above 200 GeV of . No short term variability could be detected during the bright state in 2011. Multi-wavelength data were obtained contemporaneous with the VERITAS observations in 2011 and cover optical (Super-LOTIS, MDM, Swift-UVOT), X-ray (Swift-XRT), and gamma-ray (Fermi-LAT) frequencies. These were used to construct the spectral energy distribution (SED) of B2 1215+30. A one-zone leptonic model is used to model the blazar emission and the results are compared to those of MAGIC from early 2011 and other VERITAS-detected blazars. The SED can be well reproduced with model parameters typical for VHE-detected BL Lacs.
1 Introduction
B2 1215+30, also commonly referred to as ON 325 or 1ES 1215+303, was first detected in the Bologna Northern Cross telescope survey conducted at 408 MHz (Colla et al., 1970). It was one of the first BL Lac-type objects to be identified (Browne, 1971) and was one member of the small set of objects used to define the class. The distance to this source is uncertain and two different redshift values, both obtained from spectroscopic measurements, can be found in the literature: z = 0.130 (Akiyama et al., 2003; NED111http://ned.ipac.caltech.edu/) and z = 0.237 (Lanzetta et al., 1993; Simbad222http://simbad.u-strasbg.fr/simbad/). A 10-minute exposure with the FAST instrument on the FLWO 60” telescope in 2011 did not yield any obvious emission lines in the continuum spectrum to resolve this discrepancy (E. Falco, priv. comm.). Similarly, no spectral features were evident in a high SN spectrum (SN 50-120 from the red to blue side) we obtained with the Lick Observatory Kast double spectrograph on the Shane 3-m telescope on 13 February 2013 (MJD 56336).
BL Lac objects and flat spectrum radio quasars (FSRQs) belong to the most extreme sub-class of active galactic nuclei (AGN), named blazars. Their relativistic jet is oriented close to the observer’s line-of-sight. They show rapid variability at all wavelengths with the fastest being observed at very high energies (VHE; E100 GeV) on time scales of minutes (Aharonian et al., 2007; Aleksić et al., 2011; Arlen et al., 2013). The spectral energy distribution (SED) of blazars is dominated by non-thermal emission and consists of two distinct, broad components. The low-energy component ranges from radio to UV/X-rays and is widely believed to be due to synchrotron emission from ultra-relativistic electrons in the jet magnetic field. To explain the origin of the second component, peaking between X-rays and gamma rays, two fundamentally different scenarios exist, dominated by either leptonic or hadronic emission. In leptonic scenarios, the high-energy radiation is produced via inverse-Compton scattering of the ultra-relativistic electrons responsible for the synchrotron emission. Possible seed photons are synchrotron photons within the jet (synchrotron self-Compton, SSC model), or external photons (external Compton, EC model) from the disk, the broad line region, or the jet. In hadronic scenarios, protons are accelerated to sufficiently high energies and the high-energy emission is dominated by neutral pion decay as well as hadronic synchrotron radiation. For a review of different blazar models see Böttcher (2012) and references therein.
Based on its SED, B2 1215+30 was suggested by Costamante & Ghisellini (2002) as a potential TeV source. It is now classified as a bright intermediate-frequency-peaked BL Lac object (IBL) based on its synchrotron peak location at Hz (Nieppola et al., 2006). It is listed in the Fermi bright-source list (Abdo et al., 2009), and appears in later Fermi catalogs (e.g. Ackermann et al., 2011), where it is classified as a high-synchrotron-peaked BL Lac (HSP).
In early January 2011, B2 1215+30 was detected in the VHE band by MAGIC during observations triggered by an optical high state (Mariotti et al., 2011). The flux above 200 GeV was with a photon spectral index of (Aleksić et al., 2012).
In this paper we report on the results of VERITAS observations taken in the direction of B2 1215+30 between December 2008 and May 2012. This blazar is in the same field of view as 1ES 1218+304333The two sources are 0.76° away from each other., a bright VHE blazar which is regularly observed by VERITAS (Benbow et al., 2011). A large part of the data presented here originates from observations taken on 1ES 1218+304.
2 VERITAS: VHE gamma-ray observations
VERITAS is an array of four imaging atmospheric Cherenkov telescopes located in southern Arizona. It is sensitive to gamma-ray energies from 100 GeV to about 30 TeV and has been fully operational since Fall 2007. Short Cherenkov light flashes produced in extensive air showers are focused by 12 m diameter reflectors onto fast-recording cameras. Each camera is equipped with 499 photomultiplier tubes with a total field of view of 3.5°. In Summer 2009, one of the four telescopes was moved to a new location. This yielded about sensitivity improvement and reduced the observation time needed to detect a 1% Crab Nebula-like source with 5 standard deviations () from 48 hours to less than 30 hours (Holder et al., 2011).
The observations reported here include observations of B2 1215+30 and 1ES 1218+304, two sources which are separated by 0.76°. All observations were taken in “wobble mode” where the source position is offset by 0.5° from the camera center to allow for simultaneous background estimation (e.g. Berge et al., 2007). Combining the observations on both sources, VERITAS observed B2 1215+30 for more than 93 hours between December 2008 and May 2012. The data are divided into three data sets, corresponding to yearly observation epochs. The first one spans 34 hours from December 2008 to May 2009 at a mean zenith angle of 20°, the second data set was recorded between January and June 2011 (42 hours) at a mean zenith angle of 15°, and the third data set was taken from January to May 2012 (17.5 hours) with a mean zenith angle of 12°. Most of the observations presented here had 1ES 1218+304 as the principal target, resulting in different pointing offsets from the position of B2 1215+30 (from 0.3° to 1.3°). Given that the radial acceptance of the camera is not flat, this causes a lower average sensitivity for the VERITAS exposure. Correcting for this effect, the total effective exposures on B2 1215+30, are 29, 38, and 15 hours for the different observation epochs.
After run selection and nightly calibration, image cleaning is performed to remove the night sky background contamination from the shower images. These images are then parameterized using a second-moment analysis (Hillas, 1985). Additionally, a log-likelihood fitting algorithm is applied to recover truncated images at the edge of the camera. After image quality cuts, the shower direction and core location are reconstructed for events having a minimum of three telescope images. For each event the energy is estimated from lookup tables, with an energy resolution of about 15-20%. To separate the gamma-ray events from the hadronic events, a set of optimized cuts based on image parameters is applied, as described in Acciari et al. (2008b). The optimization of those cuts has been performed a priori on a 5% Crab Nebula-like source and yielded an energy threshold of about 250 GeV for observations at 20° zenith angle. The remaining background is estimated using a ring-background model. The ON region is circular, centered on the source position with radius . The OFF region is defined as a ring, placed around the ON region, with inner and outer radii of 0.46° and 0.54°, respectively. The radii are chosen so that the ratio between ON and OFF area is 1:10. The normalization is given by the area ratio modified by the radial acceptance of the camera. Regions around bright stars (V magnitude 7), as well as the region around the position of 1ES 1218+304, were excluded from the background estimation.
The analysis of the total data set over the time period from December 2008 to May 2012 yields 259 events excess over background. The resulting detection significance is according to Eq. 17 in Li & Ma (1983). The results of the three observing periods are presented in Table 1. In 2011, the source was clearly detected with a significance of , while in 2008/09 and in 2012 the source is not detected with a significance greater than . Before presenting the results of these two latter periods, we concentrate on the 2011 data set where the significant detection allows for a spectral analysis.
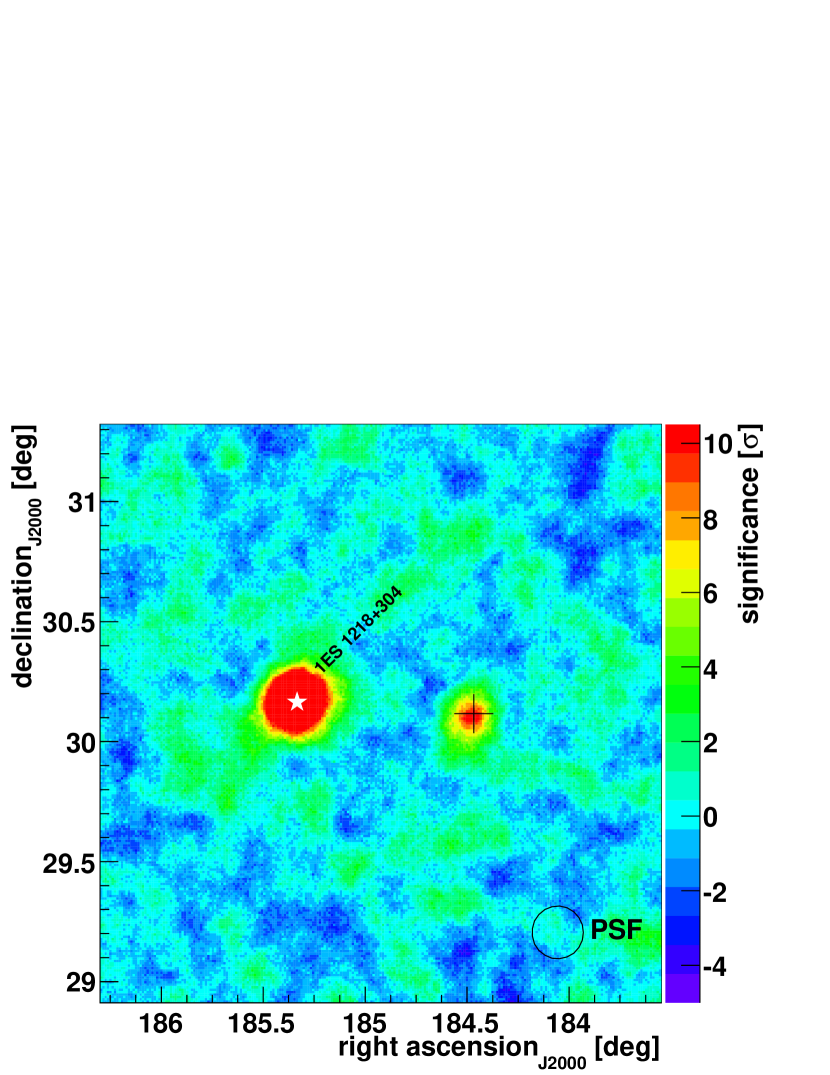
Figure 1 shows the significance sky map for the 2011 data set. To determine the position of the VHE gamma-ray emission, a symmetric 2D Gaussian was fitted to the excess sky map (binned to ) of this data set. It revealed a point-like excess with the best-fit source position at R.A. = , DEC = with a systematic uncertainty of . The VERITAS source is thus named VER J1217+301, and is positionally consistent with the BL Lac object B2 1215+30 (Ma et al., 1998).
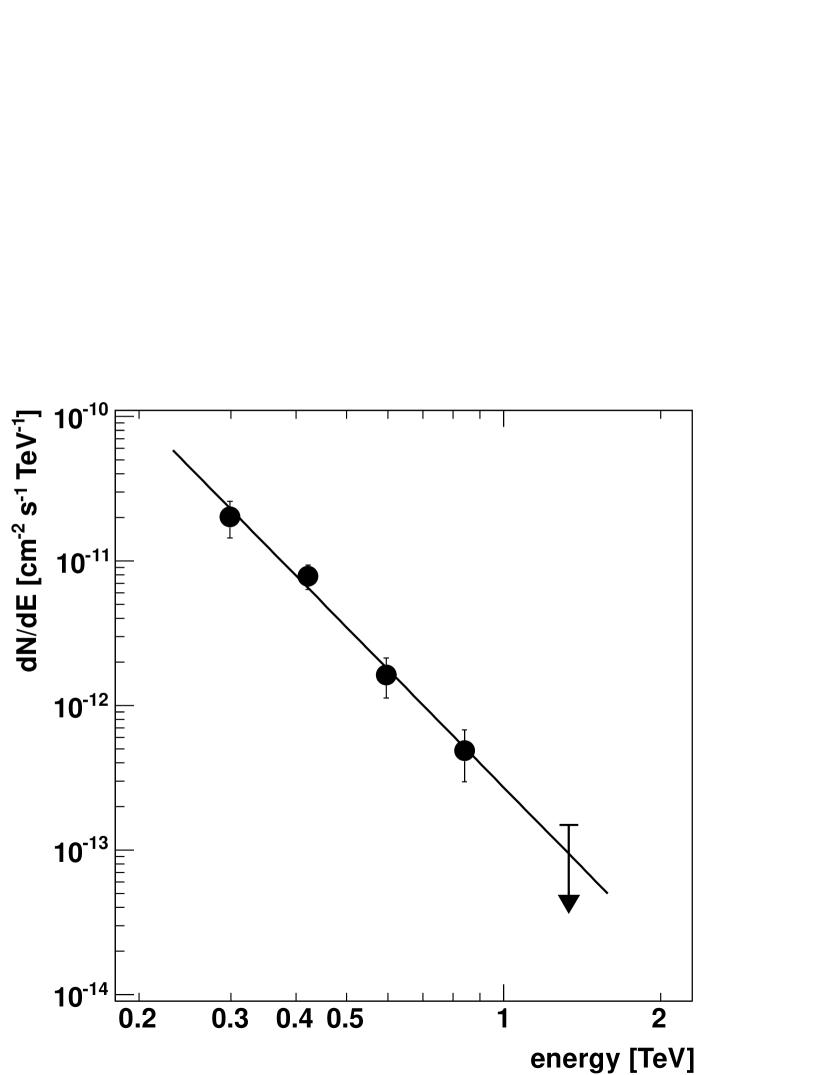
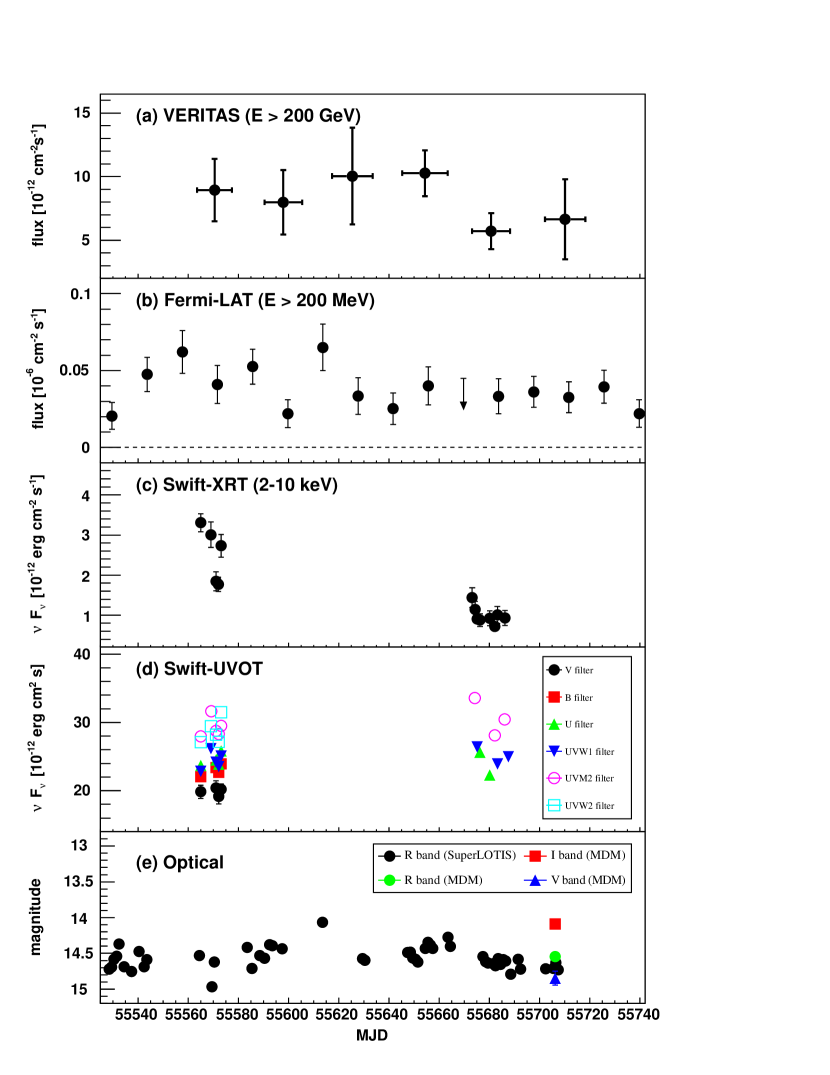
The derived differential photon spectrum of the 2011 data set is shown in Figure 2. It can be fitted by a power law (/ndf = 1.25/2): dN/dE = , with cm-2 s-1 and . The flux above 200 GeV is . This corresponds to 3.4% of the Crab Nebula flux (Hillas et al., 1998) above the same energy threshold. A 29.5-day binned light curve above 200 GeV is produced and shown in Figure 3. A constant fit to these flux points showed no evidence for deviation from a steady flux (). No significant flux variations within any monthly bin were detected either.
An analysis of the data available outside the 2011 season revealed lower gamma-ray fluxes (see Table 1). The 2008/09 data set analysis resulted in a gamma-ray excess of significance at the source location. Using the method of Helene (1983), this excess corresponds to a 99% upper limit above 200 GeV of 2% of the Crab Nebula flux, assuming the same spectral index as derived in 2011. In 2012, the source is observed with a significance of . Given that it is an established VHE emitter a flux is derived: , corresponding to about 1.2% of the Crab Nebula flux above the same energy threshold. The hypothesis of a constant flux between the three seasons is excluded at the level of . This shows that the source was significantly fainter in 2008/09 and 2012 compared to the relatively bright flux state in 2011, as shown both by MAGIC and VERITAS measurements.
3 Fermi-LAT: High-energy gamma-ray observations
The Large Area Telescope (LAT) on board the Fermi satellite is a pair-conversion gamma-ray telescope sensitive to photon energies from 20 MeV to a few hundred GeV (Atwood et al., 2009). A binned likelihood analysis was performed using the LAT ScienceTools (version v9r23p1) and P7SOURCE_V6 instrument response functions. “Diffuse” class events with in a square region of interest (ROI) of around B2 1215+30 were selected. The center of the ROI was shifted by 4° towards the bright FSRQ 4C +21.35 (8.87° away from B2 1215+30) to avoid edge effects. Further quality selection was performed by rejecting events with a zenith angle and a rocking angle in order to avoid contamination from albedo photons from the Earth’s limb. A background model was constructed including nearby gamma-ray sources and diffuse emission. All known gamma-ray sources from the second Fermi catalogue (2FGL; Nolan et al., 2012) within the ROI were included in the model. Sources outside the ROI, but within 5° of the ROI edges, were also included to account for possible photon contamination due to the large LAT point spread function. As in the 2FGL catalogue, a log-parabola function was used for sources with significant spectral curvature. Otherwise, spectra were described as a power law. The spectral parameters of the sources inside the ROI were left free during the fitting procedure. Sources outside the ROI, but within 5° of the ROI edges, had their spectral parameters fixed to the 2FGL catalog values. The galactic and extragalactic diffuse gamma-ray emission together with the residual instrumental background were also modeled using the publicly-available files444The files used were gal_2yearp7v6_v0.fits for the Galactic diffuse and iso_p7v6source.txt for the isotropic diffuse component as available at http://fermi.gsfc.nasa.gov/ssc/data/access/lat/BackgroundModels.html..
A 14-day binned light curve using the first 48 months of the Fermi mission was produced. During the period quasi-simultaneous with the 2011 VERITAS observations (MJD ), the flux above 200 MeV is compatible with being constant (), and the light curve is shown in Figure 3. A spectrum in the Fermi-LAT energy range was derived using this subset of observations only. During that 160-day period, B2 1215+30 is detected with a test statistic value of , corresponding to a significance of about . The spectrum is compatible with a power law with a photon index . The integral flux above 200 MeV is . Potential contamination from the nearby source 1ES 1218+304 (at 0.76° distance) was checked by producing a residual map; no features or asymmetries in the distribution of B2 1215+30 were seen. It is worth noting that in the GeV range the flux of 1ES 1218+304 is times that of B2 1215+30, in contrast to the VHE regime, where 1ES 1218+304 is typically much brighter.
Given the clear variability seen in the VHE band, a mean flux above 200 MeV contemporaneous with the 2008/09 and 2012 VERITAS observations was derived and is and , respectively. The hypothesis of a constant flux in the high-energy regime between the three seasons contemporaneous with the VERITAS observations can be rejected at the level.
4 Swift-XRT: X-ray observations
The X-ray telescope (XRT) on board the Swift satellite is designed to measure X-rays in the keV energy range (Burrows et al., 2005). Target of opportunity observations were obtained in January 2011 (MJD ), following the detection of VHE emission from B2 1215+30, as well as on 10 nights in April/May 2011 (MJD ). All XRT data presented here were taken in photon counting mode with negligible pile-up effects. The data reduction and calibration were done using HEASoft, XSPEC version 12.6.0 and the swxpc0to12s6_20070901v011.rmf response function. The data were grouped, requiring a minimum of 20 counts/bin, and then fitted with an absorbed power law model. The galactic column density of was used, taken from the LAB neutral hydrogen survey (Kalberla et al., 2005). When it was left free during the fit, the column density value was consistent with what was found by the LAB survey.
The spectral analysis of the two time periods shows the blazar in different states. The observations performed in January indicate a harder and brighter flux state, allowing the data to be fitted with an absorbed power law up to 10 keV. The highest integrated flux was found on MJD 55565 with and a photon index of . It will be referred to as the high X-ray state in the SED modeling section. The observations taken in April/May show the object in a lower-flux state, with too poor statistics in the individual observations in the energy bins above 5 keV to constrain a spectral fit. However, combining the exposures from all the observations of April/May allows a fit in the 0.4 to 10 keV range with an integrated flux of and a photon index of . This average spectrum is then used to represent the low X-ray state of the SED for the modeling in Section 6.
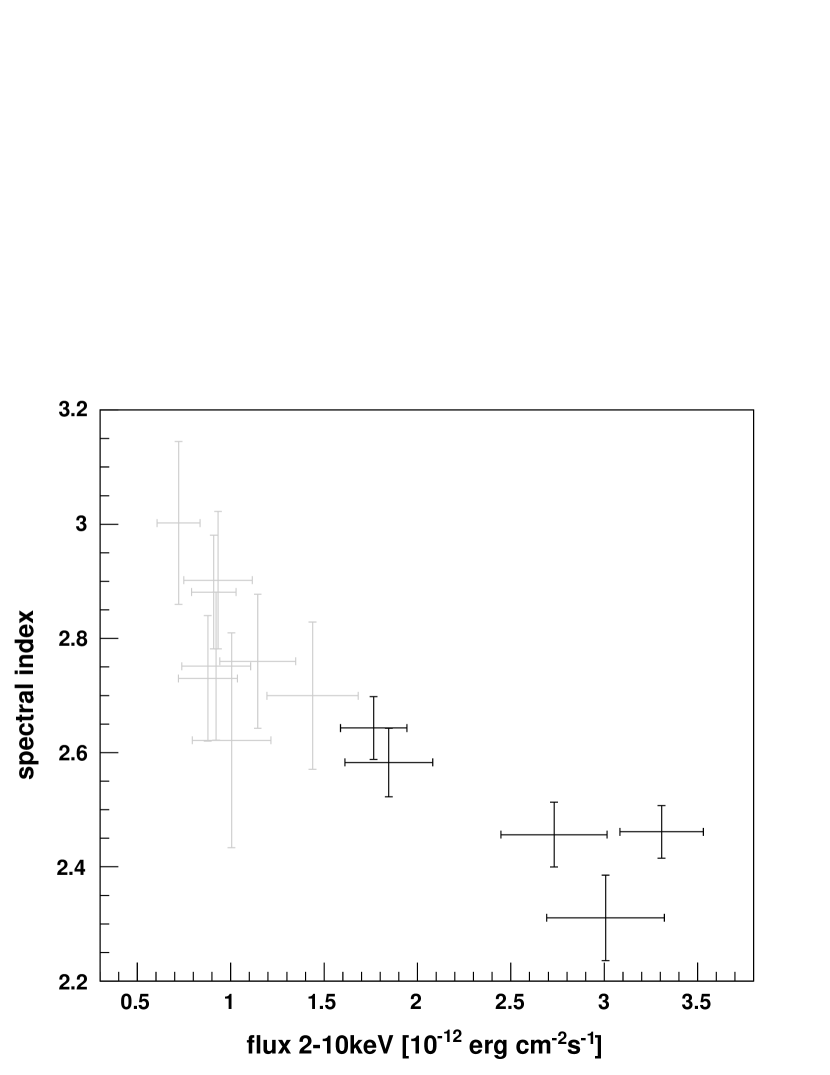
Additionally, an X-ray flux-index correlation study was performed on the entire data set. The results are shown in Figure 4. The correlation coefficient is found to be with an uncertainty of . This implies a strong (negative) correlation between spectral index and integrated flux of the X-ray observations. A similar anti-correlation could also be seen in several other VHE-emitting blazars, e.g., the IBLs VER J0521+211 (Archambault et al., 2013) or W Comae (Acciari et al., 2009c). However, this trend of “harder when brighter” is not always been observed in VHE blazars, e.g. no correlation between X-ray flux and its spectral index could be detected during the low VHE-flux state of the blazar 1ES 1959+650 (Aliu et al., 2013).
5 UV and optical observations
A Swift Ultra Violet and Optical Telescope (UVOT; Roming et al., 2005) analysis has been performed including all the observations performed between January and May 2011. Exposures were taken in V, B, U, UVW1, UVM2 and UVW2 pass bands in image mode, discarding the photon-timing information. The photometry was computed following the general prescription of Poole et al. (2008) and Breeveld et al. (2010), carefully excluding the contribution from nearby faint objects.
A dedicated inter-calibration study between optical, UV and X-ray datasets was carried out, adopting the parameter for the hydrogen column (obtained from the LAB survey). The results were reddening corrected using mag (Schlegel et al., 1998). Then, the corresponding optical/UV galactic extinction coefficients were computed () and applied (Fitzpatrick, 1999). The host galaxy contribution of B2 1215+30 was estimated using the PEGASE-HR code (Le Borgne et al., 2004) extended for the ultraviolet UVOT filters and by using the R-band photometric results of Nilsson et al. (2007). No zodiacal light correction was introduced. For each filter, the integrated flux was computed by using the related effective frequency and not convolving the filter transmission with the source spectrum. This may produce a moderate overestimation (around %) of the integrated flux. The total upper limit systematic uncertainty is 15%.
In the optical regime, we monitored B2 1215+30 using the Super-LOTIS (Livermore Optical Transient Imaging System) robotic telescope over the period December 2010 March 2012. In addition to these R-band observations, B2 1215+30 was observed with the 1.3 m McGraw-Hill telescope of the MDM observatory, located at Kitt Peak, Arizona, during one week in May 2011 (MJD ), using standard V, R, and I filters. The data were bias-subtracted and flat-fielded using the routines of the Image Reduction and Analysis Facitily (IRAF; Tody, 1993, 1986). Comparative photometry with stars of known magnitude was performed and the resulting light curve is shown in Figure 3 showing clear variability contemporanous with the VERITAS measurements. This is in line with the variability seen on the publicly available light curves from the Tuorla Observatory555 http://users.utu.fi/kani/1m/ON_325.html.
For the construction of the optical SED using MDM observations, the magnitudes were corrected for Galactic extinction according to Schlegel et al. (1998). The values are AV = 0.079, AR = 0.064, and AI = 0.046, as provided by the NED.
6 Spectral energy distribution and modeling
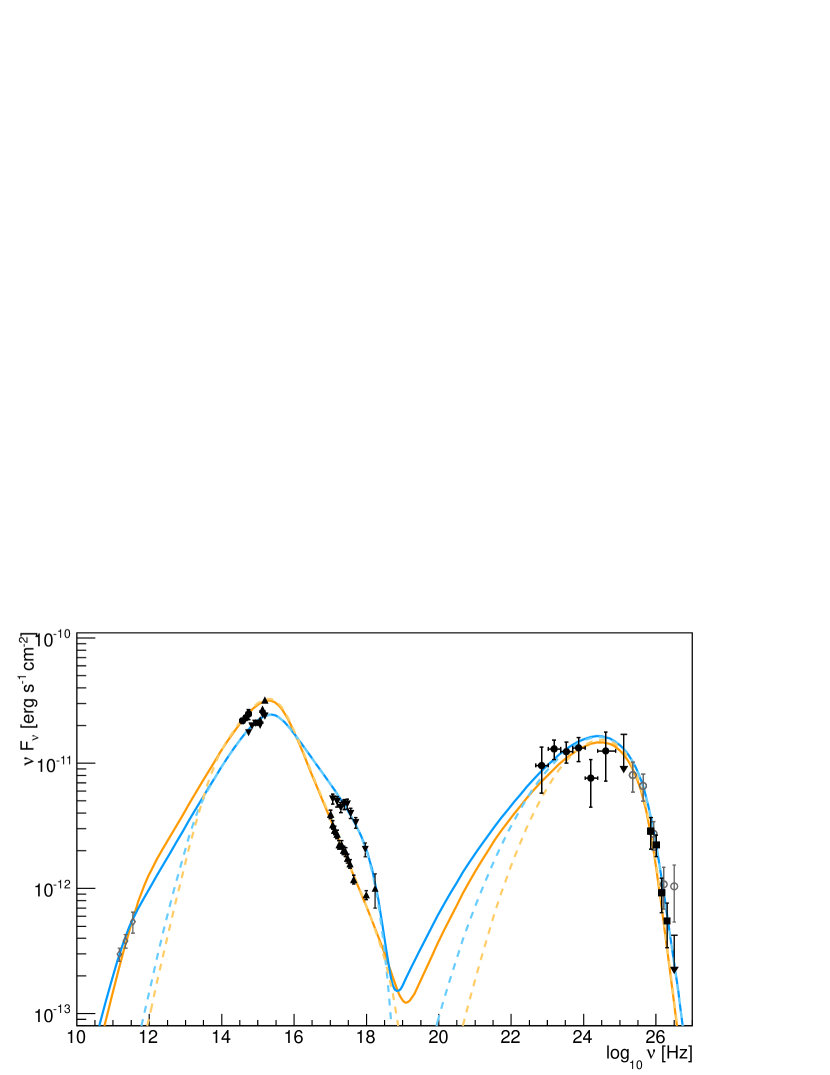
An SED was constructed using the multi-wavelength data obtained in 2011. During this time, no variability was detected in the high- or very-high-energy regimes. Given the low statistics in those energy regimes, the Fermi-LAT data contemporaneous with the VERITAS observations in 2011 are used (MJD ). Variability is clearly seen in X-rays and, therefore, two spectra are extracted: one to represent the high X-ray state in January (MJD 55565) and the other one to represent the low X-ray state observed in April/May (using the combined spectrum from all observations between MJD ). Swift-UVOT data simultaneous with the X-ray observations were used when available. Given the relatively large systematic uncertainty of the UVOT analysis, the quasi-simultaneous optical spectrum from MDM (MJD ) is additionally used in the SED representing the low X-ray state. To complete the low energy part of the SED, archival data in the micrometer wavelength regime, taken from Antón et al. (2004), are included. Unfortunately, no information on the variability at those wavelengths is found, but since blazars are usually variable at all wavelengths, the inclusion of these archival data in the modeling will be discussed later.
The extracted broadband SED, in the representation, can be found in Figure 5. It shows a two-bump structure typical for blazars. Based on the location of the synchrotron peak between UV and X-rays, the source classification as an IBL according to Nieppola et al. (2006), or as an HSP according to Ackermann et al. (2011), can be confirmed. However, this classification might only be true for the observations in 2011 reported here, as it is known that some blazars undergo spectral changes during flares which could change their SED classification, e.g. VER J0521+211 (Archambault et al., 2013).
The SED is modeled with the synchrotron self-Compton (SSC) model by Böttcher & Chiang (2002), which assumes that the plasma jet is powered by accretion of material onto a super-massive black hole (for details see Acciari et al., 2009c). The emission zone is modeled as a spherical volume of radius moving with relativistic speed along the jet axis. The jet is directed at a small angle with respect to the line of sight to the observer. Since the observing angle is very hard to measure, it is fixed within the model to the superluminal angle, , for which the (bulk) Lorentz factor equals the Doppler factor . The results of the model depend mainly on the Doppler factor, hence other combinations of and resulting in the same Doppler factor are also possible.
Into the emission region, a population of ultra-relativistic non-thermal electrons is injected following a power-law distribution with low- and high-energy cutoffs and , respectively, so that for . The normalization of the electron distribution is related to the magnetic field through a relative partition parameter , defined as . is the kinetic power in the relativistic electrons and is the power in the Poynting flux carried by the magnetic field. The magnetic field itself is a free parameter within the model.
As the emission region is propagating along the jet, the continuously injected particles lose energy through synchrotron and SSC radiation and may escape from the emitting region. The particle escape is described by an escape timescale parameter with . As a result of the assumed quasi-equilibrium between particle injection, escape and radiative cooling, a break in the electron distribution will occur self-consistently at a Lorentz factor , where . Depending on whether is larger or less than , the system will be in the slow or fast cooling regime. In the fast cooling regime (), the equilibrium electron distribution will be a broken power law with for and for . In the slow cooling regime (), the broken power law is of the form for and for .
Altogether, the SSC model described here has eight free parameters, listed in Table Long term observations of B2 1215+30 with VERITAS. Several of these parameters can be estimated from observables like the spectra obtained from multi-wavelength (MWL) observations as well as the measured variability time scales (see, e.g., Tavecchio et al., 1998). The absorption of VHE gamma rays on the extragalactic background light (EBL) is accounted for in the predicted fluxes using the EBL model of Finke et al. (2010)666This absorption is consistent with the absorption level derived from EBL models of Franceschini et al. (2008) and Gilmore et al. (2009).. Here, a redshift of is used for the modeling; we will discuss later how the results are affected if a redshift of is adopted instead.
In Figure 5 the results of the SSC model are shown. It can be seen that the overall SED for both X-ray states in 2011 can be well described by the model. The solid lines represent the model for which the archival data in the micrometer waveband are taken into account. At those frequencies of around Hz, a spectral break occurs due to the transition from fast cooling to the slow cooling regime. The position of this break is determined by the escape time scale, resulting in a large value for . The Doppler factor is relatively large, with . Using a lower Doppler factor would require a larger emission region and hence a lower magnetic field strength, resulting in variability time scales longer than days (following causality arguments). This lower Doppler factor scenario would contradict the measurements of X-ray variability during the January observations. The magnetic field strength is found to be quite low, resulting in a very small relative partition parameter. A magnetic field far below equipartition (), as found here, might indicate a particle-dominated jet, in which the magnetic field in the emission region is self-generated and/or amplified in shocks. In contrast, a magnetic field near or above equipartition would be consistent with a Poynting-flux-dominated jet in which magnetic field energy is transferred to particles, reaching approximate equipartition in the high-energy emission zone.
In order to account for the two different X-ray states observed in 2011, the electron injection spectral index together with the magnetic field strength within the modeled emission region were changed. The injection index during the high X-ray state in January () is found to be harder than during the low X-ray state in April/May (). Under the assumption that the particles in the jet are accelerated within relativistic shocks, the spectral change in the electron distribution may be explained by a change in the shock field obliquity: a larger angle between magnetic field and shock front results in a harder particle spectrum (see, e.g., Sironi & Spitkovsky, 2009). This change of the injection spectrum also leads to flux variations in the high-energy peak. However, neither Fermi-LAT nor VERITAS are sensitive to those variations given the flux level of the source during the observation period reported here.
All of the above results are obtained by taking the archival data at around Hz into account. However, due to possible variability in this waveband, we also modeled the SED of the source ignoring those archival data. The resulting model spectrum is represented by the dashed lines in Figure 5 and represents the SED well. The only changes made to the model parameters were to reduce the value of the escape time parameter and the injection power. It was found that a value up to ten times smaller for could be used to model the SED. This means that the escape time scale may be shorter and the cooling break would occur at higher energies compared to the model including the archival data. Additionally, the system is closer to equipartition, since the injection power for the electron distribution is lower (with the same value for the magnetic field strength). Due to the lack of simultaneous data in the Hz domain, and are unconstrained, resulting in a range of parameter combinations that describe the observed SED well. It is worth noting that in this, and most other one-zone leptonic models, the synchrotron emission from the gamma-ray emission region is self-absorbed at millimeter and longer wavelengths. Therefore, these models are often unable to account for the radio emission, which is generally thought to be due to the superposition of self-absorbed synchrotron components produced further out along the jet (Marscher & Gear, 1985), and is treated in one-zone emission models as upper limit.
Another difficulty of the model and its possible interpretation is the uncertainty in the redshift. We applied the same model to the SED using . We found that both X-ray states can well be modeled by a change of the electron injection spectral index together with the magnetic field strength. In this case, the Doppler factor needs to be larger () to compensate for the EBL absorption at high energies and the model-predicted fluxes are found to be slightly below the VERITAS spectral points. Nevertheless, this is still compatible with the VERITAS measurement considering systematic errors, therefore, this redshift cannot be excluded.
7 Discussion
As previously mentioned, B2 1215+30 was observed by MAGIC early in 2011. Aleksić et al. (2012) presented the source as an “exceptional VHE -ray emitting BL Lac”, mainly based on its SED and the results obtained from the MWL modeling. Here, the results of the modeling presented in Section 6 are compared to those in the MAGIC publication and then put into perspective with results obtained from other blazars detected by VERITAS.
MAGIC observed B2 1215+30 for approximately 20 hours between January and February 2011 and their spectral points are shown in Figure 5, compatible with the VERITAS measurements. Quasi-simultaneous MWL data, also compatible with those obtained here, were used to construct the SED and were modeled by the SSC model of Maraschi & Tavecchio (2003) using the redshift of . In the paper, Aleksić et al. (2012) represent the data with SSC model parameters which are compatible with those obtained here. They also found that the same SSC model can well reproduce the data with a higher Doppler factor () or a higher minimum Lorentz factor of the electron distribution (). Using these values for the model parameters, we did not succeed in fully representing the SED. The main reason is that the modeled high-energy peak is not broad enough to represent the low-energy points of the Fermi-LAT spectrum. However, this part of the spectrum was not used in the MAGIC publication.
To address the question whether B2 1215+30 is extreme in terms of its SED and model parameters, the results of our modeling are compared to those obtained on all the VERITAS-detected blazars which have contemporaneous MWL data and are modeled with the SSC model by Böttcher & Chiang (2002). In total, 6 HBLs and 3 IBLs are found; the model parameters are listed in Table Long term observations of B2 1215+30 with VERITAS. Three of those blazars 1ES 0806+524 (Acciari et al., 2009a), Mrk 421 (Acciari et al., 2009b), and W Comae (Acciari et al., 2008a, 2009c) were found in different flux states during the MWL observations and have more than one set of model parameters. PKS 1424+240 (Acciari et al., 2010a) and 3C 66A (Abdo et al., 2011) have been modeled using different redshift assumptions. While PKS 1424+240 will not be included in the comparison study due to the current lack of redshift constraint, two redshift values are given in Table Long term observations of B2 1215+30 with VERITAS for 3C 66A, i.e. and , as they enclose the recently published redshift limits which were found to be in the range of (Furniss et al., 2013).
As one can see in Table Long term observations of B2 1215+30 with VERITAS, most of the parameters used to model the SED of B2 1215+30 are well within the range of those used for previously detected blazars. The Doppler factor, for example, is usually found to be in the range of for the applied model. This is in agreement with other SSC models, e.g. Tavecchio et al. (2010). However, there are two parameters which are outside this “standard range”: the magnetic field strength and the escape time parameter . The first one is relatively low for B2 1215+30 and results in a very low relative partition parameter. For some of the other blazars, e.g. W Comae and 3C 66A, this behavior has also been seen. In those cases, an SSC model with an external radiation field resulted in model parameters with larger magnetic field strengths and closer to equipartition. However, in the case of B2 1215+30 no improvement could be found by adding an EC component to the model - neither in the representation of the shape of the SED nor by bringing the system closer to equipartition. In general, the magnetic field strength values obtained for the different sources are consistent with results from other leptonic blazar models. The second parameter, , is high compared to the model parameters of the other blazars. Such a high value for implies long escape time scales. This could hint at a relatively well ordered (laminar) magnetic field in the emission region. However, it has already been shown in the previous section that the value for can be lowered significantly when taking only the contemporaneous data into account, without losing the ability to reproduce the shape of the SED. This value is then closer to values applied to the other VERITAS-modeled blazars. In summary, the model parameters derived here for the applied SSC model are in the range of those derived from previous VERITAS blazar modeling. In this sense B2 1215+30 is a typical VHE-detected blazar.
8 Summary and Conclusion
We have presented long term observations of BL Lac B2 1215+30 at VHE energies with VERITAS between December 2008 and May 2012. During these observations, the source was clearly detected and showed clear variability on time scales longer than months, while variability on shorter time scales could not be detected. In 2011, the source was found to be in a bright state and a spectral analysis could be performed. The results are compatible with the MAGIC results from early 2011 reported in Aleksić et al. (2012).
MWL data, quasi-simultaneous with the VERITAS observations in 2011, were used to construct the SED of B2 1215+30 and confirmed its classification as an IBL. During these VERITAS observations, B2 1215+30 showed different flux states in the X-ray regime. These could be successfully reproduced with an SSC model by changing the spectral index of the injected electron distribution together with the magnetic field strength. Our study finds a model description for the SED of B2 1215+30 similar to other TeV-detected blazars.
Observations of B2 1215+30 by VERITAS will continue as part of a monitoring program on 1ES 1218+304, a TeV blazar in the same field of view. This will allow a search for variability on different time scales and could result in tighter constraints for the input model parameters, as dedicated observations of B2 1215+30 can be triggered in case of an increased flux state.
References
- Abdo et al. (2009) Abdo, A. A., Ackermann, M., Ajello, M., et al., 2009, ApJS, 183, 46
- Abdo et al. (2011) Abdo, A. A., Ackermann, M., Ajello, M., et al., 2011, ApJ, 726, 43
- Acciari et al. (2009a) Acciari, V. A., Aliu, E., Arlen, T., et al., 2009a, ApJ, 690, L126
- Acciari et al. (2010a) Acciari, V. A., Aliu, E., Arlen, T., et al., 2010a, ApJ, 708, L100
- Acciari et al. (2010b) Acciari, V. A., Aliu, E., Arlen, T., et al., 2010b, ApJ, 715, L49
- Acciari et al. (2009c) Acciari, V. A., Aliu, E., Aune, T., et al., 2009c, ApJ, 707, 612
- Acciari et al. (2009b) Acciari, V. A., Aliu, E., Aune, T., et al., 2009b, ApJ, 703, 169
- Acciari et al. (2008a) Acciari, V. A., Aliu, E., Beilicke, M., et al., 2008a, ApJ, 684, L73
- Acciari et al. (2008b) Acciari, V. A., Beilicke, M., Blaylock, G., et al., 2008b, ApJ, 679, 1427
- Ackermann et al. (2011) Ackermann, M., Ajello, M., Allafort, A., et al., 2011, ApJ, 743, 171
- Aharonian et al. (2007) Aharonian, F., Akhperjanian, A. G., Bazer-Bachi, A. R., et al., 2007, ApJ, 664, L71
- Akiyama et al. (2003) Akiyama, M., Ueda, Y., Ohta, K., Takahashi, T., & Yamada, T., 2003, ApJS, 148, 275
- Aleksić et al. (2012) Aleksić, J., Alvarez, E. A., Antonelli, L. A., et al., 2012, A&A, 544, A142
- Aleksić et al. (2011) Aleksić, J., Antonelli, L. A., Antoranz, P., et al., 2011, ApJ, 730, L8
- Aliu et al. (2012a) Aliu, E., Archambault, S., Arlen, T., et al., 2012a, ApJ, 750, 94
- Aliu et al. (2012b) Aliu, E., Archambault, S., Arlen, T., et al., 2012b, ApJ, 755, 118
- Aliu et al. (2013) Aliu, E., Archambault, S., Arlen, T., et al., 2013, ApJ, 775, 3
- Aliu et al. (2011) Aliu, E., Aune, T., Beilicke, M., et al., 2011, ApJ, 742, 127
- Antón et al. (2004) Antón, S., Browne, I. W. A., Marcha, M. J. M., Bondi, M. & Polatidis, A., 2004, MNRAS, 352, 673
- Archambault et al. (2013) Archambault, S., Arlen, T., Beilicke, M., et al., 2013, ApJ, 776, 69 (2013).
- Arlen et al. (2013) Arlen, T., Aune, T., Beilicke, M., et al., 2013, ApJ, 762, 92
- Atwood et al. (2009) Atwood, W. B., Abdo, A. A., Ackermann, M., et al., 2009, ApJ, 697, 1071
- Benbow et al. (2011) Benbow, W. et al., 2011, in Proc 32nd ICRC, Beijing, arXiv:1110.0038
- Berge et al. (2007) Berge, D., Funk, S. & Hinton, J., 2007, A&A, 466, 1219
- Böttcher (2012) Böttcher, M., 2012, arXiv:1205.0539
- Böttcher & Chiang (2002) Böttcher, M. & Chiang, J., 2002, ApJ, 581, 127
- Breeveld et al. (2010) Breeveld, A. A., Curran, P. A., Hoversten, E. A., et al., 2012, MNRAS, 406, 1687
- Browne (1971) Browne, I. W. A., 1971, Nature, 231, 515
- Burrows et al. (2005) Burrows, D. N., Hill, J. E., Nousek, J. A., et al.., 2005, Space Sci. Rev., 120, 165
- Colla et al. (1970) Colla, G., Fanti, C., Ficarra, A., et al., 1970, A&AS, 1, 281
- Costamante & Ghisellini (2002) Costamante, L. & Ghisellini, G., 2002, A&A, 384, 56
- Finke et al. (2010) Finke, J. D., Razzaque, S. & Dermer, C. D., 2012, ApJ, 712, 238
- Fitzpatrick (1999) Fitzpatrick, E. L., 1999, PASP, 111, 63
- Franceschini et al. (2008) Franceschini, A., Rodighiero, G. & Vaccari, M., 2008, A&A, 487, 837
- Furniss et al. (2013) Furniss, A., Fumagalli, M., Danforth, C., Williams, D. A., & Prochaska, J. X., 2013, ApJ, 766, 35
- Gilmore et al. (2009) Gilmore, R. C., Madau, P., Primack, J. R., Somerville, R. S., & Haardt, F., 2009, MNRAS, 399, 1694
- Helene (1983) Helene, O., 1983, Nuclear Instruments & Methods 212, 319
- Hillas (1985) Hillas, A. M., 1985, in Proc 19th ICRC, La Jolla, IL, 3, 445
- Hillas et al. (1998) Hillas, A. M., Akerlof, C. W., Biller, S. D., et al., 1998, ApJ, 503, 744
- Holder et al. (2011) Holder, J., Aliu, E., Arlen, T., et al., 2011, in Proc 32nd ICRC, Beijing, arXiv:1111.1225v1
- Kalberla et al. (2005) Kalberla, P. M. W., Burton, W. B., Hartmann, D., et al., 2005, VizieR Online Data Catalog 8076
- Lanzetta et al. (1993) Lanzetta, K. M., Turnshek, D. A. & Sandoval, J., 1993, ApJS, 84, 109
- Le Borgne et al. (2004) Le Borgne, D., Rocca-Volmerange, B., Prugniel, P., et al., 2004, A&A, 425, 881
- Li & Ma (1983) Li, T.-P. & Ma, Y.-Q., 1983, ApJ, 272, 317
- Ma et al. (1998) Ma, C., Arias, E. F., Eubanks, T. M., et al., 1998, AJ, 116, 516
- Maraschi & Tavecchio (2003) Maraschi, L. & Tavecchio, F., 2003, ApJ, 593, 667
- Mariotti et al. (2011) Mariotti, M. et al., 2011, The Astronomer’s Telegram 3100, 1
- Marscher & Gear (1985) Marscher, A. P. & Gear, W. K., 1985, ApJ, 298, 114
- Nieppola et al. (2006) Nieppola, E., Tornikoski, M. & Valtaoja, E., 2006, A&A, 445, 441
- Nilsson et al. (2007) Nilsson, K., Pasanen, M., Takalo, L. O., et al., 2007, A&A, 475, 199
- Nolan et al. (2012) Nolan, P. L., Abdo, A. A., Ackermann, M., et al., 2012, ApJS, 199, 31
- Poole et al. (2008) Poole, T. S., Breeveld, A. A., Page, M. J., et al., 2008, MNRAS, 383, 627
- Roming et al. (2005) Roming, P. W. A., Kennedy, T. E., Mason, K. O., et al., 2005, Space Sci. Rev., 120, 95
- Schlegel et al. (1998) Schlegel, D. J., Finkbeiner, D. P. & Davis, M., 1998, ApJ, 500, 525
- Sironi & Spitkovsky (2009) Sironi, L. & Spitkovsky, A., 2009, ApJ, 698, 1523
- Tavecchio et al. (2010) Tavecchio, F., Ghisellini, G., Ghirlanda, G., Foschini, L., & Maraschi, L., 2010, MNRAS, 401, 1570
- Tavecchio et al. (1998) Tavecchio, F., Maraschi, L. & Ghisellini, G., 1998, ApJ, 509, 608
- Tody (1986) Tody, D., 1986, in SPIE Conference Series 627, 733
- Tody (1993) Tody, D., 1993, in Astronomical Society of the Pacific Conference Series 52, 173
| Data set | Exposure | Zenith | NON | NOFF | Sig | ||
|---|---|---|---|---|---|---|---|
| [hours] | [deg] | [] | [] | ||||
| 2008/09 | 29 | 20 | 304 | 2288 | 0.1243 | 1.1 | |
| 2011 | 38 | 15 | 472 | 2325 | 0.1161 | 10.4 | |
| 2012 | 15 | 12 | 143 | 898 | 0.1177 | 3.2 | |
| TOTAL | 82 | 16 | 919 | 5511 | 0.1197 | 8.9 |
Note. — The exposure time in hours is given in effective time on B2 1215+30 (in 0.5° wobble offset equivalent). Zenith refers to the mean zenith angle of the observations. NON and NOFF are the number of events in the ON and OFF region, while is the acceptance-corrected area ratio of both regions. Sig is the significance of the detection of B2 1215+30. The flux (or 99% upper limit) above 200 GeV is calculated with statistical error bars using the spectral index derived in 2011.
| Source | ref | |||||||||||
|---|---|---|---|---|---|---|---|---|---|---|---|---|
| [ erg/s] | [] | [] | [G] | [ cm] | [hr] | |||||||
| B2 1215+30 (H) | 0.13**footnotemark: | 5.0aaAlternative parameters without archival data are , , and . | 30 | 8 | 2.8 | 0.02 | 5 | 30 | 3300aaAlternative parameters without archival data are , , and . | 0.00678aaAlternative parameters without archival data are , , and . | 17.4 | |
| B2 1215+30 (L) | 0.13**footnotemark: | 6.5bbAlternative parameters without archival data are , , and . | 45 | 20 | 3.4 | 0.01 | 13 | 30 | 2500bbAlternative parameters without archival data are , , and . | 0.00874bbAlternative parameters without archival data are , , and . | 45.3 | |
| RBS 0413 | 0.19 | 0.297 | 70 | 10 | 2.4 | 0.1 | 1.1 | 20 | 10 | 0.06 | 6.06 | 1 |
| 1ES 0414+009 | 0.287 | 3.07 | 200 | 50 | 3.5 | 0.008 | 21 | 40 | 120 | 0.055 | 62.5 | 2 |
| RX J0648+1516 | 0.179 | 0.75 | 67 | 10 | 4.8 | 0.14 | 2 | 20 | 100 | 0.16 | 10.9 | 3 |
| RGB 0710+591 | 0.125 | 0.449 | 60 | 20 | 1.5 | 0.036 | 2 | 30 | 100 | 0.039 | 6.9 | 4 |
| 1ES 0806+524 | 0.138 | 0.19 | 17.7 | 2 | 3.1 | 0.39 | 0.5 | 20 | 3 | 0.31 | 2.6 | 5 |
| 1ES 0806+524 | 0.138 | 0.14 | 16 | 2 | 2.7 | 0.5 | 0.5 | 20 | 3 | 0.68 | 2.6 | 5 |
| Mrk 421 | 0.031 | 0.0776 | 42 | 5 | 2.6 | 0.48 | 0.3 | 20 | 3 | 0.4 | 1.4 | 6 |
| Mrk 421 | 0.031 | 0.106 | 33 | 4 | 3.2 | 0.68 | 0.3 | 20 | 3 | 0.59 | 1.4 | 6 |
| W Comae | 0.102 | 28 | 0.45 | 4.5 | 2.2 | 0.007 | 10 | 30 | 200 | 0.00059 | 31.2 | 7 |
| W Comae | 0.102 | 3.4 | 9 | 2.5 | 2.55 | 0.24 | 0.3 | 20 | 300 | 0.0023 | 1.5 | 8 |
| 3C 66A | 0.3**footnotemark: | 57 | 22 | 4 | 3 | 0.02 | 7 | 40 | 1000 | 0.0015 | 21.1 | 9 |
| 3C 66A | 0.444**footnotemark: | 128 | 25 | 5 | 3 | 0.01 | 11 | 50 | 1000 | 0.0011 | 29.4 | 9 |
Note. — The columns are the following: is the redshift (* denotes the assumed redshift within the model, see text for more details); is the jet luminosity; is the low energy cutoff energy of the electron distribution; is the high energy cutoff; is the spectral index of the electron injection spectrum; is the magnetic field strength; is the emission region radius; is the Doppler factor; and is the escape time parameter. Additionally, two output parameters are given: is the resulting relative partition parameter ; and is the resulting minimum variability time scale.