Manipulating femtosecond magnetism through pressure:
First-principles calculation
Abstract
Inspired by a recent pressure experiment in fcc Ni, we propose a simple method to use pressure to investigate the laser-induced femtosecond magnetism. Since the pressure effect on the electronic and magnetic properties can be well controlled experimentally, this leaves little room for ambiguity when compared with theory. Here we report our theoretical pressure results in fcc Ni: Pressure first suppresses the spin moment reduction, and then completely diminishes it; further increase in pressure to 40 GPa induces a demagnetization-to-magnetization transition. To reveal its microscopic origin, we slide through the L-U line in the Brillouin zone and find two essential transitions are responsible for this change, where the pressure lowers two valence bands, resulting in an off-resonant excitation and thus a smaller spin moment reduction. In the spin-richest L-W-W′ plane, two spin contours are formed; as pressure increases, the contour size retrieves and its intensity is reduced to zero eventually, fully consistent with the spin-dipole factor prediction. These striking features are detectable in time- and spin-resolved photoemission experiments.
pacs:
75.40.Gb, 78.20.Ls, 75.70.-i, 78.47.J-I I. Introduction
Laser-induced femtosecond (de)magnetism dynamics opens a new frontier in magnetism, femtomagnetism beaurepaire . Interest in femtomagnetism has grown substantially aes ; comin ; vap ; kir ; koo ; kam ; ourreview ; sijpcm due to its fundamental importance and practical applications pickel ; stanciu ; bigotnature ; mathias . However, its underlying mechanism is quite different from those driven by magnetic or thermal fields, because the electric field of a laser directly interacts with charges of a sample, but only indirectly with the spin. A systematic and well controlled approach is a must. It was a recent pressure experiment that caught our attention. Torchia et al. torchio carried out a pressure-dependent x-ray magnetic circular dichroism (XMCD) measurement in fcc Ni. They showed that the ferro- versus para-magnetic phase transition does not occur at 160 GPa as predicted theoretically, and suggested the disappearance of ferromagnetic phase at 400 GPa pressnote . Although this experiment has nothing to do with femtomagnetism, it suggests a possibility to manipulate the ultrafast magnetization through pressure. First, the experiment showed that Ni retains its pristine fcc structure under pressure. This presents a clean case, free of the symmetry-broken effects, where a direct comparison between experiment and theory is possible. Second, XMCD has already been developed into a time-resolved technique on the femtosecond time scale stamm . Theoretical predictions can be tested experimentally. Up to now, neither experimental nor theoretical investigation has ever been carried out in laser-induced femtomagnetism in any materials under pressure. We believe that a theoretical study is timely and appropriate.
In this work, we aim to demonstrate that the pressure is a promising tool to investigate the laser-induced ultrafast spin dynamics. Our first-principles calculation shows that pressure introduces a clean and dramatic change in (de)magnetization. In fcc Ni, it first decreases the spin moment reduction, and then erases it entirely. If the pressure is increased further to 40 GPa, it induces a demagnetization-magnetization transition, a finding that has never been reported in metals. To reveal its microscopic origin, we examine the L-U line in the Brillouin zone (BZ) and find that two transitions are responsible for these dramatic changes. These two transitions are from two valence bands, each of which is 2 eV below the Fermi level, to a conduction band, which is just above the Fermi level. When the pressure increases, the valence bands are downshifted with respect to the conduction band, leading to an off-resonant transition and a smaller spin moment change. The largest spin moment change resides in the L-W-W′ plane, where the spin moment contour starts with two strong concentric arcs at 0 GPa; as pressure increases, it loses its intensity, in agreement with the spin-dipole factor prediction. We emphasize that all the transitions are gradual, without a sudden crystal symmetry changes, thus it is particularly suitable for the experimental investigation. This paper is organized as follows. Section II is devoted to the theoretical formalism. In Sec. III, we discuss the obtained results. Finally, we conclude this paper in Sec. IV.
II II. Theoretical formalism
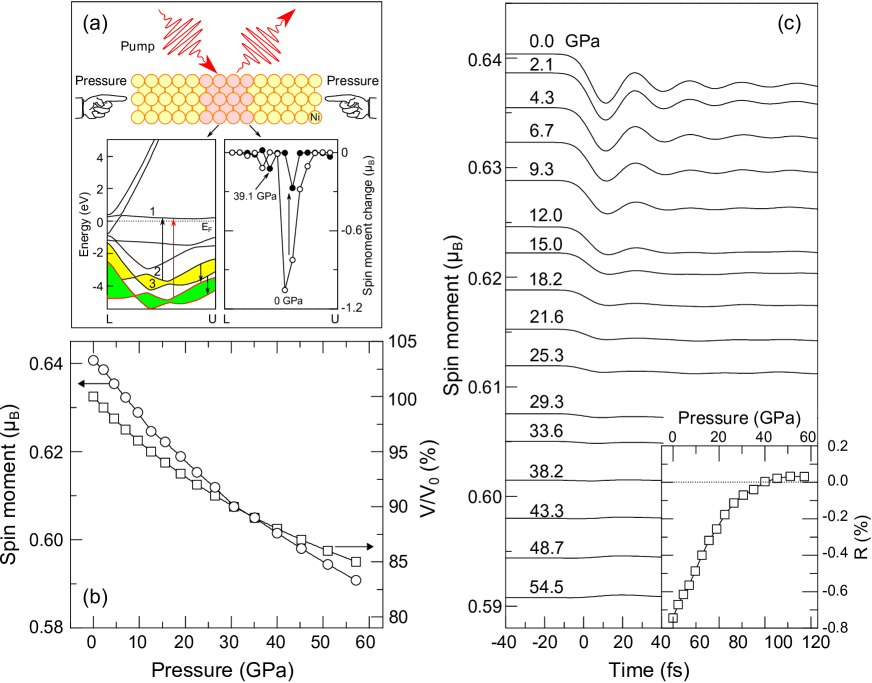
Pressure is a powerful tool to manipulate material properties ols ; loa . It can induce the superconductivity in cerium wittig , bcc barium pro , joynt ; Chan , antiferromagnetism in invar invar , and magnetic phase changes in PrSb vet , SrFeO3 and BaFeO3 li ; boh , and Nd0.53Sr0.47MnO3 bal . Pressure has been used to control ultrafast dynamics before. Employing a 60 fs/620 nm laser pulse, Lienau et al. lienau found that in the compressed supercritical argon, the femtosecond transients of iodine undergo a big change with argon pressures. Very recently Liu et al. liu showed that the lifetime of the S-1 state in beta-carotene increases with pressure. Kasami et al. kasami found that in bismuth the high pressure suppresses the amplitude of coherent phonons and changes their frequencies. They assigned this to the disappearance of the band-structure overlapping at L- and T-points. In metal nanoparticles christofilos , the vibration frequency increases with pressure. It is certainly of great interest to see whether the pressure could introduce similar dramatic effects in femtomagnetism. It is well known that high pressure generated by the so-called diamond anvil cell technique is very challenge in experiments. Here we instead suggest an alternative method, that is epitaxy-induced lattice change, to mimic this effect. If there is a misfit between a substrate and a growing epilayer, the first atomic layers which are deposited will be strained to match the substrate people . As a result, the corresponding lattice constant will be enlarged or reduced which depends on the substrate used. Such a substrate-induced lattice change can be regarded as an equivalent means to mimic the effect of pressure. Importantly, the measurement of femtosecond laser induced magnetization can be carried out on those epitaxial thin films. Figure 1(a) shows a schematic of our proposed pressure experiment, the band dispersion and spin moment change along the L-U direction (see below for more).
Our theoretical calculation is based on the density functional theory and employs the full potential augmented planewave method as implemented in the WIEN2k code wien . To accurately take into account the diffusive nature of the Kohn-Sham excited states, we choose a large product of the Muffin-tin radius and the planewave cutoff of 9.5. Additional linearization energies are added to represent those high lying states where the laser accesses. Spin-orbit coupling is included. Spin matrices are constructed by ourselves prb09 . Both our spin moment and band structure agree with the prior experimental and theoretical results vw . There are several similarities and differences between the work by Vernes and Weinberger and ours. They include both the current-current correlation, which is similar to our single pulse excitation, and three-current correlation, which gives the additional dissipation. They linearized their equation of motion with respect to the probe pulse, while we directly solve the Liouville equation numerically. Whereas the electron correlation effect is important to the spin moment change, as a first step, in this paper we focus on the pressure effect on magnetization within the single particle picture. In addition, we also ignore the lattice effect as several theoretical studies show its effect is small lefkidis ; carva ; kraub at least in the early stage at laser excitation.
III III. Results and Discussion
Before we carry out dynamical simulations, we first verify the pressure dependence of the volume (see the boxes in Fig. 1(b)). Our interest is in the spin moment change with pressure. Figure 1(b) (the circles) shows that as pressure increases, the magnetic moment decreases monotonically from 0.64 at 0 GPa to 0.59 at 54.5 GPa, in good agreement with the results by Torchio et al. torchio . Upon ultrafast laser excitation, the spin moment undergoes a dramatic change. Beaurepaire et al. beaurepaire showed that their time-resolved magneto-optical Kerr signal in fcc Ni dropped precipitously within 1 ps. Subsequent experiments soon verified their findings. However, to simulate such a fast process is no easy task naturephysics2009 ; prl00 ; prb09 , because it involves a real time evolution with a huge number of points. To solve this problem, we employ the Liouville equation for the density matrix at each naturephysics2009 ,
| (1) |
where is the system Hamiltonian, and is the interaction between the laser and the system, i.e., . Here is the dipole operator, and () is the electron creation (annihilation) operator for band at . The laser field is , where is the laser polarization direction, is the field amplitude, is the laser frequency, is the time and is the laser pulse duration. This is a coupled equation involving transitions between all the band states and is solved numerically using massively parallel computers. Once we obtain the density matrix, the time-dependent spin moment can be computed by tracing over the product of the density and spin matrices.
We choose the photon energy of 2 eV, the laser pulse duration of 12 fs and the field amplitude of 0.05 V/Å. Figure 1(c) shows the spin moment change as a function of time at sixteen pressures from 0 GPa through 54.5 GPa. A few striking features are noticeable. First, the amount of demagnetization is reduced with pressure. For the time-resolved magneto-optical Kerr experiment, this means that the Kerr signal will drop with pressure. For instance, at 0 GPa, the spin change is -0.0048 , while at 23 GPa, it is -0.0011 . Second, as pressure increases, the strong oscillation in the spin moment is greatly reduced. The period of this spin oscillation is determined by the spin-orbit coupling jap08 . Once the pressure is above 18 GPa, the oscillation nearly diminishes. This theoretical result can be tested experimentally. Thirdly, and surprisingly, when the pressure increases further, there is a demagnetization-to-magnetization transition at 40 GPa, where the system is now magnetized, instead demagnetized. Such a magnetization enhancement has been observed in ferromagnetic semiconductors chemlaprl0405 ; fliu and metallic multilayers rud , but has never been reported in ferromagnetic metals. To quantify these changes, we introduce the percentage change as
| (2) |
where is the spin moment extreme (maximum or minimum) and is the initial magnetic moment prior to the femtosecond laser pulse. A positive or negative corresponds to the magnetization or demagnetization, respectively. The inset of Fig. 1(c) shows that as pressure increases, drops from 0.74% to zero, and changes its sign around 40 GPa, before it finally saturates at 0.03% note . We note that at ambient pressure and for the same realistic electric field, the amount of demagnetization is much smaller than that observed in experiments. This might be due to the neglect of electron-electron interaction and the system difference, where our system is bulk fcc Ni, but most experimental systems are thin films. On the picosecond or longer timescale, this may become necessary to include the electron-phonon interaction.
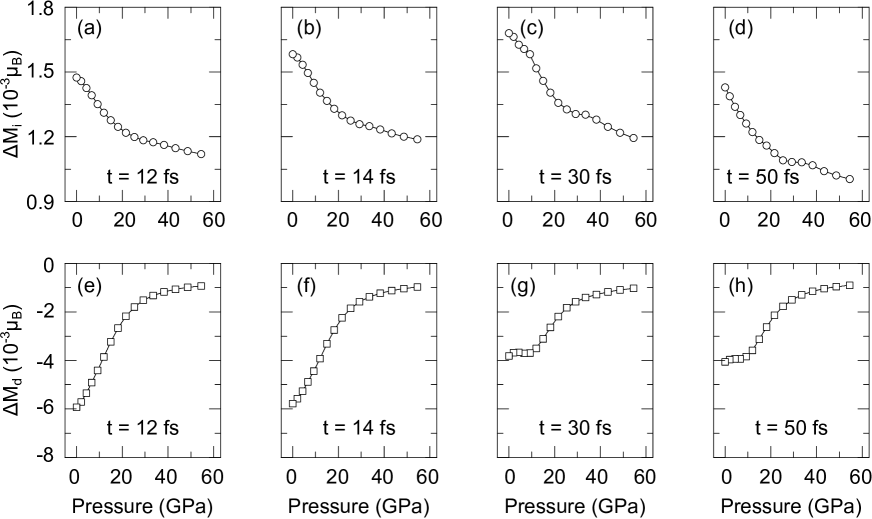
To understand how the pressure induces such a dramatic change, we first separate all the points into two groups: One with the spin moment increased () and the other with the spin moment decreased (). Then we plot and as a function of pressure at four selected times, 12, 14, 30 and 50 fs, where the extremes appear. Since the net magnetization change is simply a sum of these two, it is useful to examine how each changes with pressure. Figures 2(a)-(d) represent the magnetization increase, while Figs. 2(e)-(h) the magnetization decrease. A common feature emerges: Independent of the times selected, both and decrease with pressure. However, the amount of the reduction is different. The net change in is about , whereas the change in is about , more than ten times larger than . That is why at pressures below 40 GPa, the entire spin moment change follows the trend set by . Once above 40 GPa, is reduced so much that it can not compete with ; consequently, completely dominates the spin moment change. If , we have zero spin moment change. On the other hand, if , the system becomes magnetized, instead demagnetized. This is the origin of the pressure-dependent spin moment change. To pin down its microscopic picture, we focus on a few critical lines in the Brillouin zone.
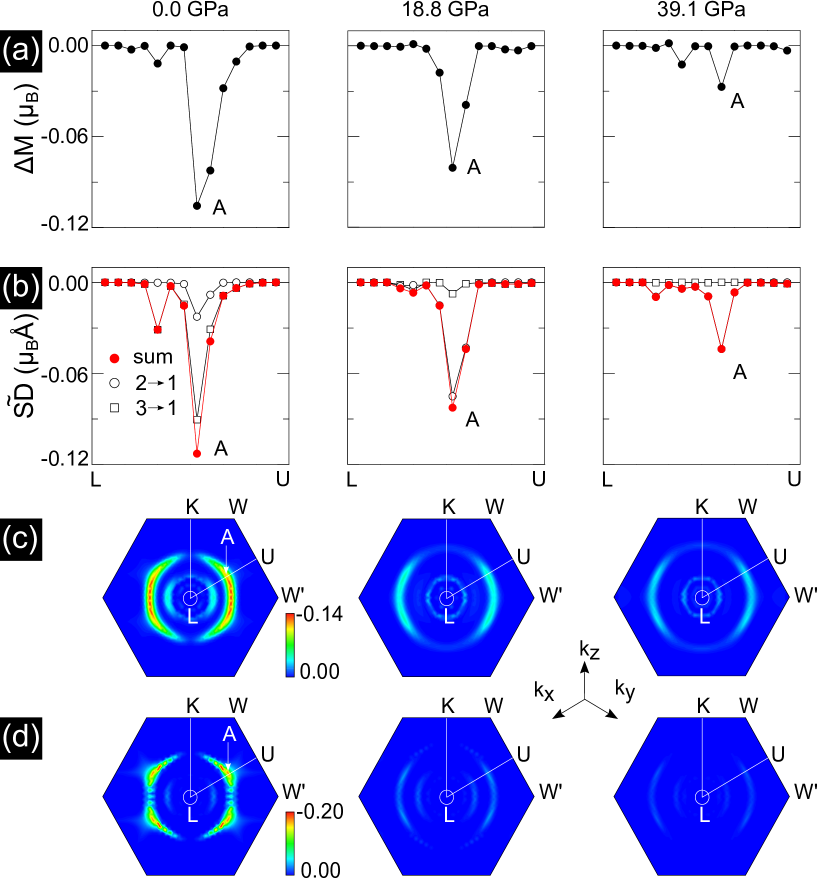
One such line is the L-U line, where a strong spin change is observed. We crystal-momentum-resolve the spin moment change from the L to U point at three pressures from 0 through 39.1 GPa (see the three figures in Fig. 3(a)). Increasing pressure narrows the profile of the spin moment change and reduces the spin moment change at all the points. This spectacular change must be connected with the band structure change, which is shown in Fig. 1(a) with the Fermi energy at 0 eV. Based on the photon energy of 2 eV, we identify two transitions directly responsible for the spin moment change: One is from valence band 2 to conduction band 1 and the other is from valence band 3 to conduction band 1 (see the band dispersion in Fig. 1(a)). As shown before siaip , what matters to the spin moment change is the transition matrix elements and the intrinsic spin differences between transition states. To capture their composite effect, we resort to the factor siaip ,
| (3) |
where and are state indices, is the spin difference between these two states and is the transition matrix element between them. We find that the factor does change with pressure, but the change is too small to explain the change in Fig. 3(a) (not shown). The missing piece of the puzzle is the transition energy change. As pressure increases, both valence bands 2 and 3 are downshifted from the yellow to green bands (see the bottom left inset of Fig. 1(a)). This shift is detrimental to the spin change since now the transition energy falls beyond the photon energy of 2 eV and the transition becomes off-resonant. To include the transition energy effect, we multiply the factor by the Gaussian function
| (4) |
to get a weighted factor. Here is the pressure-dependent transition energy, is the photon energy and eV is a small broadening. Our transition-energy weighted factor diagram is shown in Fig. 3(b). Now, if we compare Figs. 3(a) and 3(b), we see that the factor diagram now agrees with the spin moment change and both peak near a point [] where is the lattice constant of fcc Ni. As pressure increases, this peak shifts slightly toward a larger momentum. This demonstrates that the pressure-induced spin moment change is a joint effect of the spin moment difference, transition matrix element and laser excitation energy window.
We want to know whether the above explanation also holds true for the entire Brillouin zone. We choose a representative plane, the L-W-W′ plane, defined by five special points, L, K, W, U and W′. This plane has the strongest demagnetization. We crystal-momentum resolve the in the two-dimensional plane. Similar to the photoemission intensity map, Fig. 3(c) is an amplitude contour of change, with the scales shown in the lower right corner. Our results are insightful. First, the is not uniform across the plane. Those points with a large are clustered in two sectors, defined by two L-U lines, and they form two concentric arcs. Points with the strongest changes are in the middle, facing the U, W′ and U points. Point in Fig. 3(b) is now just one of many hot spin points in Fig. 3(c). Second, as pressure increases two arcs evolve dramatically. Energetically, two arcs are 0.70 and 1.94 eV from the Fermi surface (see the white circle around the L point). This separation is due to the finite photon energy imposed on the factor. An increase in pressure reduces the factor. The amplitudes of both the inner and outer arcs drop strongly. The inner arc retrieves toward the Fermi surface. Further increase in pressure greatly reduces the amplitudes. We see the same pattern occurring in the spin moment change with pressure (see Fig. 3(d)). However, there are some minor differences. The factor has much finer structures in it, while the spin change contour shows much smoother variations in the momentum space. Also, we see that the spin change is concentrated at a point or its equivalence along the L-U line. These differences are due to the laser excitation, where the pulse smears out the fine details. Except these small differences, our factor captures the main picture of the dynamical spin moment changes. We note in passing that our result remains qualitatively same for a 24 fs pulse. Therefore, our pressure-induced spin change greatly broadens our view of femtomagnetism. Since the state-of-the-art time-, momentum- and spin-resolved photoemission techniques pickel ; stamm are already available, we expect a direct experimental test of our prediction. In high-temperature superconductors, ultrafast lasers have long been used to investigate the Cooper pairing smallwood . Pressure can be directly applied to those materials, in a similar fashion as discussed here.
IV IV. Conclusion
We have proposed a new method to investigate the spin dynamics in ferromagnets, and demonstrated theoretically that the pressure has a dramatic effect on the laser-induced femtosecond (de)magnetization process. This technique is simple and straightforward, an ideal test case for a detailed experimental and theoretical comparison. The pressure greatly decreases the spin moment reduction and then diminishes it as the pressure increases further. The reason is that the magnetization and demagnetization pockets depend on the pressure differently. The demagnetization is very susceptible to the pressure, but not for the magnetization. This creates a competition between them. When the pressure is above 40 GPa, the magnetization pocket completely dominates; as a result, a magnetization enhancement is observed and the demagnetization-to-magnetization transition occurs. The microscopic origin is revealed by examining the band structure change with the pressure. We find that two transitions from two different valence bands to the same conduction are responsible for the dramatic change along the L-U line. This explains the evolution of the most intense spin change pockets in the L-W-W′ plane. Future experiments can directly test our predictions.
V Acknowledgments
This work was supported by the National Basic Research Program of China under No. 2012CB933101 and the U. S. Department of Energy under Contract No. DE-FG02-06ER46304 (MSS and GPZ). This work was also supported by the National Science Foundation of China (NSFC) under Nos. 10804038, 11034004, and 50925103 and the Fundamental Research Funds for the Central Universities (No. 2022013zrct01). We acknowledge part of the work as done on Indiana State University’s high-performance computers. This research used resources of the National Energy Research Scientific Computing Center at Lawrence Berkeley National Laboratory, which is supported by the Office of Science of the U.S. Department of Energy under Contract No. DE-AC02-05CH11231. Our calculation also used resources of the Argonne Leadership Computing Facility at Argonne National Laboratory, which is supported by the Office of Science of the U. S. Department of Energy under Contract No. DPE-AC02-06CH11357. MSS thanks the State Scholarship Fund by the China Scholarship Council for financially supporting his visit at the Indiana State University.
∗xueds@lzu.edu.cn
⋆gpzhang@indstate.edu
References
- (1) E. Beaurepaire, J.-C. Merle, A. Daunois, and J.-Y. Bigot, Phys. Rev. Lett. 76, 4250 (1996).
- (2) M. Aeschlimann et al., Phys. Rev. Lett. 79, 5158, (1997).
- (3) A. Comin, M. Rossi, C. Mozzati, F. Parmigiani and G. P. Banfi, Solid State Commun. 129, 227 (2004).
- (4) K. Vahaplar et al., Phys. Rev. Lett. 103, 117201 (2009).
- (5) A. Kirilyuk, A. V. Kimel, and Th. Rasing, Rev. Mod. Phys. 82, 2731 (2010).
- (6) B. Koopmans et al., Nat. Mater. 9, 259 (2010).
- (7) T. Kampfrath et al., Nature Photonics 5, 31 (2011).
- (8) G. P. Zhang, W. Hübner, E. Beaurepaire and J.-Y. Bigot, Topics Appl. Phys. 83, 245 (2002).
- (9) M. S. Si and G. P. Zhang, J. Phys.: Condens. Matter 22, 076005 (2010).
- (10) C. D. Stanciu, F. Hansteen, A. V. Kimel, A. Kirilyuk, A. Tsukamoto, A. Itoh, and Th. Rasing, Phys. Rev. Lett. 99, 047601 (2007).
- (11) M. Pickel, A. B. Schmidt, F. Giesen, J. Braun, J. Minar, H. Ebert, M. Donath, and M. Weinelt, Phys. Rev. Lett. 101, 066402 (2008).
- (12) C. Boeglin, E. Beaurepaire, V. Haltié, V. López-Flores, C. Stamm, N. Pontius, H. A. Dürr, and J.-Y. Bigot, Nature 465, 458 (2010).
- (13) S. Mathias et al., Proc. Natl. Acad. Sci. USA 109, 4792 (2012).
- (14) R. Torchio, Y. O. Kvashnin, S. Pascarelli, O. Marini, L. Genovese, P. Bruno, G. Garbarino, A. Dewaele, F. Occelli, and P. Loubeyre, Phys. Rev. Lett. 107, 237202 (2011).
- (15) Though one cannot rule out a possible crystallographic phase transition or a transition to a paramagnetic state at ambient temperature and at lower pressure torchio in experiments, fcc Ni phase with ferromagnetic order below 400 Gpa is predicted theoretically, which is also consistent with our simulated results based on the density functional theory.
- (16) C. Stamm et al., Nature Mat. 6, 740 (2007).
- (17) J. L. Olsen, E. Bucher, M. L evy, J. Muller, E. Corenzwit, and T. Geballe, Rev. Mod. Phys. 36, 168 (1964).
- (18) I. Loa, E. I. Isaev, M. I. McMahon, D. Y. Kim, B. Johansson, A. Bosak, and M. Krisch, Phys. Rev. Lett. 108, 045502 (2012).
- (19) J. Wittig, Phys. Rev. Lett. 21, 1250 (1968).
- (20) C. Probst and J. Wittig, Phys. Rev. Lett. 39, 1161 (1977).
- (21) R. Joynt, Phys. Rev. Lett. 71, 3015 (1993).
- (22) K. T. Chan, B. D. Malone, and M. L. Cohen, Phys. Rev. B 86, 094515 (2012).
- (23) D. R. Rhiger and R. Ingalls, Phys. Rev. Lett. 28, 749 (1972).
- (24) C. Vettier, D. B. McWhan, E. I. Blount, and G. Shirane, Phys. Rev. Lett. 39, 1028 (1977).
- (25) Z. Li, T. Iitaka, and T. Tohyama, Phys. Rev. B 86, 094422 (2012).
- (26) A. E. Böhmer, P. Burger, F. Hardy, T. Wolf, P. Schweiss, R. Fromknecht, H. v. Löhneysen, C. Meingast, H. K. Mak, R. Lortz, S. Kasahara, T. Terashima, T. Shibauchi, and Y. Matsuda, Phys. Rev. B 86, 094521 (2012).
- (27) M. Baldini, Y. Ding, S. Wang, Y. Lin, C. A. Tulk, A. M. dos Santos, J. F. Mitchell, D. Haskel, and W. L. Mao, Phys. Rev. B 86, 094407 (2012).
- (28) Ch. Lienau, J. C. Williamson, and A. H. Zewail, Chem. Phys. Lett. 213, 289 (1993).
- (29) W. L. Liu et al., Chem. Phys. Lett. 532, 47 (2012).
- (30) M. Kasami, T. Ogino, T. Mishina, S. Yamamoto, J. Nakahara, J. Lumin. 119, 428 (2011); M. Kasami, T. Mishina, and J. Nakahara, Physica Status Solidi B 241, 3113 (2004).
- (31) D. Christofilos, C. Voisin, N. Del Fatti, F. Vallee, High Pressure Research 22, SI277 (2002).
- (32) R. People and J. C. Bean, Appl. Phys. Lett. 47, 322 (1985).
- (33) P. Blaha, K. Schwarz, G. K. H. Madsen, D. Kvasnicka, and J. Luitz, WIEN2k, An Augmented Plane Wave + Local Orbitals Program for Calculating Crystal Properties (Karlheinz Schwarz, Techn. Universität Wien, Austria, 2001).
- (34) G. P. Zhang, Y. Bai, and T. F. George, Phys. Rev. B 80, 214415 (2009).
- (35) A. Vernes and P. Weinberger, Phys. Rev. B 71, 165108 (2005).
- (36) G. Lefkidis and W. Hübner, J. Mag. Mag. Mater. 321, 979 (2009).
- (37) K. Carva, M. Battiato, and P. M. Oppeneer, Phys. Rev. Lett. 107, 207201 (2011).
- (38) M. Krauß, T. Roth, S. Alebrand, D. Steil, M. Cinchetti, M. Aeschlimann, and H. C. Schneider, Phys. Rev. B 80, 180407(R) (2009).
- (39) G. P. Zhang, W. Hübner, G. Lefkidis, Y. Bai, and T. F. George, Nature Phys. 5, 499 (2009).
- (40) G. P. Zhang and W. Hübner, Phys. Rev. Lett. 85, 3025 (2000).
- (41) G. P. Zhang, Y. Bai, W. Hübner, G. Lefkidis, and T. F. George, J. Appl. Phys. 103, 07B113 (2008).
- (42) J. Wang, I. Cotoros, K. M. Dani, X. Liu, J. K. Furdyna, and D. S. Chemla, Phys. Rev. Lett. 98, 217401 (2007).
- (43) F. Liu, T. Makino, T. Yamasaki, K. Ueno, A. Tsukazaki, T. Fukumura, Y. Kong, and M. Kawasaki, Phys. Rev. Lett. 108, 257401 (2012).
- (44) D. Rudolf et al., Nat. Comm. 3, 1037 (2012).
- (45) Note that the spin moment change depends on the laser parameters and the system geometries. For more details, see Refs. prb09 ; prl00 . To save the computer time, we use a much weak laser intensity here. For stronger laser pulses, the spin moment change can be easily over 10%. For the same reason, our laser pulses are also shorter. This induces the oscillation seen in the magnetization change [see jap08 and J. Appl. Physics 109, 07D303 (2011)].
- (46) M. S. Si and G. P. Zhang, Aip Advances 2, 012158 (2012).
- (47) C. L. Smallwood, J. P. Hinton, C. Jozwiak, W. Zhang, J. D. Koralek, H. Eisaki, D.-H. Lee, J. Orenstein, A. Lanzara, Science 336, 1137 (2012).