Confirmation of Small Dynamical and Stellar Masses for Extreme Emission Line Galaxies at z2
Abstract
Spectroscopic observations from the Large Binocular Telescope and the Very Large Telescope reveal kinematically narrow lines () for a sample of 14 Extreme Emission Line Galaxies (EELGs) at redshifts . These measurements imply that the total dynamical masses of these systems are low (). Their large [O III] equivalent widths ( Å) and faint blue continuum emission imply young ages of Myr and stellar masses of , confirming the presence of a violent starburst. The dynamical masses represent the first such determinations for low-mass galaxies at . The stellar mass formed in this vigorous starburst phase represents a large fraction of the total (dynamical) mass, without a significantly massive underlying population of older stars. The occurrence of such intense events in shallow potentials strongly suggests that supernova-driven winds must be of critical importance in the subsequent evolution of these systems.
Subject headings:
galaxies: dwarf — galaxies: evolution — galaxies: formation — galaxies: high-redshift — galaxies: starburst1. INTRODUCTION
The universe contains a remarkably large number of galaxies with extremely luminous nebular emission lines in comparison to their faint blue continua (van der Wel et al., 2011). These extreme emission line galaxies (EELGs) can have [O III] and/or H equivalent widths (EWs) in excess of 500 Å (Atek et al., 2011; van der Wel et al., 2011; Shim et al., 2011; Brammer et al., 2012b). Such observations suggest that young starbursts dominate the energy output of these otherwise faint galaxies, potentially serving as the principle mode of mass build-up in low-mass galaxies. While similar objects do exist at (Cardamone et al., 2009; Izotov, Guseva, & Thuan, 2011), they have a much lower comoving number density thereby implying that their abundance is a strong function of time.
Without further information, the dwarf interpretation of these galaxies is merely plausible. More massive populations of older stars could easily be outshone by the young starbursts: an old stellar population can have mass-to-light ratios up to 50 times larger than those of the bursts in the near-IR, so the main uncertainty in the interpretation of the observations hinges on the determination of the total masses of these systems. Additionally, the presence of strong emission lines can hinder attempts to determine the stellar mass content, as standard SED-fitting codes do not contain emission line contributions. Hence we do not yet understand the role of this mode of star formation in the broader context of galaxy formation. When these bursts occur in truly low-mass galaxies (), the EELGs may represent the main formation mode of present-day dwarf galaxies, as argued by van der Wel et al. (2011). Alternatively, if these bursts are embedded in more massive systems (), we may be witnessing the early formation stage of Milky Way-type galaxies.
Accurate mass estimates are key in addressing this issue, particularly dynamical masses. For this purpose we now present near-infrared spectroscopy of 14 EELGs at redshifts with [O III] equivalent widths 500 Å from the Large Binocular Telescope (LBT) and the Very Large Telescope (VLT). These are the first dynamical mass measurements of such low-mass, high-redshift galaxies, and we also derive accurate stellar mass estimates through stringent modeling of the continuum and emission line measurements from CANDELS multi-wavelength photometry (Grogin et al., 2011; Koekemoer et al., 2011) and low-resolution grism spectroscopy from the 3D-HST survey (Brammer et al., 2012a).
We adopt a flat CDM cosmology with and Hkm s-1 Mpc-1 throughout.
2. Candidate Selection and Observations
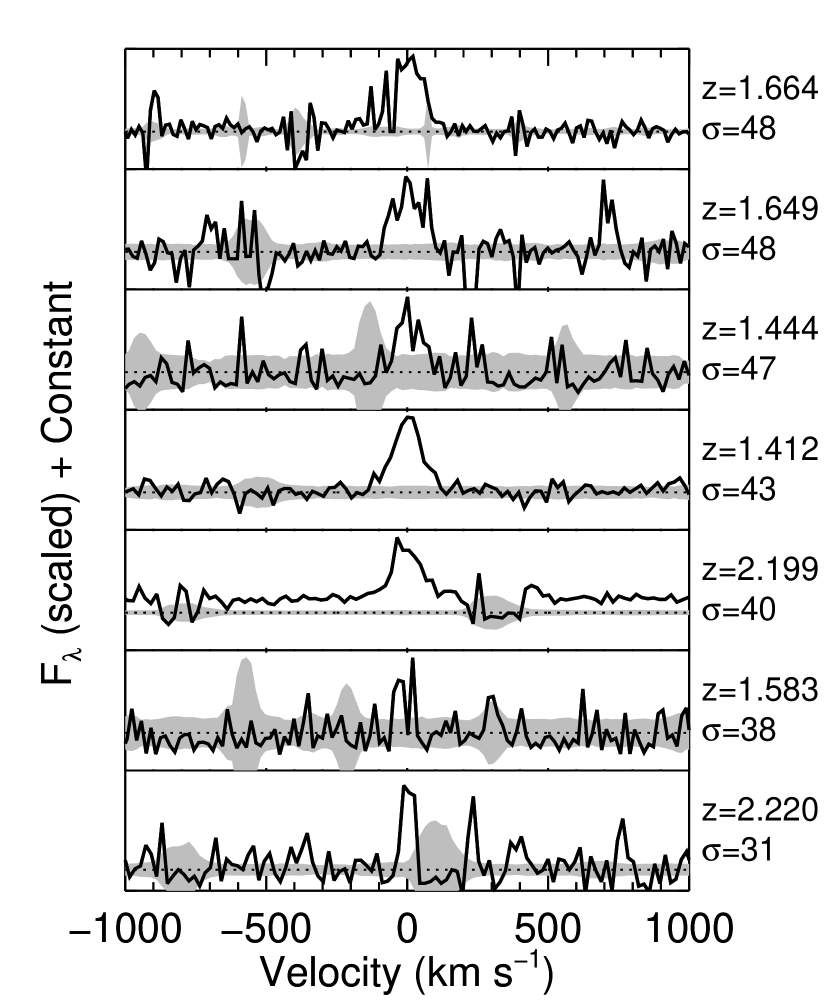
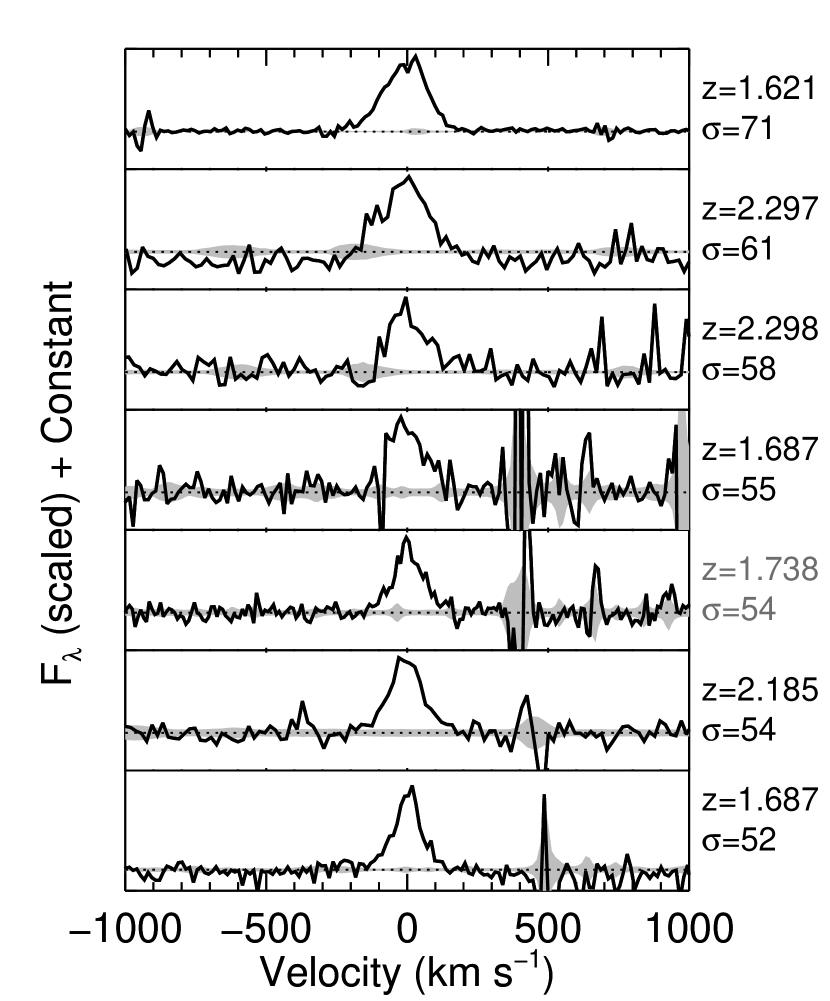
We select a sample of 17 objects with restframe equivalent widths 500 Å in [O III] : five are from the photometrically-selected sample of van der Wel et al. (2011) in the GOODS-S and UDS fields, and the 12 remaining objects were selected based on their 3D-HST grism spectra in the COSMOS, GOODS-S, and UDS fields. One object, COSMOS-10320, although fulfilling the criteria, exhibits broad and asymmetric [O III] (and also H) of 24010 . As this object is an obvious outlier (with a potential AGN contribution), we exclude it from the subsequent analysis and focus on the remaining 16 objects. Although the targets are very faint in the continuum (), the emission lines are strong, with fluxes , making emission line detections possible with 1 hour integrations on 8m class telescopes. We observe five objects using long-slit observations with the X-SHOOTER wide-band spectrograph (Vernet et al., 2011) at the VLT from August to December 2012 (one slit contained two objects), focusing here on the combined NIR region (10242480 nm with resolution ), although it simultaneously observes in the UV-Blue and the Visible regions. Four had 40 minute integrations, while one object was observed for a total of 120 minutes in the near-IR over the course of two nights. The remaining objects in the sample were observed using the LUCI1 multi-object spectrograph (Seifert et al., 2003) at the LBT with four separate masks between April 2012 and March 2013 in the -, -, and/or -band (depending on the redshift, as we targeted [O III] and/or H) with resolution for a minimum of 45 minutes per band. Two objects in the total LUCI1 sample had a priori equivalent widths greater than 500 Å, but severe contamination from OH sky lines at the predicted position of the lines prevents a line extraction and they are not included in this sample. In total, five objects were detected in both H and [O III], one was detected only in H, and eight were detected only in [O III]. The faintest detected line in the X-SHOOTER (LUCI1) sample is 7.4 (6.0) with signal-to-noise of 42 (2). For all observations, seeing was better than 1′′ and typically between 0.3′′ and 0.8′′. All exposures were dithered by 3′′ to decrease dependence on the pixel-to-pixel detector variations and defects.
Reduction of the X-SHOOTER data is performed using version 2.0.0 of the ESO XSHOOTER pipeline151515http://www.eso.org/sci/software/pipelines/xshooter/xsh-pipe-recipes.html, which provides merged, 2D near-IR spectra. Reduction of the LUCI1 data is performed using a custom pipeline, with the wavelength calibration done using the OH sky lines and based on the XIDL routines161616http://www.ucolick.org/~xavier/IDL/. For the brightest emission lines, we also use XIDL for the final sky subtraction, which uses a spline-fitting algorithm to measure and remove the sky lines.
Identified emission lines in the 1D spectra are fit with Gaussian functions, where all lines in a subregion of the spectrum (i.e. [O III] 4959,5007 and H) are forced to have the same width and only the ratio of the two [O III] components is fixed to 2.98 (Storey & Zeippen, 2000). When both [O III] and H are observed for a single object, we take the width of the higher-S/N line complex to be the “true” width, which is [O III] for this entire sample. The two line widths are always consistent within 1-. A full description of the data reduction is given in Maseda et al. (in prep).
3. Dynamical and Stellar Masses
3.1. Dynamical Mass Measurements
The velocity dispersions derived above can be used to estimate the dynamical masses according to:
| (1) |
Here, we have adopted the half-light radius as the virial radius. We take as the half-light radius from van der Wel et al. (2012), who provide size measurements from the F125W and F160W HST/WFC3 CANDELS imaging. We choose the filter that does not contain the [O III] emission line to ensure that the size is measured from the continuum light as much as possible. In cases where H is in F160W and [O III] is in F125W, we use the F160W size as [O III] is brighter and therefore may affect the broadband flux more. For objects in which the only line is [O III] in F125W, van der Wel et al. (2011) note that the sizes measured in both bands are still consistent. The typical is 1 kpc, which is larger than the HWHM of the PSF, so these sources are indeed resolved. As noted in Weiner et al. (2006), kinematic estimates using line widths yields a variety of results: Rix et al. (1997) calculate for inclined rotating disks, while Barton & van Zee (2001) calculate for blue compact dwarfs; Erb et al. (2006) use a simple geometric correction to obtain . Here we adopt , with a conservative uncertainty of 33%, as in Rix et al. (1997). Note that this value of would be the same if we assume that these systems are spherical. We find that the 14 EELGs have ranging from 8.7 to 9.7, with a median of 9.1 and an average uncertainty of 0.3.
There are several potential systematic effects that may affect these estimates. First, for these systems the measured half-light radius is not necessarily equal to the virial radius. Indeed, some have irregular morphologies that are not well fit by single-component profiles. Second, these systems likely have an irregular dynamical structure and may not be virialized.
3.2. Stellar Mass Measurements
| ID | RA | Dec | Instrument | EW[OIII],5007 | ) | |||
|---|---|---|---|---|---|---|---|---|
| (deg) | (deg) | (Å) | () | () | () | |||
| COSMOS-15144 | 150.156769 | 2.360800 | LUCI1 | 1.412 | 1130247 | 43.38.9 | 9.110.34 | 8.10 |
| COSMOS-13848 | 150.176987 | 2.345390 | LUCI1 | 1.444 | 888351 | 46.714.4 | 9.220.40 | 8.58 |
| COSMOS-12807 | 150.159546 | 2.333301 | LUCI1 | 1.583 | 628152 | 38.210.0 | 8.880.37 | 7.95 |
| UDS-7444 | 34.473888 | -5.234233 | X-SHOOTER | 1.621 | 71342 | 71.15.7 | 9.660.33 | 8.78 |
| COSMOS-16207 | 150.183090 | 2.372948 | LUCI1 | 1.649 | 53620 | 47.79.5 | 9.400.34 | 8.43 |
| UDS-3760 | 34.428570 | -5.255318 | X-SHOOTER | 1.664 | 73186 | 48.25.9 | 9.040.31 | 7.98 |
| UDS-3646 | 34.426483 | -5.255770 | X-SHOOTER | 1.687 | 70195 | 54.76.1 | 9.470.33 | 8.51 |
| GOODS-S-17892 | 53.171936 | -27.759146 | X-SHOOTER | 1.687 | 69347 | 52.35.7 | 9.050.30 | 8.95 |
| GOODS-S-26816 | 53.071293 | -27.705803 | X-SHOOTER | 1.738 | 86166 | 54.44.5aaH width. | 8.860.31 | 8.53 |
| UDS-11484 | 34.431400 | -5.212120 | LUCI1 | 2.185 | 72395 | 54.29.4 | 9.350.34 | 8.97 |
| COSMOS-11212 | 150.124237 | 2.313672 | LUCI1 | 2.199 | 598189 | 40.38.9 | 8.780.36 | 8.77 |
| COSMOS-8991 | 150.095352 | 2.287247 | LUCI1 | 2.220 | 71485 | 30.99.0 | 8.650.40 | 9.05 |
| UDS-14655 | 34.391373 | -5.195310 | LUCI1 | 2.297 | 50334 | 61.010.8 | 9.670.33 | 9.37 |
| UDS-4501 | 34.390755 | -5.250803 | LUCI1 | 2.298 | 803162 | 57.89.7 | 9.070.33 | 8.32 |
Note. — All IDs refer to the CANDELS catalog for that particular field (COSMOS, UDS, or GOODS-S), all equivalent widths are quoted in the restframe, and all masses are log quantities.
With confirmed redshifts, measured EWs of multiple lines, and multi-wavelength photometry, we are now in a position to estimate the stellar masses and improve upon the photometry-only method of van der Wel et al. (2011). We take 0.32.2m photometry for the two objects in the GOODS-S field from Guo et al. (2013) and the six objects in the UDS field from Galametz et al. (2013). Visual inspection of the IRAC Ch. 1/2 images reveal that eight out of 14 objects have bright neighboring objects that contaminate the flux measurements. For consistency we perform our analysis without IRAC flux measurements for any of the objects, but we note that for those with uncontaminated IRAC fluxes, our modeling results (see below) do not change significantly. That is, the available IRAC fluxes do not reveal an underlying, older population of stars. No such multi-wavelength photometry is as of yet available for the six objects in the COSMOS field. For these objects we use CANDELS 4-band HST photometry (ACS F606W and F814W, WFC3 F125W and F160W).
Here we fit the broadband spectral energy distributions, including line fluxes measured from 3D-HST grism spectroscopy, of our galaxies using a custom version of the MAGPHYS code171717http://www.iap.fr/magphys/magphys/MAGPHYS.html (da Cunha, Charlot, & Elbaz, 2008) that includes nebular emission computed using the Pacifici et al. (2012) model (C. Pacifici et al., in prep.). The stellar emission is computed using the latest version of the Bruzual & Charlot (2003) models using a Chabrier (2003) IMF, and the attenuation by dust is accounted for using the two-component prescription of Charlot & Fall (2000). The nebular emission is computed using the CLOUDY photoionization code (Ferland, 1996), as described in Charlot & Longhetti (2001); Pacifici et al. (2012). MAGPHYS uses a Bayesian approach to compare the measured photometry of observed galaxies with an extensive library of 100,000 spectral energy distribution models spanning a wide range in star formation histories, ages, and metallicities. The standard MAGPHYS priors (calibrated using more massive galaxies at low redshift) are not optimized for this specific population of young ages and low metallicities, so we have modified the standard priors to include a larger fraction of low metallicities (between 0.025 and 1 Z⊙), and younger ages by allowing both rising and declining star formation histories, all with superimposed random bursts of star formation. This method results in stellar masses in the range , which are listed in Table 1.

van der Wel et al. (2011) estimated stellar masses based on photometry alone, making simplistic assumptions for the star formation history, emission line properties, and the metallicity. In Figure 3 we compare our stellar mass estimates with those estimated using the photometric method. Our values are 1.1 times larger (median) with a scatter of 0.20 dex, consistent with no systematic offset. The MAGPHYS modeling results reinforce the notion that these galaxies are dominated, in terms of stellar mass, by a very young stellar population. While the MAGPHYS modeling uses much more information, the crucial elements in both mass estimates are the blue continuum and the strong emission lines, which strongly constrain any modeling approach.
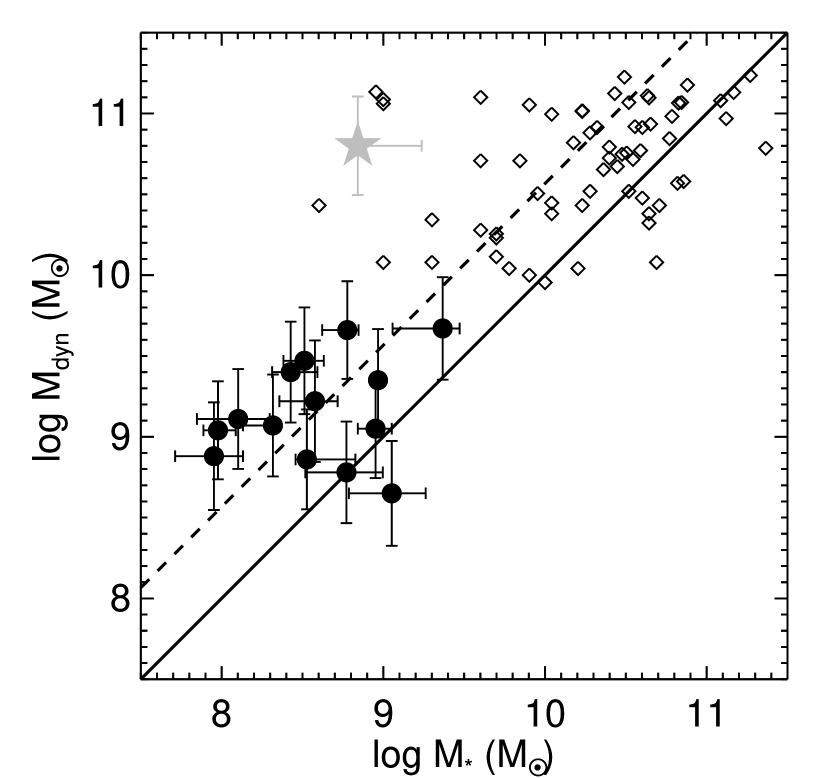
Figure 4 compares the MAGPHYS stellar mass estimates with the dynamical estimates. 0.57 (27% of the total mass is in stars) 0.21 (random) 0.34 (systematic) for the sample where the 0.34 dex systematic uncertainty is from the dynamical mass (see Section 2). The 0.21 dex random uncertainty contains the contributions from the measurement uncertainties and the limited sample size. The three points closest to the line illustrate the challenges to any modeling approach. Two of them are the only galaxies from the COSMOS sample, where the 4-band CANDELS photometry does not sample any continuum redward of [O III] (one of which is also severely contaminated by an OH sky line, making our line dispersion estimate more of a lower limit), and the third is an object with two distinct components in the WFC3 imaging, where the assumptions contained in the dynamical mass estimate may not accurately reflect the true conditions in the system.
The low dynamical masses confirm the low-mass nature of these systems directly and exclude the presence of large amounts of unseen stars, gas, dust, or dark matter that exceed the observed amount of stellar matter by more than a factor of five. Our implied maximal gas fractions do not exceed those for more massive galaxies at similar redshifts, which range from (Daddi et al., 2010; Tacconi et al., 2013). As seen in Figure 4, our galaxies have similar ratios to the starforming sample of Erb et al. (2006), albeit with EWs (and hence specific star formation rates) that are a factor of four higher.
4. Concluding Remarks
In this Letter, we show kinematic line widths in the range for a sample of 14 EELGs (with EW Å) at redshifts . This constitutes the first direct mass measurements for such galaxies at these epochs, with total masses . SED modeling results in stellar masses , ruling-out the presence of an evolved, massive stellar population. Therefore, we conclude that these nascent galaxies are undergoing intense starbursts, and the stars produced in the single burst contribute substantially to their total mass budget. This confirms that the abundant population of EELGs at demonstrate a common starburst phase among low-mass galaxies at these epochs, the intensity of which has only recently been reproduced by hydrodynamical simulations Shen et al. (2013). While the contribution of such strong starbursts to the growth in stellar mass over cosmic time depends on their duty cycle, which is so far unconstrained observationally, their ubiquitous nature at these redshifts van der Wel et al. (2011) points towards the brief starburst phase as important in the mass build-up of most (if not all) dwarf galaxies.
Given the intensity of the starbursts and the shallow potential wells in which they occur, supernova-driven winds likely dominate the star formation history and subsequent evolution of these systems (Larson, 1974). The starbursts may affect the central dark matter distribution (e.g, Navarro, Eke, & Frenk, 1996; Read & Gilmore, 2005; Pontzen & Governato, 2012; Zolotov et al., 2012) and produce cored profiles that are commonly observed in present-day, low-mass galaxies. For a review see de Blok (2010), and Walker & Peñarrubia (2011); Amorisco & Evans (2012) for recent advances. Our current data set does not allow us to make stronger conclusions about the presence of feedback and winds via asymmetric or separate broad/narrow components in individual galaxies. However, with future spectroscopic studies of these objects, we will be able to search for such signals in stacked spectra.
In the present-day universe, such extreme starbursts are very rare (e.g. Cardamone et al., 2009), but at early epochs () such events may well be the rule rather than the exception. It is becoming increasingly clear that strong emission lines affect the search for and interpretation of high-z galaxies. Strong emission line galaxies at moderate redshifts () can masquerade as drop-out selected candidates (see discussion in e.g., Coe et al., 2013; Bouwens et al., 2013; Ellis et al., 2013; Brammer et al., 2013). Furthermore, for true high-redshift galaxies these strong emission lines are likely omnipresent (Smit et al., 2013) and affect the broad-band SED, so they should therefore be included in the modeling as described here in Section 1 (also see Curtis-Lake et al., 2013; Schaerer, de Barros, & Sklias, 2013). However, the results presented here are encouraging. We suggest that if strong emission lines are evident, then it is likely that the total stellar mass does not greatly exceed the mass of the young stellar population traced by the blue continuum.
References
- Amorisco & Evans (2012) Amorisco, N. C., & Evans, N. W. 2012, MNRAS, 419, 184
- Atek et al. (2011) Atek, H., Siana, B., Scarlata, C., et al. 2011, ApJ, 743, 121
- Barton & van Zee (2001) Barton, E. J., & van Zee, L. 2001, ApJ, 550L, 35
- Bouwens et al. (2013) Bouwens, R. J., Oesch, P. A., Illingworth, G. D., et al. 2013, ApJ, 765L, 16
- Brammer et al. (2012a) Brammer, G. B., van Dokkum, P. G., Franx, M., et al. 2012a, ApJS, 200, 13
- Brammer et al. (2012b) Brammer, G. B., Sánchez-Janssen, R., Labbé, I., et al. 2012b, ApJ, 758L, 17
- Brammer et al. (2013) Brammer, G. B., van Dokkum, P. G., Illingworth, G. D., et al. 2013, ApJ, 765L, 2
- Bruzual & Charlot (2003) Bruzual, G., & Charlot, S. 2003, MNRAS, 344, 1000
- Cardamone et al. (2009) Cardamone, C., Schawinski, K., Sarzi, M., et al. 2009, MNRAS, 399, 1191
- Chabrier (2003) Chabrier, G. 2003, PASP, 115, 763
- Charlot & Fall (2000) Charlot, S., & Fall, S. M. 2000, ApJ, 539, 718
- Charlot & Longhetti (2001) Charlot, S., & Longhetti, M. 2001, MNRAS, 323, 887
- Coe et al. (2013) Coe, D., Zitrin, A., Carrasco, M., et al. 2013, ApJ, 762, 32
- Curtis-Lake et al. (2013) Curtis-Lake, E., McLure, R. J., Dunlop, J. S., et al. 2013, MNRAS, 429, 302
- da Cunha, Charlot, & Elbaz (2008) da Cunha, E., Charlot, S., & Elbaz, D. 2008, MNRAS, 388, 1595
- Daddi et al. (2010) Daddi, E., Bournaud, F., Walter, F., et al. 2010, ApJ, 713, 686
- de Blok (2010) de Blok, W. J. G. 2010, Adv. Astron., article id. 789293
- Ellis et al. (2013) Ellis, R. S., McLure, R. J., Dunlop, J. S., et al. 2013, ApJ, 763L, 7
- Erb et al. (2006) Erb, D. K., Steidel, C. C., Shapley, A. E., et al. 2006, ApJ, 646, 107
- Ferland (1996) Ferland, G. J. 1996, in Ferland, G. J., ed., Hazy, A Brief Introduction to Cloudy 90. Internal Report, Univ. Kentucky, Lexington
- Galametz et al. (2013) Galametz, A., Grazian, A., Fontana, A., et al. 2013, ApJS, 206, 10
- Grogin et al. (2011) Grogin, N., Kocevski, D., Faber, S., et al. 2011, ApJS, 197, 35
- Guo et al. (2013) Guo, Y., Ferguson, H. C., Giavalisco, M., et al. 2013, ApJS, 207, 24
- Izotov, Guseva, & Thuan (2011) Izotov, Y. I., Guseva, N. G., & Thuan, T. X. 2011, ApJ, 728, 161
- Koekemoer et al. (2011) Koekemoer, A., Faber, S., Ferguson, H., et al. 2011, ApJS, 197, 36
- Larson (1974) Larson, R. B., 1974, MNRAS, 169, 229
- Leitherer er al. (1999) Leitherer, C., Schaerer, D., Goldader, D., et al. 1999, ApJS, 123, 3
- Navarro, Eke, & Frenk (1996) Navarro, J., Eke, V., & Frenk, C., 1996, MNRAS, 283, 72
- Pacifici et al. (2012) Pacifici, C., Charlot, S., Blaizot, J., & Brinchmann, J. 2012, MNRAS, 421, 2002
- Pontzen & Governato (2012) Pontzen, A., & Governato, F. 2012, MNRAS, 421, 3464
- Read & Gilmore (2005) Read, J. I., & Gilmore, G. 2005, MNRAS, 356, 107
- Rix et al. (1997) Rix, H.-W., Guhathakurta, P., Colless, M., & Ing, K. 1997, MNRAS, 285, 779
- Schaerer, de Barros, & Sklias (2013) Schaerer, D., de Barros, D., & Sklias, P. 2013, A&A, 549, 4
- Seifert et al. (2003) Seifert, W., Appenzeller, I., Baumeister, H., et al. 2003, Proc. SPIE, 4841, 962
- Shen et al. (2013) Shen, S., Madau, P., Conroy, C., Governato, F., & Mayer, L. 2013, arXiv:1308.4131
- Shim et al. (2011) Shim, H., Chary, R.-R, Dickinson, M., et al. 2011, ApJ, 738, 69
- Smit et al. (2013) Smit, R., Bouwens, R. J., Labbé, I., et al. 2013, arXiv:1307.5847
- Storey & Zeippen (2000) Storey P. J., & Zeippen C. J. 2000, MNRAS, 312, 813
- Tacconi et al. (2013) Tacconi, L. J., Neri, R., Genzel, R., et al. 2013, ApJ, 768, 74
- van der Wel et al. (2011) van der Wel, A., Straughn, A., Rix, H.-W., et al. 2011, ApJ, 742, 111
- van der Wel et al. (2012) van der Wel, A., Bell, E., Haussler, B., et al. 2012, ApJS 203, 24
- Vernet et al. (2011) Vernet, J., Dekker, H., D’Odorico, S., et al. 2011, A&A, 536A, 105
- Walker & Peñarrubia (2011) Walker, M. G., & Peñarrubia, J. 2011, ApJ, 742, 20
- Weiner et al. (2006) Weiner, B. J., Willmer, C. N. A., Faber, S. M., et al. 2006, 653, 1027
- Zolotov et al. (2012) Zolotov, A., Brooks, A. M., Willman, B., et al. 2012, ApJ, 761, 71