Risk aversion as an evolutionary adaptation
Abstract
Risk aversion is a common behavior universal to humans and animals alike. Economists have traditionally defined risk preferences by the curvature of the utility function. Psychologists and behavioral economists also make use of concepts such as loss aversion and probability weighting to model risk aversion. Neurophysiological evidence suggests that loss aversion has its origins in relatively ancient neural circuitries (e.g., ventral striatum). Could there thus be an evolutionary origin to risk avoidance? We study this question by evolving strategies that adapt to play the equivalent mean payoff gamble. We hypothesize that risk aversion in the equivalent mean payoff gamble is beneficial as an adaptation to living in small groups, and find that a preference for risk averse strategies only evolves in small populations of less than 1,000 individuals, while agents exhibit no such strategy preference in larger populations. Further, we discover that risk aversion can also evolve in larger populations, but only when the population is segmented into small groups of around 150 individuals. Finally, we observe that risk aversion only evolves when the gamble is a rare event that has a large impact on the individual’s fitness. These findings align with earlier reports that humans lived in small groups for a large portion of their evolutionary history. As such, we suggest that rare, high-risk, high-payoff events such as mating and mate competition could have driven the evolution of risk averse behavior in humans living in small groups.
Introduction
When people are faced with dicey decisions, a well-documented trend holds (Bernoulli,, 1954; Pratt,, 1964; Joseph Arrow,, 1965): If the stakes are sufficiently high, people are risk averse. Risk averseness is usually described as a resistance to accept a deal with risky payoff as opposed to one that is less risky or even safe, even when the expected value of the safer bargain is lower. This tendency can be explained in two ways. First, the classical economists’ account of risk aversion is in terms of the shape of the utility function in expected utility theory. Specifically, the curvature of the utility function is interpreted to measure the agent’s risk attitude, and the more concave the utility function, the more risk averse the agent will be. A concave utility function corresponds to the notion of diminishing marginal utility of wealth according to which “the additional benefit which a person derives from a given increase of his stock of a thing, diminishes with every increase in the stock that he already has” (Marshall,, 1920, p. 79). Second, cumulative prospect theory, perhaps the most influential descriptive account of decision making under risk choice among psychologists and behavioral economists, models risk aversion in terms of three different but related concepts: diminishing marginal utility, loss aversion (i.e., the pain of losses is felt stronger than the joy of equivalent gains), and probability weighting (i.e., the elevation of the weighting function and thus the degree of over/underweighting of small probabilities of gains and losses, respectively) (Kahneman and Tversky,, 1979; Tversky and Kahneman,, 1992).
Risk aversion is also observed outside of economic decisions. For example, foraging animals actively avoid foraging in an area if they cannot reliably find food there (Smallwood,, 1996; Kachelnik and Bateson,, 1996). This work suggests that the risk attitude of both humans and animals may be shaped by a common fundamental principle (Marsh and Kacelnik,, 2002). Moreover, there is considerable evidence from cognitive neuroscience that loss aversion has a neural basis (Trepel et al.,, 2005). Neurophysiological measurements suggests that different regions of the brain process value and risk assessment (Christopoulos et al.,, 2009; Symmonds et al.,, 2010). This work also implies that the neural circuitry that encodes risk aversion (or its building blocks such as loss aversion) is phylogenetically ancient. However, the origin of this neurally encoded risk aversion is rarely discussed (but see Okasha, (2007); Schulz, (2008); Stern, (2010)), even though there is strong evidence that risk-taking behavior has significant genetic components (Cesarini et al.,, 2009; Bell,, 2009). Here, we suggest that selective pressures acting during the evolution of human populations in the past can explain risk averse behavior.
To test whether people are risk averse or risk prone, subjects are usually presented with a monetary gamble where there is a safe choice and a risky choice. For example, the safe choice rewards the subject with a fixed payoff with 100% certainty, whereas the risky choice rewards the subject with a higher payoff () only half of the time. In this equivalent mean payoff gamble (Silberberg et al.,, 1988), the rewards are designed such that the mean payoff of the safe and the risky choice is the same. In other words, as long as the same choice is repeated during the lifetime or over evolutionary time, both risk prone and risk averse choices have the same payoff in the long run. Thus, no choice should be preferred.
In contrast to the equivalent mean payoff gamble studied here, it has been shown (Clark and Yoshimura,, 1993; Yoshimura and Clark,, 1991; Robson,, 1996) that if the risky choice comes with a higher payoff than the certain one, evolution will favor risk prone behavior. Similarly, the certain choice is favored if it has a higher payoff than the risky one. While geometric mean fitness maximization or bet hedging can influence the payoffs received (Donaldson-Matasci,, 2008), these strategies do not affect the payoff in the equivalent mean payoff gamble. Geometric mean fitness maximization and bet hedging requires multiple games, which is not allowed in the gamble studied here. Utility theory also does not explain risk aversion because it makes the same prediction for the certain and risky choice because their payoffs are identical. While prospect theory correctly predicts the human choice, it does not provide a reason for why these choices are beneficial or adaptive, which is the focus of this study.
Of course, the gamble described above is a crude simplification of human choice under risk, which can be shaped by many other factors. External factors such as framing (Tversky and Kahneman,, 1981), how the odds are presented (Hoffrage et al.,, 2000), or if the decision has to be made from experience or from description (Hertwig and Erev,, 2009) play a role in human decision making under risk. The relative value of the payoff to the subject as well as whether the gamble is real or hypothetical can have an effect on the subject’s preference (Holt and Laury,, 2002). Internal factors such as age (Harbaugh et al.,, 2002; Levin and Hart,, 2003), cognitive ability (Boyle et al.,, 2011), and habits or personal circumstance (Campbell and Cochrane,, 1999; Constantinides,, 1990) influence the subject’s decision, as well as how the subject weighs the potential value of losses and gains (Kahneman and Tversky,, 1979). Without downplaying the importance of these factors, the question remains: Where did this risk averse behavior originate from?
Intuitively, one would argue that risk-seeking behavior is not favored by evolution. In fact, it has been proposed that animals actively avoid risk due to the increased mortality risky decisions often entail (Stern,, 2010). When foraging, animals only take risks when the risk of the decision is outweighed by other factors (Bateson,, 2007; Bednekoff,, 1996; Houston,, 1991; Poethke and Liebig,, 2008). Additionally, foraging animals avoid risk when resources are plentiful, but adopt riskier strategies when resources are scarce (Stephen and Krebs,, 1986). Further, organisms ranging from bacteria (Beaumont et al.,, 2009) to birds (Bulmer,, 1984) are suggested to mitigate risk in their reproductive success via bet hedging (Gillespie,, 1974; Slatkin,, 1974; Philippi and Seger,, 1989; Lehmann and Balloux,, 2007). However, in these natural situations risky behavior often does not compensate for the potential cost of taking the risk. Thus, while these circumstances could explain the evolutionary utility of risk averse behavior in many natural settings, it does not explain why humans would be prone to risk aversion in equivalent mean payoff gambles.
Previous studies have reported that in small populations of evolving organisms, the fitness of riskier behaviors is significantly affected by the variance in the payoff of the behavior (Gillespie,, 1974, 1977). This observation suggests that strategies that minimize the variance in the payoff of a gamble should have a selective advantage only in small populations. Consequently, evolution in small populations could potentially explain the origin of risk aversion by humans in equivalent mean payoff gambles. Throughout evolutionary history, humans have experienced at least two population bottlenecks that reduced the human population to as few as 1,000 individuals (Cann et al.,, 1987; Vigilant et al.,, 1991). However, a population size of 1,000 individuals is unlikely to be small enough to evolve risk averse behavior as a dominant strategy in the population (Gillespie,, 1974, 1977). Instead, a more likely explanation is that humans have lived in groups of about 150 individuals throughout their evolutionary history (Aiello and Dunbar,, 1993; Dunbar,, 1993), which plausibly could have been a small enough effective population size for risk aversion to have evolved.
To test whether evolution can explain the emergence of risk averse strategies, we generalize the equivalent mean payoff gamble (with a safe and a risky choice) so that there are an infinite number of possible choices, parameterized by the probability to obtain the high payoff. We choose this payoff to be , so that the mean payoff of any choice will be 1. We will call any of the possible gambles a strategy, and denote each strategy by the probability . The choice then implies that the agent chooses the safest gamble. In this game, there is no limit on how risky the gamble is, except we do not allow strategies with , as they are not normalizable.
In order to study the evolution of the strategy, we simulate a population of agents whose choice of strategy is determined genetically, and inherited by the agent’s offspring. The payoff that the agent receives is taken as the agent’s fitness. A small probability of mutation introduces variation, so that alternative strategies from the ancestral one can be explored. Each agent makes only one decision during its lifetime that determines its fitness, which means that the agents are potentially making a life (positive payoff ) or death (zero payoff) decision. Such a life or death decision is akin to a rare lifetime event that has a large impact on an individual’s fitness, such as mating and mate competition (Buss and Schmitt,, 1993). We use this agent-based simulation to explore how small a single population has to be in order to have a significant impact on the evolution of risk aversion. Additionally, we implement an island-based model to test whether larger populations that were segmented into small groups (with the possibility of migration between groups) could still select for the evolution of risk aversion. Although this model cannot take into account the complexity of human evolution nor the exact circumstances thereof, it can address the plausibility of risk aversion as an evolutionary adaptation to equivalent mean payoff gambles due to small population sizes.
Results
Evolution in a single population
Each agent in a population is represented by a single probability (the agent’s inherited gambling strategy), where determines the fitness of the agent. Every agent only plays the gamble once in their lifetime, so their fitness is determined by polling a random variable
| (1) |
exactly once, where is the probability to receive the corresponding payoff and is the agent’s strategy. An agent equipped with a strategy is considered risk averse, whereas an agent with a strategy is considered risk-prone. All else being equal, we expect that evolution should not prefer any strategy over another, because the mean payoff of a species (individuals with the same ) should be the same regardless of .
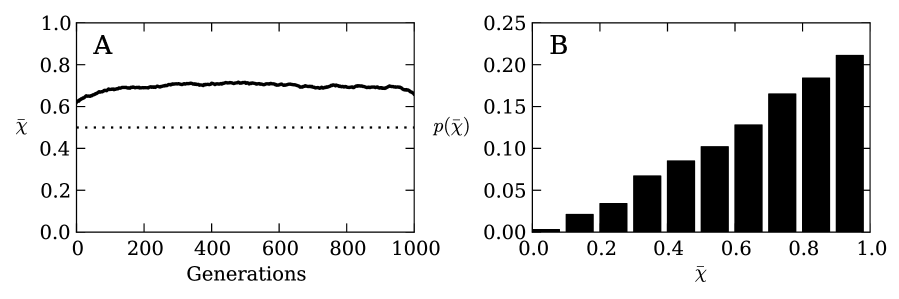
If population size does not have a significant effect on the evolution of risk aversion, we would expect the strategy preference of any individual to drift neutrally, so that at the end of the evolutionary run (generation 950) the expected mean population strategy is (the mean of a uniformly distributed random variable constrained between zero and one). Instead, we observe in Figure 1A that the mean converges to (mean two standard errors).
Similarly, we would expect that if the strategy drifts neutrally, we should observe to be distributed in a uniform manner at the end of the evolutionary runs. Instead, for a population size of , we observe in Figure 1B a distribution that departs significantly from uniformity (Wilcoxon rank sum test P between this distribution and a uniform random distribution). This result suggests that population size plays a critical role in shaping what strategies evolve in the agent population.
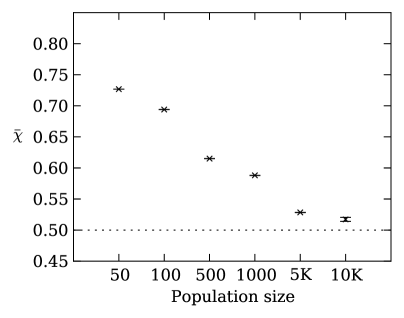
To further explore the effect of population size on evolved strategy preference, we ran the evolutionary simulation with different fixed population sizes. Figure 2 demonstrates that the final evolved strategy depends strongly on the population size. These results highlight that agents in smaller populations prefer risk averse strategies that receive a lower payoff but with higher reliability. In contrast, agents in larger populations do not show a preference for risk averse nor risk prone strategies and converge on because all strategies perform roughly the same in large populations, that is, the of individual strategies drifts neutrally.
Theory of selection for variance
The tendency for natural selection to select against variance in offspring number has been discussed before. Indeed, Gillespie has argued that large variance in offspring number could be selected against because adverse outcomes (few or zero offspring) cannot easily be balanced by favorable outcomes (large broods) for individuals of the same species, because the individuals without offspring may not get to try the “offspring lottery” again (Gillespie,, 1974, 1977). Further, Gillespie proposed an approximate mean actual fitness that takes the variance in the offspring number distribution into account (see Methods, Equation [6]).
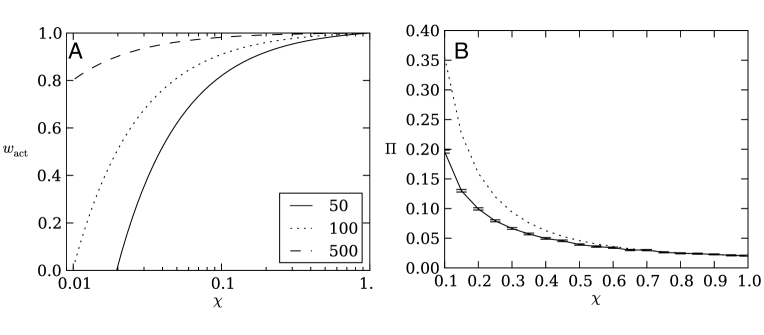
Gillespie’s fitness estimate strongly depends on the strategy choice (because it determines the variance in the offspring number distribution) as well as population size (Figure 3A). Thus, his theory explains why agents that evolved in small populations show a preference for risk averse strategies, whereas agents that evolved in larger populations showed no such strategy preference. We can test the theory directly by measuring the probability (the fixation probability) that a perfectly risk-averse strategy () can invade (and replace) a homogenous population consisting of strategies with choice . We find that the observed probability of fixation (shown in Figure 3B for a population size of ) agrees qualitatively with the fixation probability calculated using Gillespie’s fitness in Kimura’s formula (dashed line in Figure 3B), but not quantitatively. Indeed, an effective fitness of about half of Gillespie’s estimate reproduces the simulations almost exactly, which corroborates earlier findings (Shpak,, 2005).
Evolution in groups
In the previous section, we demonstrated that agents in small populations evolve a preference for strategies with low variance in their payoff distribution, i.e., risk aversion. The group size for humans throughout evolutionary history has been proposed to be around 150 individuals (Aiello and Dunbar,, 1993; Dunbar,, 1993), which suggests that evolving in such small groups could have been the reason behind the evolution of human risk aversion. However, a small group size and a small population size are two different things. While humans might have lived in small groups of 150 individuals, the total population size of humans has been much larger, and were only at times as low as 1,000 individuals (Cann et al.,, 1987; Vigilant et al.,, 1991). Even though selection may occur within groups of about 150, individuals likely migrated between groups. Migration could have caused selection to effectively act on much larger groups (or even the entire human population) negating the selection for variance effect.
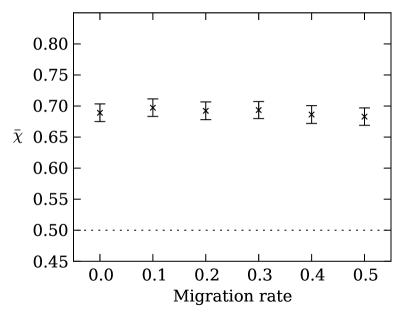
We can simulate such an environment using an island-based evolutionary model (see Methods), in which individuals live in groups (the “islands”) that randomly exchange individuals with each other via migration. For example, we can run 1,000 replicate evolutionary experiments with 128 groups of 128 individuals each, with varying migration rates. In this configuration the total population size is 16,384 individuals, which according to Figure 2 should result in agents evolving no strategy preference. Figure 4 shows that regardless of the migration rate, the group size and not the total population size determines whether agents evolve risk averse strategies. This result suggests that even with migration between groups, the effective population size that selection acts on is determined by the group size and not the total population size.
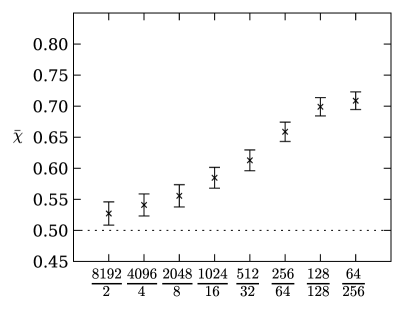
When we change the size of the groups but fix the total population size (i.e., increase the group size and reduce the number of groups) while keeping the migration rate at a constant , we again observe that the group size critically determines the preferred evolved agent strategies (Figure 5). Risk averse strategies are preferred in smaller groups and no strategy is preferred in larger groups. This result recapitulates the results from Figure 2, which shows that the preference for strategies with low payoff variation (i.e., risk aversion) depends on the effective population size.
Relative value of the gamble
Another way to alter risk aversion in humans is by changing the relative value of the payoff (Holt and Laury,, 2002). When the gamble is about small amounts of money (i.e., “peanuts” gambles or hypothetical money), humans tend to be less risk averse, whereas raising the relative value of the gamble increases risk aversion. In our evolutionary simulation, agents play the gamble a single time and the payoff they receive is their only source of fitness. This constraint effectively turns the gamble into a life or death situation, similar to a game with extraordinarily high stakes.
To simulate lower-stakes gambles, we add a baseline payoff () to the payoff so that the fitness of the agent becomes
| (2) |
where is the probability to receive the corresponding payoff and is the agent’s strategy. Typical gambles humans partake in fall either in the loss or in the gain domain. In biological systems, on the other hand, organisms accumulate resources in order to ultimately produce offspring. The “gambles” these organisms undertake will influence the number of offspring, which will be positive or zero. Thus, we can not differentiate between losses or gains like humans would think about gambles for money. Therefore, gains and losses must be considered relative to fitness.
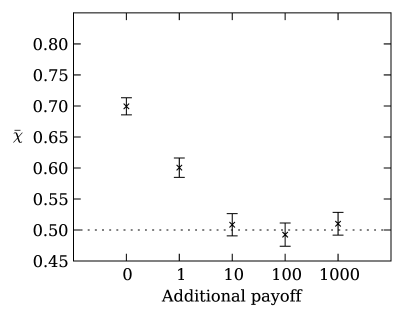
When we run the evolutionary simulation with a population size for various values of , we observe that the larger the baseline becomes, the more often strategies return to an unbiased choice (Figure 6). This result is expected because fitness differences only matter if their relative impact is larger than (Kimura,, 1962; Gillespie,, 2004). Thus, risk averse strategies will only be selected for when the outcome of the gamble represents a significant portion of the individual’s fitness when taking the population size into account.
Repetition of the gamble
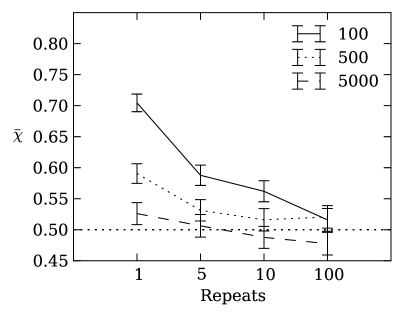
Thus far, we have only investigated one-time gambles. What happens when the agents engage in the same gamble multiple times during their lifetime? Intuitively, repeating the gamble should reduce the variance in the overall payoff the agents receive, and if gambles are played infinitely, the payoffs will converge on the same mean. In this experiment, we do not consider situations where agents can change their behavior based on previous experiences (Lopes,, 1981), but rather focus on unconditional responses. Shown in Figure 7, we observe that the agents do not evolve a preference for risk aversion if the gamble is repeated several times in a lifetime. At the same time, this repetition effect depends strongly on the population size, such that smaller populations still evolve a preference for risk averse strategies with as many as 10 repetitions of the gamble. Therefore, a preference for risk aversion will only evolve for gambles that are encountered only a few times during an individual’s lifetime.
Discussion
We hypothesized that risk aversion in humans could have been an evolutionary adaptation to living in small groups. We tested this hypothesis by evolving digital agents whose fitness is determined by a single choice during their lifetime in groups of varying size, and where that choice is encoded genetically and thus heritable. We observed that a preference for risk averse strategies does indeed evolve, but only when the group size is sufficiently small. These findings align with reports from earlier work that humans lived in groups of about 150 individuals for a large portion of their evolutionary history (Aiello and Dunbar,, 1993; Dunbar,, 1993), providing a plausible evolutionary explanation for the risk averse behavior commonly observed in humans. In other words, these findings provide a quantitative foundation to the idea that evolution can explain risk aversion (Okasha,, 2007).
Additionally, we find that risk aversion is the preferred evolutionary adaptation to life in small groups when these groups are embedded within much larger groups, even with a large amount of migration between groups. However, it is important that the risky decisions occur only rarely during an individual’s lifetime, and where the outcome of the risk represents a significant effect on the individual’s fitness. If the gamble has a negligible impact on fitness (e.g., only small gains are at stake) or if the risk is encountered regularly in the individual’s lifetime, then the selective advantage of risk aversion will be lost. Examples of such rare, high-risk, high-payoff gambles include mating and mate competition (Buss and Schmitt,, 1993).
Our work does not imply that no risk-prone strategies can possibly evolve. What we show is that risk aversion evolves on average, but the distribution of strategies within a population is quite broad (Figure 1). Thus, while on average agents are risk-averse if they evolve in a small population, there will always be some agents that are extremely risk-prone. Such agents can do extraordinarily well by chance and persist, but their genes are ultimately doomed for extinction.
While our model is only haploid and uses a single locus, we do not expect a diploid model using multiple loci to have qualitatively different results from the results presented in this paper. Regardless, gene flow in diploid organisms in an island model and its impact on the evolution of risk aversion is likely an interesting extension of this experiment to pursue in future work.
When exploring whether risk aversion in human decisions today can be explained by evolution in the genes contributing to (risky) mate choice and mate competition during the species’ evolutionary history, we must assume that genes involved in decisions that have a huge impact on fitness like mate choice are also involved in general decision making. This is supported by the evidence that the genes that subserve evaluation and reward are ancient (Symmonds et al.,, 2010), suggesting that ancient risk averse behavior can still influence general decision mechanisms today. However, it is also clear that nature cannot be the only force that has shaped our risk averse behavior, because there is ample evidence that experience is a contributing factor. Thus, while this work has studied the impact that evolutionary history can have on strategy choice, it should be seen only as an element in understanding why humans shy away from risk.
Methods
Single population evolutionary model
We use a genetic algorithm applied on a population of agents to simulate evolution of the population (Michalewicz,, 1996). Each agent in this population is defined by a probability (the “choice”), which encodes the agent’s strategy. We seed the initial agent population by assigning every agent a random drawn from a uniform distribution with a variance of . Varying the initial starting condition has no significant effect on the outcome of the experiments. Every agent in the population only plays the gamble once in its lifetime to determine its fitness, where is the probability to receive a fitness of or receive fitness with a chance . The strategy of each agent can only change due to evolution, i.e., strategies cannot change during the agent’s lifetime.
Once all of the agent fitnesses are evaluated for a given generation, the agents produce offspring into the next generation proportional to their fitness, i.e., we use fitness proportional roulette wheel selection to determine the next generation of individuals Back, (1996), implementing the Wright-Fisher process. Offspring inherit the strategy from their parent (no sexual recombination), except that 1% of all offspring are subjected to mutation. If an offspring is subject to mutation, its new strategy is drawn randomly from a uniform distribution . We repeat this evolutionary process every generation with a fixed population size for 1,000 generations.
Theory of selection for variance in offspring number
Gillespie suggested that in finite populations where the fitness of individuals carries a stochastic component (modeled by a mean and a variance ), the actual realized fitness is given by (Gillespie,, 1974, 1977):
| (3) |
where is the population size. Because in the equivalent mean payoff gamble agents receive a payoff
| (4) |
the variance becomes
| (5) |
and the actual fitness of a strategy is
| (6) |
as the mean of in Equation (4) (in an infinite population) equals 1. The fitness advantage of a strategy with versus a strategy is then
| (7) |
We use Equation (6) to compute the actual fitness of a strategy using a given while taking the size of the population into account (Figure 3A), and we use the fitness advantage (7) in the calculation of the fixation probability using Kimura’s formula in Figure 3B.
Island-based evolutionary model
In our second set of experiments, we use an island-based evolutionary model to simulate an environment in which thousands of individuals are evolving in several small groups. For an overview of island models and the effect of population size, see (Whitley et al.,, 1998; Cantú-Paz and Goldberg,, 2003). Island models have three parameters: The size of a single group, the number of groups, and a migration rate defining how many individuals per group are moved randomly to new groups during each generation. If an agent is selected to migrate, we randomly select a new group and a random agent within that group, and switch agents. Thus, our island-based evolutionary model implements several single population evolutionary models with a fixed fraction of individuals migrating between the populations every generation. The migration rate is the probability that an agent will be picked for migration per generation. For example, a migration rate of 0.1 implies that 10% of the agents in the entire population are picked to switch (affecting up to 20% of the population, as each switch affects two agents).
Typically, island models are used to speed up evolution in rugged fitness landscapes and increase genetic diversity within the population. In this experiment, we are not concerned with ruggedness nor diversity. Instead, we use an island model because it best approximates the scenario of individuals evolving in multiple small groups with some level of inter-group migration.
Retracing the line of descent
At the end of each evolutionary run, we reconstruct the line of descent (LOD) by picking a random agent in the population and tracing back to the first generation using only direct ancestors (Lenski et al.,, 2003). This procedure rapidly converges on the last most recent common ancestor (LMRCA) that swept the population. In our experiments, we determined that the agents on the LOD at generation 950 most often represented the LMRCA, thus we used those agents as the final representative agent for their respective evolutionary run. The LOD between the first agent and the LMRCA of a population contains all mutations that fixed during evolution, while all other mutants were outcompeted. Thus, analyzing an evolutionary run’s LOD enables us to retrace the evolutionary history of the population.
Acknowledgments
We thank Georg Nöldeke for discussions and insights on risk aversion in economics, and Robert Heckendorn for discussions of island models. We gratefully acknowledge the support of the Michigan State University High Performance Computing Center and the Institute for Cyber Enabled Research (iCER).
References
- Aiello and Dunbar, (1993) Aiello, L. C. and Dunbar, R. I. M. (1993). Neocortex Size, Group Size, and the Evolution of Language. Current Anthropology, 34(2):184–193.
- Back, (1996) Back, T. (1996). Evolutionary algorithms in theory and practice: Evolution strategies, evolutionary programming, genetic algorithms. Oxford University Press, New York, NY.
- Bateson, (2007) Bateson, M. (2007). Recent advances in our understanding of risk-sensitive foraging preferences. Proceedings of the Nutrition Society, 61(04):509–516.
- Beaumont et al., (2009) Beaumont, H. J. E., Gallie, J., Kost, C., Ferguson, G. C., and Rainey, P. B. (2009). Experimental evolution of bet hedging. Nature, 462(7269):90–93.
- Bednekoff, (1996) Bednekoff, P. A. (1996). Risk-Sensitive Foraging, Fitness, and Life Histories: Where Does Reproduction Fit into the Big Picture? Integrative and Comparative Biology, 36(4):471–483.
- Bell, (2009) Bell, A. M. (2009). Approaching the genomics of risk-taking behavior. Adv Genet, 68:83–104.
- Bernoulli, (1954) Bernoulli, D. (1954). Exposition of a New Theory on the Measurement of Risk. Econometrica, 22(1):23–36. (Original work published 1738).
- Boyle et al., (2011) Boyle, P. A., Yu, L., Buchman, A. S., Laibson, D. I., and Bennett, D. A. (2011). Cognitive function is associated with risk aversion in community-based older persons. BMC Geriatrics, 11(1):53.
- Bulmer, (1984) Bulmer, M. G. (1984). Risk avoidance and nesting strategies. Mathematical biosciences, 106(4):529–535.
- Buss and Schmitt, (1993) Buss, D. M. and Schmitt, D. P. (1993). Sexual Strategies Theory: An Evolutionary Perspective on Human Mating. Psychological Review, 100(2):204–232.
- Campbell and Cochrane, (1999) Campbell, J. Y. and Cochrane, J. H. (1999). By Force of Habit: A Consumption-Based Explanation of Aggregate Stock Market Behavior. Journal of Political Economy, 107(2):205–251.
- Cann et al., (1987) Cann, R. L., Stoneking, M., and Wilson, A. C. (1987). Mitochondrial DNA and human evolution. Nature, 325(6099):31–36.
- Cantú-Paz and Goldberg, (2003) Cantú-Paz, E. and Goldberg, D. E. (2003). Are multiple runs of genetic algorithms better than one? In Proceedings of GECCO ’03, pages 801–812. Springer-Verlag.
- Cesarini et al., (2009) Cesarini, D., Dawes, C. T., Johannesson, M., Lichtenstein, P., and Wallace, B. (2009). Genetic variation in preferences for giving and risk taking. The Quarerly Journal of Economics, 124:809–842.
- Christopoulos et al., (2009) Christopoulos, G. I., Tobler, P. N., Bossaerts, P., Dolan, R. J., and Schultz, W. (2009). Neural correlates of value, risk, and risk aversion contributing to decision making under risk. J Neurosci, 29(40):12574–83.
- Clark and Yoshimura, (1993) Clark, C. W. and Yoshimura, J. (1993). Behavioral responses to variations in population size: a stochastic evolutionary game. Behavioral Ecology, 4(3):282–288.
- Constantinides, (1990) Constantinides, G. (1990). Habit Formation: A Resolution of the Equity Premium Puzzle. Journal of Political Economy, 98(3):519–543.
- Donaldson-Matasci, (2008) Donaldson-Matasci, M. C. (2008). Phenotypic diversity as an adaptation to environmental uncertainty. Evolutionary ….
- Dunbar, (1993) Dunbar, R. (1993). Coevolution of neocortical size, group size and language in humans. Behavioral And Brain Sciences, 16(4):681–735.
- Gillespie, (1974) Gillespie, J. H. (1974). Natural Selection for within-Generation Variance in Offspring Number. Genetics, 76:601–606.
- Gillespie, (1977) Gillespie, J. H. (1977). Natural Selection for Variances in Offspring Numbers: A New Evolutionary Principle. The American Naturalist, 111(981):1010–1014.
- Gillespie, (2004) Gillespie, J. H. (2004). Population Genetics: A Concise Guide. Johns Hopkins University Press, Baltimore and London, 2nd edition.
- Harbaugh et al., (2002) Harbaugh, W. T., Krause, K., and Vesterlund, L. (2002). Risk Attitudes of Children and Adults: Choices Over Small and Large Probability Gains and Losses. Experimental Economics, 5(1):53–84.
- Hertwig and Erev, (2009) Hertwig, R. and Erev, I. (2009). The description–experience gap in risky choice. Trends in Cognitive Sciences, 13(12):517–523.
- Hoffrage et al., (2000) Hoffrage, U., Lindsey, S., Hertwig, R., and Gigerenzer, G. (2000). Communicating statistical information. Science, 290(5500):2261–2262.
- Holt and Laury, (2002) Holt, C. and Laury, S. (2002). Risk Aversion and Incentive Effects. The American Economic Review, 92(5):1644–1655.
- Houston, (1991) Houston, A. I. (1991). Risk-sensitive foraging theory and operant psychology. Journal of the Experimental Analysis of Behavior, 56(3):585–589.
- Joseph Arrow, (1965) Joseph Arrow, K. (1965). Aspects of the Theory of Risk-bearing. Helsinki: Yrjö Jahnssonin Säätiö.
- Kachelnik and Bateson, (1996) Kachelnik, A. and Bateson, M. (1996). Risky theories—the effects of variance on foraging decisions. Amer. Zool., 36:402–434.
- Kahneman and Tversky, (1979) Kahneman, D. and Tversky, A. (1979). Prospect Theory: An Analysis of Decision under Risk. Econometrica, 47(2):263–292.
- Kimura, (1962) Kimura, M. M. (1962). On the probability of fixation of mutant genes in a population. Genetics, 47:713–719.
- Lehmann and Balloux, (2007) Lehmann, L. and Balloux, F. (2007). Natural selection on fecundity variance in subdivided populations: kin selection meets bet hedging. Genetics, 176(1):361–377.
- Lenski et al., (2003) Lenski, R. E., Ofria, C., Pennock, R. T., and Adami, C. (2003). The evolutionary origin of complex features. Nature, 423(6):139–144.
- Levin and Hart, (2003) Levin, I. P. and Hart, S. S. (2003). Risk preferences in young children: Early evidence of individual differences in reaction to potential gains and losses. Journal of Behavioral Decision Making, 16(5):397–413.
- Lopes, (1981) Lopes, L. L. (1981). Decision making in the short run. Journal of Experimental Psychology: Human Learning and Memory, 7(5):377–85.
- Marsh and Kacelnik, (2002) Marsh, B. and Kacelnik, A. (2002). Framing effects and risky decisions in starlings. Proc Natl Acad Sci U S A, 99(5):3352–5.
- Marshall, (1920) Marshall, A. (1920). Principles of Economics. Library of Economics and Liberty.
- Michalewicz, (1996) Michalewicz, Z. (1996). Genetic Algorithms + Data Structures = Evolution Programs. Springer Verlag.
- Okasha, (2007) Okasha, S. (2007). Rational choice, risk aversion, and evolution. Journal of Philosophy, 104:217–235.
- Philippi and Seger, (1989) Philippi, T. and Seger, J. (1989). Hedging one’s evolutionary bets, revisited. Trends in Ecology & Evolution, 4(2):41–44.
- Poethke and Liebig, (2008) Poethke, H. J. and Liebig, J. (2008). Risk-sensitive foraging and the evolution of cooperative breeding and reproductive skew. BMC Ecology, 8(1):2.
- Pratt, (1964) Pratt, J. (1964). Risk Aversion in the Small and in the Large. Econometrica, 32(1/2):122–136.
- Robson, (1996) Robson (1996). A Biological Basis for Expected and Non-expected Utility. Journal of Economic Theory, 68(2):28–28.
- Schulz, (2008) Schulz, A. (2008). Risky business: evolutionary theory and human attitudes towards risk – A reply to Okasha. Journal of Philosophy, 105:156–165.
- Shpak, (2005) Shpak, M. (2005). Evolution of variance in offspring number: The effects of population size and migration. Theory in Biosciences, 124(1):65–85.
- Silberberg et al., (1988) Silberberg, A., Murray, P., Christensen, J., and Asano, T. (1988). Choice in the repeated-gambles experiment. Journal of the Experimental Analysis of Behavior, 50(2):187–195.
- Slatkin, (1974) Slatkin, M. (1974). Hedging one’s evolutionary bets. Nature, 250(5469):704–705.
- Smallwood, (1996) Smallwood, P. (1996). An introduction to risk sensitivity: The use of Jensen’s inequality to clarify evolutionary arguments of adaptation and constraint. Amer. Zool., 36:392–401.
- Stephen and Krebs, (1986) Stephen, D. W. and Krebs, J. R. (1986). Foraging theory. Princeton University Press.
- Stern, (2010) Stern, M. D. (2010). Patrimony and the evolution of risk-taking. PLoS ONE, 5(7):e11656.
- Symmonds et al., (2010) Symmonds, M., Bossaerts, P., and Dolan, R. J. (2010). A behavioral and neural evaluation of prospective decision-making under risk. J Neurosci, 30(43):14380–9.
- Trepel et al., (2005) Trepel, C., Fox, C. R., and Poldrack, R. A. (2005). Prospect theory on the brain? toward a cognitive neuroscience of decision under risk. Brain Res Cogn Brain Res, 23(1):34–50.
- Tversky and Kahneman, (1981) Tversky, A. and Kahneman, D. (1981). The Framing of Decisions and the Psychology of Choice. Science, 211(4481):453–458.
- Tversky and Kahneman, (1992) Tversky, A. and Kahneman, D. (1992). Adavances in prospect theory: Cumulative representation of uncertainty. Journal of Risk and Uncertainty, 5:297–323.
- Vigilant et al., (1991) Vigilant, L., Stoneking, M., Harpending, H., Hawkes, K., and Wilson, A. C. (1991). African populations and the evolution of human mitochondrial DNA. Science, 253(5027):1503–1507.
- Whitley et al., (1998) Whitley, D., Rana, S., and Heckendorn, R. B. (1998). The island model genetic algorithm: On separability, population size and convergence. Journal of Computing and Information Technology, 7:33–47.
- Yoshimura and Clark, (1991) Yoshimura, J. and Clark, C. W. (1991). Individual adaptations in stochastic environments. Evolutionary Ecology, 5(2):173–192.