11email: [guzman,pety,gratier]@iram.fr 22institutetext: Departamento de Astrofísica. Centro de Astrobiología. CSIC-INTA. Carretera de Ajalvir, Km 4. Torrejón de Ardoz,
28850 Madrid, Spain.
22email: jr.goicoechea@cab.inta-csic.es 33institutetext: LERMA - LRA, UMR 8112, Observatoire de Paris and Ecole normale Supérieure, 24 rue Lhomond, 75231 Paris, France.
33email: maryvonne.gerin@lra.ens.fr 44institutetext: LUTH UMR 8102, CNRS and Observatoire de Paris, Place J. Janssen, 92195 Meudon Cedex, France.
44email: [evelyne.roueff,franck.lepetit,jacques.lebourlot]@obspm.fr 55institutetext: UJF-Grenoble 1/CNRS-INSU, Institut de Planétologie et d’Astrophysique de Grenoble (IPAG) UMR 5274, 38041 Grenoble, France
55email: alexandre.faure@obs.ujf-grenoble.fr
The IRAM-30m line survey of the Horsehead PDR:
IV. Comparative chemistry of and ††thanks: Based
on observations obtained with the IRAM Plateau de Bure
interferometer and 30 m telescope. IRAM is supported by
INSU/CNRS (France), MPG (Germany), and IGN (Spain).
Abstract
Context. Theoretical models and laboratory experiments show that is efficiently formed on cold grain surfaces through the successive hydrogenation of CO, forming HCO and as intermediate species. In cold cores and low UV-field illumination photo-dissociation regions (PDRs) the ices can be released into the gas-phase through non-thermal processes, like photodesorption, increasing considerably their gas-phase abundances.
Aims. We investigate the dominant formation mechanism of and in the Horsehead PDR and its associated dense core.
Methods. We performed deep integrations of several and lines at two positions in the Horsehead, namely the PDR and dense core, with the IRAM-30m telescope. In addition, we observed one higher frequency line with the CSO telescope at both positions. We determine the and column densities and abundances from the single-dish observations complemented with IRAM-PdBI high-angular resolution maps () of both species. We compare the observed abundances with PDR models including either pure gas-phase chemistry or both gas-phase and grain surface chemistry.
Results. We derive abundances relative to total number of hydrogen atoms of and in the PDR and dense core positions, respectively. These abundances are similar to the inferred abundance in both positions (). We find an abundance ratio / of in the PDR and in the dense core. Pure gas-phase models cannot reproduce the observed abundances of either or at the PDR position. Both species are therefore formed on the surface of dust grains and are subsequently photodesorbed into the gas-phase at this position. At the dense core, on the other hand, photodesorption of ices is needed to explain the observed abundance of , while a pure gas-phase model can reproduce the observed abundance. The high-resolution observations show that is depleted onto grains at the dense core. is thus present in an envelope around this position, while is present in both the envelope and the dense core itself.
Conclusions. Photodesorption is an efficient mechanism to release complex molecules in low FUV-illuminated PDRs, where thermal desorption of ice mantles is ineffective.
Key Words.:
astrochemistry – ISM: clouds – ISM: molecules – ISM: photon-dominated ragion (PDR) – radiative transfer – radio lines: ISM1 Introduction
| Molecule | Transition | Frequency | Instrument | Mode | Beam | Vel. Resol. | Int. Time | Noise | Reference | |
|---|---|---|---|---|---|---|---|---|---|---|
| GHz | arcsec | hours | K () | K () | ||||||
| Continuum at 1.2 | 30m/MAMBO | — | – | – | – | – | Hily-Blant et al. (2005) | |||
| 216.112582 | 30m/HERA | FSW | 0.11 | 1.5/2.0a | 230 | 0.10 | Pety et al. (2007) | |||
| 218.222190 | 30m/HERA | PSW | 0.05 | 2.1/3.4a | 280 | 0.32 | Guzmán et al. (2011) | |||
| 145.602949 | 30m/EMIR | PSW | 0.20 | 7.4/12.9a | 208 | 0.17 | This work | |||
| 145.097370 | 30m/EMIR | PSW | 0.20 | 7.4/12.9a | 208 | 0.108b | This work | |||
| 30m/C150 | FSW | 0.20 | 2.6/3.2a | 163 | 0.108b | This work | ||||
| 145.103152 | 30m/EMIR | PSW | 0.20 | 7.4/12.9a | 208 | 0.095b | This work | |||
| 30m/C150 | FSW | 0.20 | 2.6/3.2a | 263 | 0.095b | This work | ||||
-
a Two values are given for the integration time: the on-source time and the telescope time.
b The noise value is computed on the final maps that combines the data from both observing runs (2007 & 2012).
| Molecule | Transition | Frequency | Instrument | Beam | PA | Vel. Resol. | Int. Time | Noise | Reference | |
|---|---|---|---|---|---|---|---|---|---|---|
| GHz | arcsec | ∘ | hours | K () | mK () | |||||
| HCO | 86.670760 | PdBI/C&D | 16 | 0.20 | 6.5b | 150 | 90c | Gerin et al. (2009) | ||
| 145.602949 | PdBI/C&D | 166 | 0.20 | 5.3/19b | 145 | 244 | This work | |||
| 145.097370 | PdBI/C&D | 166 | 0.20 | 5.3/19b | 145 | 116 | This work | |||
| 145.103152 | PdBI/C&D | 166 | 0.20 | 5.3/19b | 145 | 127 | This work |
-
b Two values are given for the integration time: the on-source time (as if the source were always observed with 6 antennae) and the telescope time.
c The noise values quoted here are the noises at the mosaic phase center (Mosaic noise is inhomogeneous due to primary beam correction; it steeply increases at the mosaic edges).
Formaldehyde () and methanol () are key species in the synthesis of more complex organic molecules, like amino acids and other prebiotic molecules (Bernstein et al., 2002; Muñoz Caro et al., 2002; Garrod et al., 2008), that could eventually end up in proto-planetary disks, and hence in new planetary systems. It is therefore of great interest to understand how these molecules are formed. Both species have been detected in a wide range of interstellar environments, with typical gas-phase abundances relative to H2 of in hot cores (e.g., Sutton et al., 1995; Ceccarelli et al., 2000) and in cold dark clouds (e.g., Bergman et al., 2011). They are also observed in shocked regions, caused by an impact of molecular outflows on the surrounding molecular clouds (e.g., Sakai et al., 2012; Codella et al., 2012; Tafalla et al., 2010). Being slightly asymmetric rotors, and are good tracers of the physical conditions in Galactic and extragalactic molecular clouds (Mangum & Wootten, 1993; Leurini et al., 2004; Mangum et al., 2013).
Unlike , which can be formed both in the gas-phase and on the surface of dust grains, is thought to be formed entirely on the surfaces of dust grains, because classical ion-neutral chemistry in the gas-phase alone cannot account for the observed abundances (Garrod et al., 2006; Geppert et al., 2006). The mechanism to form on ices is thought to be the successive hydrogenation of CO, forming as an intermediate product,
| (1) |
where are activation energy barries (Tielens & Whittet, 1997; Watanabe & Kouchi, 2002). Indeed, laboratory experiments have succeeded to efficiently form both and through this mechanism (Watanabe et al., 2004; Fuchs et al., 2009). Moreover, observations by the Infrared Space Observatory (ISO) and Spitzer have shown that dust grains are covered by ice mantles in the cold envelopes surrounding high-mass protostars (Gibb et al., 2000, 2004), low-mass protostars (Boogert et al., 2008; Pontoppidan et al., 2008; Öberg et al., 2008; Bottinelli et al., 2010) and in isolated dense cores (Boogert et al., 2011). These studies revealed that the ice mantles consist mostly of H2O, CO2 and CO, with smaller amounts of , CH4, NH3 and . HCO ice has not been detected in the interstellar medium (ISM), probably because its formation on the ices is slower than its subsequent hydrogenation to form . Indeed, the reactions starting with CO and in the hydrogenation path (1) have activation energy barriers (Fuchs et al., 2009).
Once these species are formed on the ices, they can be desorbed into the gas-phase either through thermal or non-thermal processes. Thermal desorption dominates in regions where dust grains reach temperatures of at least 45 K for formaldehyde (Tielens & Allamandola, 1987), and 80 K for methanol (Brown & Bolina, 2007; Green et al., 2009). This happens in hot cores and hot corinos (e.g., Jørgensen et al., 2005; Bisschop et al., 2007; Bottinelli et al., 2007), but also in highly far-UV illuminated PDRs, like in the Orion bar (Leurini et al., 2010). Non-thermal desorption by far UV photons can also be efficient, as shown by laboratory experiments (Öberg et al., 2009b, c). Non-thermal desorption dominates in colder regions, either UV-shielded dense cores where secondary UV photons are produced by the interaction between cosmic rays and H2 molecules (e.g., Caselli et al., 2012) or in low UV-field illumination photo-dissociation regions, where dust grains are too cold to sublimate their ices. This is the case of the Horsehead, where the combination of moderate radiation field ( relative to the Draine field; Draine, 1978), and high density () implies low dust grain temperatures, from K in the outer PDR to K slightly deeper inside the cloud (Goicoechea et al., 2009a). Guzmán et al. (2011) compared single-dish observations of with PDR models including grain-surface chemistry. They showed that the observed abundance in the UV-illuminated edge of the Horsehead nebula can only be explained by the formation of on the grains followed by its photo-desorption into the gas-phase. Pure gas-phase chemistry was enough to explain the abundance in the colder and UV-shielded gas. The assignments of different formation routes were strengthened by the different measured ortho-to-para ratio of : the dense core displays an equilibrium value of , while the PDR displays an out of equilibrium value of . The PDR model predicted that will be one order of magnitude more abundant in the PDR than the IRAM-30m beam-averaged measurements.
In order to further constrain the chemistry of complex organic molecules and check the high abundance in the PDR position predicted by the model, here we present high-resolution interferometric maps of and , in addition to single-dish deep integrations of the low lying rotational lines of towards two particular positions in the Horsehead: the warm PDR and its associated cold dense core. The observations and data reduction are presented in Sect. 2. The resulting single-dish and interferometric data are described in Sect. 3. In Sect. 4, we compute the column densities and abundances. We compare these results with PDR models in Sect. 5. A discussion is presented in Sect. 6. We summarize and conclude in Sect. 7.
| Position | Molecule | Transition | Line area | Velocity | FWHM | RMS | S/N | ||
| GHz | mK | mK | |||||||
| PDR | 84.521 | 29.1 3.1 | 10.640.05 | 0.980.14 | 27.9 | 4.7 | 6 | ||
| 96.739 | 74.1 4.3 | 10.730.02 | 0.560.04 | 125.0 | 9.4 | 13 | |||
| 96.745 | 22.3 4.7 | 10.680.05 | 0.630.21 | 33.2 | 7.5 | 4 | |||
| 145.094 | 26.9 6.5 | 10.770.05 | 0.420.11 | 59.8 | 21.7 | 3 | |||
| 145.097 | 98.4 9.0 | 10.540.02 | 0.510.06 | 180.8 | 21.5 | 8 | |||
| 241.767 | 81.0 8.8 | 10.660.04 | 0.850.11 | 89.5 | 13.1 | 7 | |||
| 96.741 | 120.3 3.9 | 10.730.01 | 0.610.02 | 186.6 | 7.7 | 24 | |||
| 145.103 | 145.7 7.0 | 10.660.01 | 0.510.03 | 266.2 | 19.4 | 14 | |||
| 241.791 | 59.5 7.3 | 10.810.03 | 0.480.08 | 117.1 | 12.5 | 9 | |||
| 300.837 | 204.139.0 | 10.750.07 | 0.680.16 | 281.1 | 60.8 | 5 | |||
| Core | 84.521 | 43.8 3.0 | 10.640.02 | 0.650.05 | 63.3 | 6.4 | 10 | ||
| 96.739 | 304.4 3.5 | 10.650.00 | 0.570.01 | 497.5 | 7.9 | 63 | |||
| 96.745 | 57.6 2.7 | 10.660.01 | 0.500.03 | 107.6 | 5.7 | 19 | |||
| 96.755 | 25.0 | 7.0 | 3 | ||||||
| 108.894 | 74.4 4.6 | 10.630.01 | 0.460.03 | 151.8 | 13.5 | 11 | |||
| 145.094 | 50.4 6.9 | 10.480.02 | 0.310.05 | 154.5 | 24.3 | 6 | |||
| 145.097 | 449.7 7.5 | 10.480.00 | 0.520.01 | 819.8 | 21.6 | 38 | |||
| 145.132 | - | - | 22.0 | - | |||||
| 157.271 | 122.311.0 | 10.660.03 | 0.560.05 | 206.9 | 34.8 | 6 | |||
| 157.276 | 69.5 9.7 | 10.640.03 | 0.420.07 | 154.0 | 28.1 | 5 | |||
| 213.427 | 42.8 6.4 | 10.640.04 | 0.460.07 | 87.5 | 12.2 | 7 | |||
| 218.440 | 47.4 5.6 | 10.620.04 | 0.620.08 | 71.5 | 9.2 | 8 | |||
| 241.767 | 170.8 7.9 | 10.570.01 | 0.520.03 | 311.5 | 15.3 | 20 | |||
| 254.015 | 59.6 4.3 | 10.530.02 | 0.440.03 | 126.5 | 7.9 | 16 | |||
| 261.806 | 43.3 7.3 | 10.560.03 | 0.290.14 | 141.1 | 22.5 | 6 | |||
| 96.741 | 448.5 3.9 | 10.650.00 | 0.580.01 | 725.6 | 8.1 | 89 | |||
| 145.103 | 527.2 8.0 | 10.560.00 | 0.520.01 | 949.5 | 21.3 | 45 | |||
| 241.791 | 200.2 8.9 | 10.670.01 | 0.470.02 | 398.4 | 16.2 | 25 | |||
| 300.837 | 211.133.0 | 10.780.05 | 0.620.10 | 320.8 | 56.4 | 6 |
-
a Fixed to compute the upper limit in line area.
Note: All temperatures are given in the main beam temperature scale.
2 Observations and data reduction
In this section, we describe the observations and data reduction of the newly acquired and data. A detailed description of the HCO, 218.222 GHz , and 1.2mm continuum observations and data reduction can be found in Gerin et al. (2009), Guzmán et al. (2011), Pety et al. (2007) and Hily-Blant et al. (2005), respectively. Tables 1 and 2 summarize the observation parameters of the data obtained with the IRAM-30m, PdBI and CSO telescopes.
2.1 PdBI maps
We used the Plateau de Bure Interferometer (PdBI) to obtain resolution maps of the emission of the line at 146.603 GHz, the line at 145.097 GHz and the line at 145.103 GHz. These observations were carried out in August and October 2011 with 5 antennas in the D configuration and 6 antennas in the C configuration. The baseline lengths ranged between 24 and 176 m. We observed a 19-field mosaic in a hexagonal pattern covering an almost circular field-of-view of in diameter. The observations used about 19 hours of telescope time. The on-source time scaled to a 6 antenna array is 5.3 hours, after filtering out low quality visibilities. Two correlator windows of 20 MHz (yielding a spectral resolution of 39 kHz) were concatenated to cover both lines. Another 20 MHz window was centered on the targeted line. During the observations, the typical precipitable water vapor amounts to 6 mm and the typical system temperature was 145 K. The median noise level achieved over the mosaic is 0.24 K and 0.12 K (, in channels of 0.2 width) for and , respectively.
We used the standard algorithms implemented in the GILDAS111See http://www.iram.fr/IRAMFR/GILDAS for more information about the GILDAS softwares (Pety, 2005)./CLIC software to calibrate the PdBI data. The radio-frequency bandpass was calibrated by observing the bright quasar 3C454.3. Phase and amplitude temporal variations where calibrated by fitting spline polynomials through regular mesurements of two nearby quasars (0420014 and 0528134). The PdBI secondary flux calibrator MWC349 was observed once during every track, which allowed us to derive the flux scale of the interferometric data. The absolute flux accuracy is .
2.2 30m maps
A multiplicative interferometer filters out the low spatial frequencies, i.e., spatially extended emission. We thus observed the same region with the IRAM-30m single dish telescope in order to recover the low spatial frequency (“short- and zero-spacing”) information filtered out by the PdBI. The (145.603 GHz) line was observed simultaneously with the (145.097 GHz) and (145.103 GHz) lines during hours of average summer weather in August and September 2012. We used both polarizations of the EMIR receivers and the FTS backends at 49 kHz spectral resolution. We used the position-switched, on-the-fly observing mode. The off-position offsets were (RADec) = , i.e., the H ii region ionized by Ori and free of molecular emission. We completed the observations of the 146.097 GHz and 146.103 GHz lines with older but higher quality observations obtained in January 2007. We used one polarization of the C150 receiver and one 20 MHz window of the VESPA correlator, yielding a spectral resolution of 20 kHz. In this case, we used the frequency-switched, on-the-fly observing mode, with a frequency throw of 7.9 MHz. In both observations, we observed along and perpendicular to the direction of the exciting star in zigzags (i.e., the lambda and beta scanning direction). From our knowledge of the IRAM-30m telescope, we estimate the absolute position accuracy to be .
The IRAM-30m data processing was made with the GILDAS/CLASS software. The data were first calibrated to the scale using the chopper-wheel method (Penzias & Burrus, 1973). The mixer tuning tables were wrong for the frequency tuned in 2012. This basically turned the single sideband mixers into double side band ones. As the actual rejection was unknown, we could not recompute an accurate scale. Instead, we fixed the 2012 scale according to the 2007 scale which was correct. To do this, we correlated the 2007 and 2012 data sets, which allowed us to determine the multiplicative factors (1.9 and 2.4 for the vertical and horizontal polarizations, respectively) needed to fix the 2012 data. We applied the same factors for the data that were acquired with the same tuning. The data was converted to main-beam temperatures () using the forward and main-beam efficiencies ( and ). The resulting amplitude accuracy is 10%. We then computed the experimental noise by subtracting a zeroth order baseline from every spectra. A systematic comparison of this noise value with the theoretical noise computed from the system temperature, the integration time, and the channel width, allowed us to filter out outlier spectra. The spectra where then gridded to a data cube through a convolution with a Gaussian kernel. Finally, we fitted another baseline of order 3 through each spectra of the cube.
2.3 Joint imaging and deconvolution of the interferometric and single-dish data
Following Rodriguez-Fernandez et al. (2008), the GILDAS/MAPPING software and the single-dish map from the IRAM-30m were used to create the short-spacing visibilities not sampled by the Plateau de Bure interferometer. In short, the maps were deconvolved from the IRAM-30m beam in the Fourier plane before multiplication by the PdBI primary beam in the image plane. After a last Fourier transform, pseudo-visibilities were sampled between 0 and 15 m (the diameter of the PdBI antenna). These visibilities were then merged with the interferometric observations. Each mosaic field was imaged and a dirty mosaic was built combining those fields in the following optimal way in terms of signal–to–noise ratio (Pety & Rodríguez-Fernández, 2010). The resulting data cubes were then scaled from Jy/beam to temperature scale using the synthesized beam size (see Table 1).
2.4 Deep pointed integrations with the 30m
These observations are part of the Horsehead WHISPER project (Wideband High-resolution Iram-30m Surveys at two Positions with Emir Receivers, PI: J. Pety), a complete and unbiased line survey at 1, 2 and 3 mm, carried out with the IRAM-30m telescope. Two positions were observed: 1) the HCO peak, which is characteristic of the photo-dissociation region at the surface of the Horsehead nebula (Gerin et al., 2009), and 2) the peak, that belongs to a cold condensation located less than away from the PDR edge, where HCO+ and other species are highly deuterated (Pety et al., 2007). Hereafter we will refer to these two positions as the PDR and dense core, respectively. The combination of the new EMIR receivers at the IRAM-30m telescope and the Fourier Transform Spectrometers (FTS) yields a spectral survey with unprecedented combination of bandwidth (36 GHz at 3mm, 25 GHz at 2mm and 76 GHz at 1mm), spectral resolution (49 kHz at 3 and 2mm; and 195 kHz at 1mm), and sensitivity (median noise 8.1 mK, 18.5 mK and 8.3 mK, respectively). A detailed presentation of the observing strategy and data reduction process will be given in a forthcoming paper. In short, any frequency was observed with two different frequency tunings and the Horsehead PDR and dense core positions were alternatively observed every 15 minutes in position switching mode with a common fixed off position. This observing strategy allows us to remove potential ghost lines incompletely rejected from a strong line in the image side band (the typical rejection of the EMIR sideband separating mixers is only 13dB).
2.5 Deep pointed integrations with the CSO
We also report the detection of a new line in the Horsehead. The at line at 300.836 GHz was observed at the Caltech Submillimeter Observatory (CSO) telescope in October 2012. We used the Barney receiver and the FFTS2 backends at 269 kHz spectral resolution. We used the position-switched mode, with the same off-position used in the 30m observations, i.e. (RADec) = . The data processing was made with the GILDAS/CLASS software. A fourth-order baseline was fit and subtracted from the spectra. The data was converted to using a beam efficiency of 0.68, that was measured towards Jupiter.
3 Observational results
3.1 Deep pointed integrations
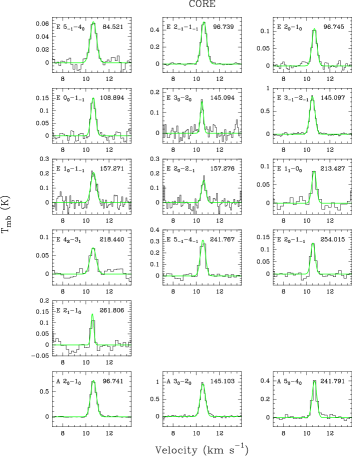
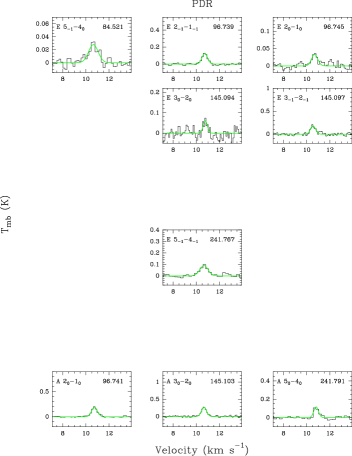
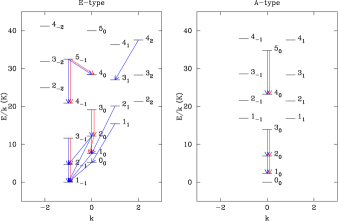
Figure 1 presents the lines detected in the Horsehead. A diagram with the lower energy rotational levels of E-type and A-type methanol is shown in Fig. 2, with color arrows indicating the detected lines. We detected 9 and 16 lines at the PDR and dense core position, respectively. Within these lines, at each position, 3 arise from A-type methanol and the rest arise from E-type methanol. The brightest lines are the ones arising from A-type symmetry species. All lines are brighter in the dense core than in the PDR. The same behavior was found for (Guzmán et al., 2011). Gaussian fits of the lines at the PDR, in general, result in broader line widths than at the dense core. Although, a few lines have similar linewidths towards both positions.
3.2 30m maps
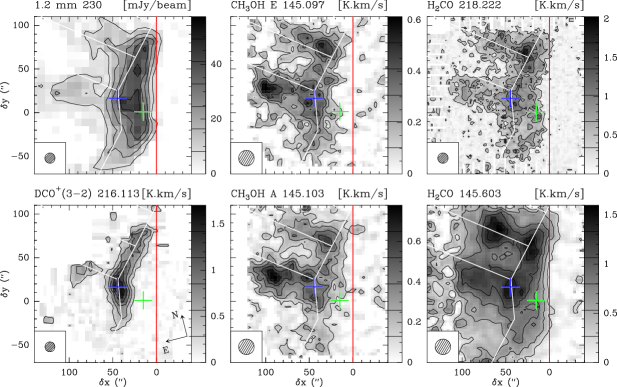
Figure 3 displays the single-dish maps of the 1.2mm dust continuum emission, and the line integrated emission of the (216 GHz) line, the (218 GHz) and (146 GHz) lines, the (146 GHz) line and the (146 GHz) line. The formaldehyde and methanol emission resembles, to first order, the dust continuum spatial distribution. It first follows the photo-dissociation front, i.e. the top of the Horsehead nebula from its front to its mane. It then forms two filaments almost perpendicular to the photo-dissociation front, one of them delineating the Horsehead throat. The E and A-type methanol emission shows similar spatial distributions.
In contrast to the emission, which delineates a narrow filament, formaldehyde and methanol emission is extended. The impression that the formaldehyde emission is slightly more extended than the methanol emission is an artifact related to the different signal-to-noise ratio of these maps. Indeed, the 146 GHz E-type methanol map has by far the lowest signal-to-noise ratio. The highest signal-to-noise ratio map (i.e., the 146 GHz formaldehyde one) thus indicates that both formaldehyde and methanol emit in the PDR region (green cross).
Although the methanol emission, in general, correlates well with the formaldehyde emission, there are a few differences. First, formaldehyde peaks on the right side (closest to the photo-dissociation front) of the dense core as traced by the emission, while methanol peaks on its left side. Second, the 146 GHz formaldehyde line peaks at the emission peak (blue cross), where the gas is cold ( K) and dense (), while presents a local minimum at the same position.
3.3 PdBI maps
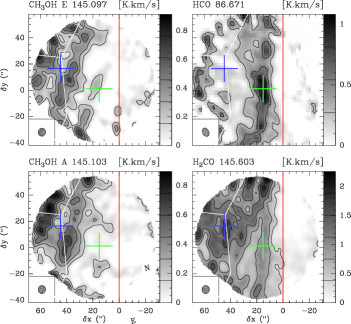
Figure 4 displays the HCO (86.670 GHz), (145.602 GHz), (145.097 GHz) and (145.103 GHz) integrated intensity maps obtained with the PdBI. Contrary to the case of HCO, which peaks in the PDR, and lines are brighter in the more UV-shielded layers of the nebula. However, the filament traced by the HCO emission is clearly seen in the map at the PDR edge. The exact spatial distribution of the emission near the PDR position is difficult to infer due to the low signal-to-noise ratio at this position.
The minimum seen in the methanol 30m maps near the dense core position (blue cross) is present in both methanol lines and it is preserved in the higher angular resolution map. On the other hand, , which was observed simultaneously with , peaks at the dense core. This suggests that 1) the methanol gap is real and not an artifact of the deconvolution, and 2) methanol and formaldehyde emission show opposite behavior at the peak.
In contrast with HCO data, the maps of and emission obtained with the PdBI only data (i.e., without the short-spacings from the IRAM-30m telescope) looks like noise with a typical noise level of 0.15 K. Indeed, the spectra extracted from the hybrid synthesis (PdBI + 30m) cube at the position of the dense core and of the PDR have an integrated area compatible, within the noise level, with the 30m spectra at the same positions. This implies that the beam dilution of the single-dish observations of H2CO and CH3OH is marginal. We will thus use the higher signal-to-noise ratio 30m spectra to infer the column densities at the PDR and dense core positions.
4 Column densities and abundances
4.1
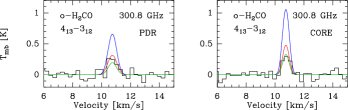
Figure 5 shows the new line detected in the Horsehead. Guzmán et al. (2011) reported the detection of four lines at lower frequencies. They used a nonlocal non-LTE radiative transfer code from Goicoechea et al. (2006) adapted to the Horsehead geometry to model the observed line intensities. The parameters they used are K and at the PDR position and K and at the dense core position. The column density that best reproduced the observations is given in Table 5 and the modelled line profile is shown in red in Fig. 5. The line profiles for two other models are also shown. The new detected line is in agreement with the predictions of our previous model, and thus corroborates the column density derived by Guzmán et al. (2011).
4.2
Typical densities in the Horsehead () are lower than the critical densities of the observed transitions of methanol (see Table 3). We therefore expect the lines to be sub-thermally excited (), and a non-LTE approach is needed to compute the column densities. E and A symmetries of are treated as different species because radiative transitions between them occur in timescales too long compared to the lifetime of the molecules. We do not correct for beam dilution factors because the interferometric maps indicate that beam dilution is marginal for these molecules. The spectroscopic parameters for the detected transitions are given in Table 4.
[b] K K Type E - - A
-
a Computed as:
| Molecule | Transition | ||||
| [GHz] | [K] | [s-1] | |||
| 84.521 | 40.4 | 11 | |||
| 96.739 | 12.5 | 5 | |||
| 96.745 | 20.1 | 5 | |||
| 108.894 | 13.1 | 1 | |||
| 145.094 | 27.1 | 7 | |||
| 145.097 | 19.5 | 7 | |||
| 157.271 | 15.4 | 3 | |||
| 157.276 | 20.1 | 5 | |||
| 213.427 | 23.4 | 3 | |||
| 218.440 | 45.5 | 9 | |||
| 241.767 | 40.4 | 11 | |||
| 254.015 | 20.1 | 5 | |||
| 261.806 | 28.0 | 5 | |||
| 96.741 | 7.0 | 5 | |||
| 145.103 | 13.9 | 7 | |||
| 241.791 | 34.8 | 11 |
We performed non-LTE radiative transfer models using the RADEX LVG model (van der Tak et al., 2007), which computes the line intensities of a species for a given column density, kinetic temperature and density of . We included 100 rotational levels for and , where the maximum energy level lies at cm-1 for both species. We considered and as collision partners with collisional excitation rates from Rabli & Flower (2010). An ortho-to-para ratio of 3 (high temperature limit) was assumed in the models. Lower ortho-to-para ratios were also tested, and we find that the difference is negligible. We also investigated the importance of electrons in the excitation at the PDR. The electron fraction is relative to H2 in the PDR position, while in the dense core the electron fraction is (Goicoechea et al., 2009b). We have computed the electron and electron collisional coefficients within the dipolar Born approximation (e.g., Itikawa, 1971). Owing to the relatively large dipole of methanol (1.7 D), dipole-allowed cross sections are expected to be dominant and mostly determined by the long-range electron-dipole interaction. Thus, for the water molecule which has a similar dipole (1.8 D), Faure et al. (2004) have shown that the Born approximation is accurate down to typically 1 eV. At lower energy, short-range forces can become important and these effects were found to reduce the low energy cross sections by up to a factor of . In the case of methanol, the Born treatment could overestimate the rotational cross sections by a factor of , as suggested by the measurements of the total elastic cross section (see Vinodkumar et al., 2013, and references therein). In the Born approximation, cross sections are proportional to line strengths and the square of the dipole and therefore strictly obey the dipolar selection rule. In this work, line strengths and dipoles were taken from the JPL catalog (Pickett et al., 1998). Excitation cross sections were computed in the energy range 0.1 meV eV and rate coefficients were deduced in the range K, for the lowest 256 levels of (1853 transitions) and the lowest 256 levels of (2324 transitions).
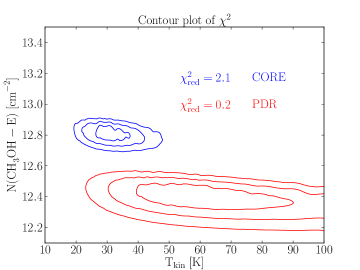
We first constrained the column density of , as we detected more lines of this species. The density profile across the PDR in the Horsehead is well constrained (Habart et al., 2005). Several efforts have been made to compute the thermal profile, but it remains less constrained than the density. We therefore decided to fix the density and vary the temperature in our models. For this, we run grids of models for kinetic temperatures of K and column densities between and . The density of was kept constant to the well-known values of in the PDR, and in the dense core. Then, the was computed222, with the number of detected lines. at each point of the grid to determine the best fit parameters. Figure 6 shows the 1, 2 and 3 confidence levels for the PDR (red) and dense core (blue) for models without electron excitation. The best fits are for kinetic temperatures of 60 K (PDR) and 30 K (core), in good agreement with previous determinations. The column densities are well constrained. The best fits are for column densities of and for the PDR and dense core, respectively. We also run models for a fixed kinetic temperature instead of a fixed gas density. These models result in similar column densities, but in a gas density of at the dense core position, which is lower than expected ().
We find that the change in the column density when including the electron excitation is negligible in these models. However, for a grid of models with the three parameters ( and ) free and no electron excitation, we find a low kinetic temperature ( K) and a high density () at the PDR. When including the electron excitation, on the other hand, we obtain K and , in much better agreement with previous estimates. The inferred column density is the same for both models (). Hence, collisions with electrons are not important to determine the column density, but they are important to determine the kinetic temperature and density of the gas. The electron excitation was found to be important to determine the column density of CH3CN in the PDR (Gratier et al., 2013).
The determination of the column density is more difficult because only 3 lines were detected, providing less constrains to the model. We thus fixed the kinetic temperature to the best fit values found for , in addition to keeping the density of constant, and run models varying only the column density. The best fits are for column densities of and for the PDR and dense core, respectively.
Table 5 summarizes the derived column densities and abundances relative to total number of atomic hydrogen atoms for HCO, and . The E/A methanol ratio is and for the PDR and dense core, respectively. The total abundance is similar in the PDR and dense core, being only a factor larger in the dense core. Similar abundances were also found for in both positions. The abundance ratio is in the PDR and in the dense core.
4.3 Deuterated
Guzmán et al. (2011) detected single and doubly deuterated formaldehyde in the Horsehead and derived [HDCO]/[] = 0.11 and [D2CO]/[] = 0.04 in the dense core. We now searched for deuterated methanol at this position. We did not detect any transitions from deuterated methanol, but we computed an upper limit for the CH2DOH column density toward the dense core. The low energy transitions of CH2DOH lie at 89 GHz. The RMS noise at this frequency is 6.43 mK with 0.17 spectral resolution. Assuming a linewidth of 0.5, we obtain an upper limit for the integrated line intensity of . This translates into a 1 upper limit for the column density of and a fractionation ratio [CH2DOH/ at the dense core position. Assuming that methanol has fractionation levels similar to that of , we conclude that our data is not sensitive enough to detect lines from deuterated methanol molecules. For reference, singly, doubly and even triply deuterated methanol species, such as CH2DOH, CHD2OH and CD3OH have been detected toward low-mass protostars with abundance ratios of % (CH2DOH), 20% (CHD2OH) and 1.4% (CD3OH) compared to their non-deuterated isotopologue (Parise et al., 2004, 2006).
5 Comparison with models
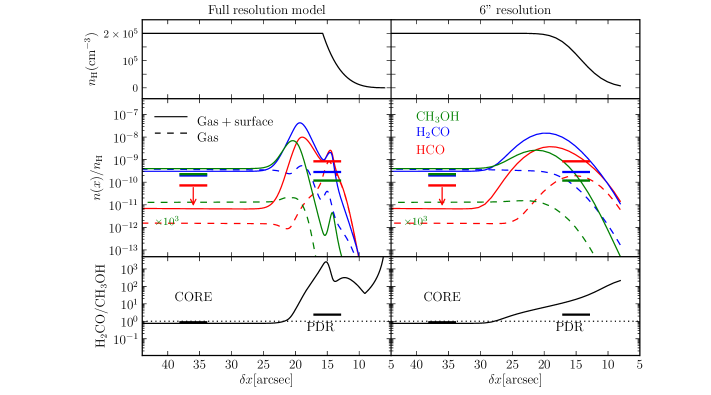
In this section we study the HCO, and chemistry in the Horsehead. We used an updated version of the one-dimensional, steady-state photochemical model (Le Petit et al., 2006), used in the study of by Guzmán et al. (2011). We include the density profile displayed in the upper panel of Fig. 7, a radiation field (relative to the Draine field; Draine, 1978), the elemental gas-phase abundances from Goicoechea et al. (2009b) (see their Table 5) and a cosmic ray ionization rate per molecule.
We compare the results of a pure gas-phase chemical network with one that also includes grain surface reactions. Fig. 7 displays the results for the photochemical models. The left column presents the results computed by the code, which samples the UV-illuminated gas on a finer spatial grid than the UV-shielded gas to correctly represent the steep physical and chemical gradients. The right column presents the results convolved with a Gaussian of 6” (FWHM) to ease the comparison with the abundances inferred from the PdBI observations at 6” angular resolution. The predicted and abundance profiles are shown in the middle panel. The abundance ratio is shown in the lower panel. The horizontal bars show the results inferred from observations. Results for the pure gas-phase model are shown in dashed lines, and results for the model including grain surface chemistry are shown in solid lines.
5.1 Pure gas-phase models
We used a modified version of the pure gas-phase chemical network of the Ohio State University (OSU). Our network includes the photo-dissociation of HCO and of (leading to CO and ), and the atomic oxygen reaction with the methylene radical (CH2) to explain the high abundance of HCO in the PDR (Gerin et al., 2009). The photo-dissociation channel that leads to HCO + H is also included.
As already shown by Guzmán et al. (2011), the pure-gas phase model satisfactorily reproduces the observed abundance in the dense-core (), but it underestimates the abundance in the PDR () by at least one order of magnitude. In this model the formation of is dominated by reactions between oxygen atoms and the methyl radical (CH3) in both the PDR and dense core. The destruction of in the PDR is dominated by reactions with S+ and by photo-dissociation, while it is dominated by reactions with ions (mainly H3O+, HCO+ and S+) in the dense-core.
In the gas-phase, methanol is mainly produced by the dissociative recombination of CH3OH, which is formed by reactions between CH and water. It is now well established that this reaction is not efficient enough to explain the observed abundances (Garrod et al., 2006; Geppert et al., 2006). Indeed, the pure gas-phase model underestimates the abundance by orders of magnitudes in both the PDR and dense core. Note that the abundance predicted by the pure gas-phase model has been multiplied by 1000 in Fig. 7.
5.2 Grain surface chemistry models
We included the reactions on the surface of dust grains to the gas-phase chemical network described in section 5.1. A detailed description of the implementation of grain surface chemistry in the Meudon PDR code will be given in a subsequent paper (Le Bourlot et al., to be submitted). The model includes the adsorption, desorption and diffusive reactions on grains, where the sequence to form formaldehyde and methanol is the one shown in the hydrogenation path (1). We also introduce water formation via hydrogenation reactions of O, OH until H2O. The hydrogenation of formaldehyde can lead to and/or CH2OH. Gas-phase methoxy radical () was recently detected in the cold dense core B1-b (Cernicharo et al., 2012). We do not distinguish between these two isomers, i.e. and CH2OH, in our network. The energy barriers associated with the H+CO (200 K) and H+ (300 K) reactions have been modified with respect to Guzmán et al. (2011). As shown by laboratory studies (Öberg et al., 2009b, a; Muñoz Caro et al., 2010), photo-desorption can be an efficient mechanism to release molecules into the gas phase in regions exposed to radiation fields. We included photodesorption yields of and molecules per incident UV photon, for and , respectively. These values are close to the ones measured in the laboratory for CO, CO2, H2O and (Öberg et al., 2007, 2009a, 2009b, 2009c). Photodesorption of adsorbed can produce both methanol and formaldehyde in the gas-phase with a 50/50 branching ratio. This channel was not included in the model of Guzmán et al. (2011), where photodesorption of adsorbed produced only gas-phase methanol. We checked that for the physical conditions prevailing in the Horsehead PDR and dense core, the use of steady state chemistry in the model is a valid assumption. Indeed, the formation/destruction timescales of and are yr and yr at the PDR and dense core, respectively, while the estimated age of the Horsehead is yr (Pound et al., 2003).
The new results are shown as solid lines in Fig. 7. The dust temperatures in this model are 20 K. The model predicts two abundance peaks at the edge of the nebula ( and ), with peaking deeper inside the cloud than HCO and , and an abundance plateau at the inner layers of the cloud. This way, HCO and dominate at the outer layers of the cloud, while dominates in the inner layers. At the dense core position (), the modeled abundance is similar to the one predicted by the pure gas-phase model. The abundance, on the other hand, increases by orders of magnitude with respect to the pure gas-phase model. The observed and abundances in the dense core are well reproduced by the model including both gas-phase and grain surface chemistry. In the PDR, this model is also in good agreement with the observed HCO and abundances, but the predicted abundance is higher than what is observed.
In this model, is produced by photodesorption of ices everywhere in the cloud. At the dense core, the FUV photons that photodesorb the ices are secondary photons produced by the interaction between cosmic rays and molecules. Gas-phase is mainly destroyed by photodissociation in the PDR, and by freeze-out in the dense core. is produced mainly by direct photodesorption of ices in the PDR position. In the model of Guzmán et al. (2011), we found that the dominant formation path for in the dense core was the gas-phase route involving CH3 and O. With this new model, we find that at the dense core, is produced mainly by photodissociation of ices. This difference is the result of the several modifications made to the model, where the most important one is the inclusion of the channel leading to in the photodesorption of ice. is mainly destroyed by photodissociation in the PDR and by reactions with ions (mainly N2H+ and H) in the dense core333We first run models assuming the solar sulfur abundance (S/H). With this S abundance and including the grain surface chemistry, the destruction of is dominated by reactions with S+ in both the PDR and dense core. We then run models using a lower sulfur abundance (S/H=), which is the one that reproduces the observed CS and HCS+ abundances (Goicoechea et al., 2006). In this model, which is the one adopted in this paper, S+ is not important in the destruction of . As a result, the predicted abundance at the dense core is 3 times higher in the low-S abundance model, and the agreement between model and observations is better. We conclude that a sulfur abundance of S/H can reproduce the observed abundance of CS, HCS+ and .
It is important to remember that models including complex grain surface processes use numerous physical parameters, such as the adsorption energy, diffusion energy of absorbed species, the activation energy of the different hydrogenation reactions and the desorption yield, which have large uncertainties. The results predicted by these models are highly dependent on the values used for these parameters. Providing observational results is key to constrain these parameters and benchmark the models.
6 Discussion
6.1 Observational evidence of different formation mechanisms
The observations suggest that at the PDR, is formed on the surface of dust grains, and at the dense core, is mostly formed in the gas-phase. First, we find a different ortho-to-para ratio in each position: the equilibrium value of 3 is found at the dense core, while a lower out-of-equilibrium value of 2 is found at the PDR. Second, if is formed on the grains, its spatial distribution should resemble the spatial distribution of . However, the high-resolution PdBI maps show that the emission presents a minimum at the dense core position, while peaks at this position. The easiest interpretation is that 1) at the dense core, the photodesorption of both and is not efficient, so the ices remain depleted onto grains, and that 2) is formed on the gas-phase at this position. Indeed, the pure gas-phase model reproduces well the abundance at the dense core. Moreover, the number of photons that can photodesorb species at the dense core are much less than the number of photons available at the PDR position. This way, gas-phase is present in an envelope around the dense core, while is present in both the envelope and the dense core itself. This is consistent with the lower gas density inferred from the radiative transfer analysis of at the dense core position.
Depletion of has also been observed in other dense cores. Tafalla et al. (2006) found that shows a dip in its emission at the center of the dense cores L1498 and L1517B. They concluded that the drop in emission corresponds to a real drop in column density, suggesting that freeze out onto grains at the center of these dense cores.
6.2 Comparison with other environments
and have been detected in the Orion Bar, which is a more extreme case of a PDR (higher , and ). Leurini et al. (2010) estimated an abundance ratio in the interclump medium () and in the denser clumps (). Despite the large uncertainties and the fact that the clumpy medium was not resolved, they concluded that the abundance of methanol relative to formaldehyde decreases by at least one order of magnitude in the interclump medium in comparison to the dense clumps. Unlike the Orion Bar, we do not find a large difference in the abundance ratio between the PDR and dense core in the Horsehead ( is only times larger in the PDR). This is probably due to the difference in the radiation field between the two sources ( in the Orion Bar; in the Horsehead). Hence, photodissociation of (that produces ) is more efficient in the Orion Bar, specially in the interclump medium, and the is thus larger. The abundance ratio we derive in the Horshead () is very similar to the one found in the dense clumps of the Orion Bar. These clumps are more protected from the FUV photons, and thus resemble more the conditions prevailing in the Horsehead. Indeed, in the Horsehead, which is similar to the ratio found in the dense clumps of the Orion Bar ().
Maret et al. (2004, 2005) measured the formaldehyde and methanol abundances towards a sample of low mass protostars. From these studies, an abundance ratio is found for the hot corino region. In the low mass starless cores, L1498 and L1517B, Tafalla et al. (2006) found . These values are comparable to the abundance ratio derived in the Horsehead. A lower abundance ratio is found in hot cores (; Bisschop et al., 2007) and an even lower ratio is found in shocked gas in Galactic center clouds (; Requena-Torres et al., 2006). In the diffuse medium, is widely seen (e.g., Liszt et al., 2006) but methanol has not been detected, although it has been searched for by (Liszt et al., 2008). They derive a upper limit for the column density which translates into a lower limit for the abundance ratio of .
6.3 Thermal and non-thermal desorption
In hot cores, hot corinos and shocked regions the ices that were formed in the cold gas in the prestellar stage are completely sublimated into the gas-phase through thermal desorption and sputtering. The observed and gas-phase abundances in these regions should therefore resemble the original ice composition. Observations of ices in the envelopes of low-mass protostars show large variations of the ice abundance with respect to water ice (1%-30%; Boogert et al., 2008). In cold cores, a methanol ice abundance of 5%-12% relative to water has been found (Boogert et al., 2011). The variations in the ice abundance are caused by the different local physical conditions, and thus reflect the variations in the evolutionary stages of these sources (Cuppen et al., 2009). The abundance of ice has been more difficult to determine because it has been detected in just a few sources and its stronger ice feature at m is blended with that of HCOOH (Öberg et al., 2011). A relatively constant ice abundance of % relative to water is found in low-mass protostars (Gibb et al., 2004; Boogert et al., 2008). This value seems to be independent from the ice abundance. From these detections, an ice abundance ratio is obtained in low-mass protostars, which is consistent with the gas-phase abundance ratio found in hot corinos by (Maret et al., 2004, 2005).
In cold cores and low-UV illumination PDRs, the ices are released through non-thermal processes, like photodesorption. The ratio will thus depend on the dust temperature, and on the number of UV photons that will desorb the ices into the gas-phase. The photodesorption yield has been previously found to be molecules per incident UV photon, similar to other species like CO, CO2 and H2O (Öberg et al., 2009a, b, c). Although the photodesorption yield is uncertain, the one adopted in our model gives a abundance that is consistent with the observations. As discussed in Section 5.2, the predictions of chemical models including grain surface chemistry are highly dependent on the different physical parameters. Future laboratory studies, using different ice mixtures (similar to those observed in the ISM), will help to better understand the non-thermal desorption of ices into the gas-phase and will hopefully provide precise values for the photodesorption yields and other parameters needed in the models.
7 Summary and conclusions
We have presented deep observations of lines toward the Horsehead PDR and its associated dense core, together with single-dish and interferometric observations of and . In general, formaldehyde and methanol emission is extended, although there are a few differences. The emission presents a minimum at the dense core position, that is also seen in the lower angular resolution 30m map, while peaks at this position. From the high-resolution maps, we conclude that beam dilution of the single-dish deep integrations is marginal. This is in contrast with the model prediction of an abundance peak at the PDR position. We therefore confirm the abundances inferred by Guzmán et al. (2011) and derive a similar abundance with respect to H () in the PDR and dense core position, that is also similar to the observed abundance of . We find that collisions with electrons are not important to determine the column density when the physical conditions of the gas are known. However, in order to determine the kinetic temperature and density of the gas, electron excitation should be taken into account. The inferred methanol E/A ratio is close to one in both the PDR and dense core position. The abundance ratio is in the PDR and in the dense core.
At the PDR, observations suggest that both and are formed on the surface of dust grains and are subsequently released into the gas-phase through photodesorption. Indeed, pure gas-phase chemical models predict and abundances that are too low compared to what is inferred from the observations. At the dense core, on the other hand, the dominant formation mechanism differs for and . is mostly formed in the gas-phase, while is formed on the grains. Indeed, a pure gas-phase model can reproduce the observed abundance at this position, while it fails by orders of magnitude for . Moreover, the high-resolution PdBI maps show that is present in an envelope around the dense core, while is present in both the envelope and the dense core itself. The different formation mechanisms in the PDR and dense core are strengthened by the different ortho-to-para ratio inferred from the observations ( in the PDR and the equilibrium value in the dense core).
Acknowledgements.
We thank the IRAM PdBI and 30 m staff for their support during the observations. We thank Simon Radford for his help during the CSO observations and data reduction. VG thanks support from the Chilean Government through the Becas Chile scholarship program. This work was also funded by grant ANR-09-BLAN-0231-01 from the French Agence Nationale de la Recherche as part of the SCHISM project. J.R.G. thanks the Spanish MINECO for funding support from grants AYA2012-32032, AYA2009-07304 and CSD2009-00038. J.R.G. is supported by a Ramon y Cajal research contract.References
- Bergman et al. (2011) Bergman, P., Parise, B., Liseau, R., & Larsson, B. 2011, A&A, 527, 39
- Bernstein et al. (2002) Bernstein, M. P., Dworkin, J. P., Sandford, S. A., Cooper, G. W., & Allamandola, L. J. 2002, Nature, 416, 401
- Bisschop et al. (2007) Bisschop, S. E., Jørgensen, J. K., van Dishoeck, E. F., & de Wachter, E. B. M. 2007, A&A, 465, 913
- Boogert et al. (2011) Boogert, A. C. A., Huard, T. L., Cook, A. M., et al. 2011, ApJ, 729, 92
- Boogert et al. (2008) Boogert, A. C. A., Pontoppidan, K. M., Knez, C., et al. 2008, ApJ, 678, 985
- Bottinelli et al. (2010) Bottinelli, S., Boogert, A. C. A., Bouwman, J., et al. 2010, ApJ, 718, 1100
- Bottinelli et al. (2007) Bottinelli, S., Ceccarelli, C., Williams, J. P., & Lefloch, B. 2007, A&A, 463, 601
- Brown & Bolina (2007) Brown, W. A. & Bolina, A. S. 2007, MNRAS, 374, 1006
- Caselli et al. (2012) Caselli, P., Keto, E., Bergin, E. A., et al. 2012, ApJ, 759, L37
- Ceccarelli et al. (2000) Ceccarelli, C., Loinard, L., Castets, A., Tielens, A. G. G. M., & Caux, E. 2000, A&A, 357, L9
- Cernicharo et al. (2012) Cernicharo, J., Marcelino, N., Roueff, E., et al. 2012, ApJ, 759, L43
- Codella et al. (2012) Codella, C., Ceccarelli, C., Lefloch, B., et al. 2012, ApJ, 757, L9
- Cuppen et al. (2009) Cuppen, H. M., van Dishoeck, E. F., Herbst, E., & Tielens, A. G. G. M. 2009, A&A, 508, 275
- Draine (1978) Draine, B. T. 1978, ApJS, 36, 595
- Faure et al. (2004) Faure, A., Gorfinkiel, J. D., & Tennyson, J. 2004, MNRAS, 347, 323
- Fuchs et al. (2009) Fuchs, G. W., Cuppen, H. M., Ioppolo, S., et al. 2009, A&A, 505, 629
- Garrod et al. (2006) Garrod, R., Park, I. H., Caselli, P., & Herbst, E. 2006, Faraday Discussions, 133, 51
- Garrod et al. (2008) Garrod, R. T., Weaver, S. L. W., & Herbst, E. 2008, ApJ, 682, 283
- Geppert et al. (2006) Geppert, W. D., Hamberg, M., Thomas, R. D., et al. 2006, Faraday Discussions, 133, 177
- Gerin et al. (2009) Gerin, M., Goicoechea, J. R., Pety, J., & Hily-Blant, P. 2009, A&A, 494, 977
- Gibb et al. (2004) Gibb, E. L., Whittet, D. C. B., Boogert, A. C. A., & Tielens, A. G. G. M. 2004, ApJS, 151, 35
- Gibb et al. (2000) Gibb, E. L., Whittet, D. C. B., Schutte, W. A., et al. 2000, ApJ, 536, 347
- Goicoechea et al. (2009a) Goicoechea, J. R., Compiègne, M., & Habart, E. 2009a, ApJ, 699, L165
- Goicoechea et al. (2009b) Goicoechea, J. R., Pety, J., Gerin, M., Hily-Blant, P., & Le Bourlot, J. 2009b, A&A, 498, 771
- Goicoechea et al. (2006) Goicoechea, J. R., Pety, J., Gerin, M., et al. 2006, A&A, 456, 565
- Gratier et al. (2013) Gratier, P., Pety, J., Guzmán, V., et al. 2013, ArXiv e-prints
- Green et al. (2009) Green, S. D., Bolina, A. S., Chen, R., et al. 2009, MNRAS, 398, 357
- Guzmán et al. (2011) Guzmán, V., Pety, J., Goicoechea, J. R., Gerin, M., & Roueff, E. 2011, A&A, 534, A49
- Habart et al. (2005) Habart, E., Abergel, A., Walmsley, C. M., Teyssier, D., & Pety, J. 2005, A&A, 437, 177
- Hily-Blant et al. (2005) Hily-Blant, P., Teyssier, D., Philipp, S., & Güsten, R. 2005, A&A, 440, 909
- Itikawa (1971) Itikawa, Y. 1971, Journal of the Physical Society of Japan, 30, 835
- Jørgensen et al. (2005) Jørgensen, J. K., Schöier, F. L., & van Dishoeck, E. F. 2005, A&A, 437, 501
- Le Petit et al. (2006) Le Petit, F., Nehmé, C., Le Bourlot, J., & Roueff, E. 2006, ApJS, 164, 506
- Leurini et al. (2010) Leurini, S., Parise, B., Schilke, P., Pety, J., & Rolffs, R. 2010, A&A, 511, 82
- Leurini et al. (2004) Leurini, S., Schilke, P., Menten, K. M., et al. 2004, A&A, 422, 573
- Liszt et al. (2006) Liszt, H. S., Lucas, R., & Pety, J. 2006, A&A, 448, 253
- Liszt et al. (2008) Liszt, H. S., Pety, J., & Lucas, R. 2008, A&A, 486, 493
- Mangum et al. (2013) Mangum, J. G., Darling, J., Henkel, C., & Menten, K. M. 2013, ApJ, 766, 108
- Mangum & Wootten (1993) Mangum, J. G. & Wootten, A. 1993, ApJS, 89, 123
- Maret et al. (2004) Maret, S., Ceccarelli, C., Caux, E., et al. 2004, A&A, 416, 577
- Maret et al. (2005) Maret, S., Ceccarelli, C., Tielens, A. G. G. M., et al. 2005, A&A, 442, 527
- Muñoz Caro et al. (2010) Muñoz Caro, G. M., Jiménez-Escobar, A., Martín-Gago, J. Á., et al. 2010, A&A, 522, 108
- Muñoz Caro et al. (2002) Muñoz Caro, G. M., Meierhenrich, U. J., Schutte, W. A., et al. 2002, Nature, 416, 403
- Müller et al. (2001) Müller, H. S. P., Thorwirth, S., Roth, D. A., & Winnewisser, G. 2001, A&A, 370, L49
- Öberg et al. (2008) Öberg, K. I., Boogert, A. C. A., Pontoppidan, K. M., et al. 2008, ApJ, 678, 1032
- Öberg et al. (2011) Öberg, K. I., Boogert, A. C. A., Pontoppidan, K. M., et al. 2011, ApJ, 740, 109
- Öberg et al. (2007) Öberg, K. I., Fuchs, G. W., Awad, Z., et al. 2007, ApJ, 662, L23
- Öberg et al. (2009a) Öberg, K. I., Garrod, R. T., van Dishoeck, E. F., & Linnartz, H. 2009a, A&A, 504, 891
- Öberg et al. (2009b) Öberg, K. I., Linnartz, H., Visser, R., & van Dishoeck, E. F. 2009b, ApJ, 693, 1209
- Öberg et al. (2009c) Öberg, K. I., van Dishoeck, E. F., & Linnartz, H. 2009c, A&A, 496, 281
- Parise et al. (2004) Parise, B., Castets, A., Herbst, E., et al. 2004, A&A, 416, 159
- Parise et al. (2006) Parise, B., Ceccarelli, C., Tielens, A. G. G. M., et al. 2006, A&A, 453, 949
- Penzias & Burrus (1973) Penzias, A. A. & Burrus, C. A. 1973, ARA&A, 11, 51
- Pety (2005) Pety, J. 2005, in SF2A-2005: Semaine de l’Astrophysique Francaise, ed. F. Casoli, T. Contini, J. M. Hameury, & L. Pagani, 721
- Pety et al. (2007) Pety, J., Goicoechea, J. R., Hily-Blant, P., Gerin, M., & Teyssier, D. 2007, A&A, 464, L41
- Pety & Rodríguez-Fernández (2010) Pety, J. & Rodríguez-Fernández, N. 2010, A&A, 517, A12
- Pickett et al. (1998) Pickett, H. M., Poynter, R. L., Cohen, E. A., et al. 1998, J. Quant. Spec. Radiat. Transf., 60, 883
- Pontoppidan et al. (2008) Pontoppidan, K. M., Boogert, A. C. A., Fraser, H. J., et al. 2008, ApJ, 678, 1005
- Pound et al. (2003) Pound, M. W., Reipurth, B., & Bally, J. 2003, AJ, 125, 2108
- Rabli & Flower (2010) Rabli, D. & Flower, D. R. 2010, MNRAS, 406, 95
- Requena-Torres et al. (2006) Requena-Torres, M. A., Martín-Pintado, J., Rodríguez-Franco, A., et al. 2006, A&A, 455, 971
- Rodriguez-Fernandez et al. (2008) Rodriguez-Fernandez, N., Pety, J., & Gueth, F. 2008, Single-dish observation and processing to produce the short-spacing information for a millimeter interferometer, Tech. rep., IRAM Memo 2008-2
- Sakai et al. (2012) Sakai, N., Ceccarelli, C., Bottinelli, S., Sakai, T., & Yamamoto, S. 2012, ApJ, 754, 70
- Sutton et al. (1995) Sutton, E. C., Peng, R., Danchi, W. C., et al. 1995, ApJS, 97, 455
- Tafalla et al. (2010) Tafalla, M., Santiago-García, J., Hacar, A., & Bachiller, R. 2010, A&A, 522, A91
- Tafalla et al. (2006) Tafalla, M., Santiago-García, J., Myers, P. C., et al. 2006, A&A, 455, 577
- Tielens & Allamandola (1987) Tielens, A. G. G. M. & Allamandola, L. J. 1987, in Astrophysics and Space Science Library, Vol. 134, Interstellar Processes, ed. D. J. Hollenbach & H. A. Thronson, Jr., 397–469
- Tielens & Whittet (1997) Tielens, A. G. G. M. & Whittet, D. C. B. 1997, in IAU Symposium, Vol. 178, IAU Symposium, ed. E. F. van Dishoeck, 45
- van der Tak et al. (2007) van der Tak, F. F. S., Black, J. H., Schöier, F. L., Jansen, D. J., & van Dishoeck, E. F. 2007, A&A, 468, 627
- Vinodkumar et al. (2013) Vinodkumar, M., Limbachiya, C., Barot, A., & Mason, N. 2013, Phys. Rev. A, 87, 012702
- Watanabe & Kouchi (2002) Watanabe, N. & Kouchi, A. 2002, ApJ, 571, L173
- Watanabe et al. (2004) Watanabe, N., Nagaoka, A., Shiraki, T., & Kouchi, A. 2004, ApJ, 616, 638