NUSTAR OBSERVATIONS OF MAGNETAR 1E 1841045
Abstract
We report new spectral and temporal observations of the magnetar 1E 1841045 in the Kes 73 supernova remnant obtained with the Nuclear Spectroscopic Telescope Array (NuSTAR). Combined with new Swift and archival XMM-Newton and Chandra observations, the phase-averaged spectrum is well characterized by a blackbody plus double power-law model, in agreement with previous, multi-mission X-ray results. However, we are unable to reproduce the spectral results reported using Suzaku observations. The pulsed fraction of the source is found to increase with photon energy. The measured rms pulsed fraction is 12% and 17% at 20 keV and 50 keV, respectively. We detect a new feature in the 24–35 keV band pulse profile that is uniquely double-peaked. This feature may be associated with a possible absorption or emission feature in the phase-resolved spectrum. We fit the X-ray data using the recently developed electron-positron outflow model of Beloborodov (2013) for the hard X-ray emission from magnetars. This produces a satisfactory fit allowing a constraint on the angle between the rotation and magnetic axes of the neutron star of 20∘ and on the angle between the rotation axis and line-of-sight of 50∘. In this model, the soft X-ray component is inconsistent with a single blackbody; adding a second blackbody or a power-law component fits the data. The two-blackbody interpretation suggests a hot spot of temperature keV occupying 1% of the stellar surface.
Subject headings:
pulsars: individual (1E 1841045) – stars: magnetars – stars: neutron1. Introduction
Magnetars are isolated neutron stars whose X-ray luminosities are
thought to be powered by the decay of their intense magnetic fields
(Duncan & Thompson, 1992; Thompson & Duncan, 1996).
They are observed as pulsating X-ray sources occasionally producing bright
bursts on timescales
as short as 10 ms, as well as major enhancements in the persistent emission lasting days to months
(see Woods & Thompson, 2006; Mereghetti, 2008; Rea & Esposito, 2011, for reviews).
Magnetic fields inferred from magnetar spin-down rates
in many cases exceed (e.g., 1E 1841045, SGR 180620; Vasisht & Gotthelf, 1997; Kouveliotou et al., 1998),
although weaker fields are suggested by recent observations of several magnetars
(e.g., SGR 04185729, Swift J1822.31606; Rea et al., 2010; Livingstone et al., 2011; Rea et al., 2012; Scholz et al., 2012). There are
26 magnetars discovered to date, including
candidates (see Olausen & Kaspi, 2013).111See the online magnetar catalog for a compilation
of known magnetar properties, http://www.physics.mcgill.ca/pulsar/mag
netar/main.html
The X-ray spectra of magnetars often require two or more components. The soft X-ray component (which has peak at 1 keV) is thought to be dominated by the surface emission from the neutron star and is likely modified by resonant scattering in the magnetosphere (Thompson et al., 2002). It may be fitted by an absorbed blackbody plus power law or sometimes by a two-blackbody model. The hard X-ray component (which peaks in a spectral representation above 100 keV; Kuiper et al., 2006; Enoto et al., 2010) is believed to be generated in the magnetosphere. Its origin has been discussed by several authors (Thompson & Beloborodov, 2005; Heyl & Hernquist, 2005; Baring & Harding, 2007; Beloborodov & Thompson, 2007). Recently, Beloborodov (2013) proposed a detailed model of hard X-ray emission from the relativistic outflow created by discharge near the neutron star.
The Galactic magnetar 1E 1841045 is located at the center of the shell-type X-ray and radio supernova remnant Kes 73, and was first identified as an anomalous X-ray pulsar by Vasisht & Gotthelf (1997). Its slow 11.8-s spin period and rapid spin-down rate imply an extreme magnetic field of , assuming the dipole spin-down model. Hard X-ray emission from 1E 1841045/Kes 73 was detected by Molkov et al. (2004), and reported to be highly pulsed (Kuiper et al., 2004, 2006), approaching 100% from 15–200 keV. Spectral studies by these authors measured a hard power-law photon index of 1.3 in the 20–300 keV band using RXTE and INTEGRAL. However, Morii et al. (2010) modeled the spectrum obtained with Suzaku with an absorbed blackbody plus two-power-law model and found results only marginally consistent with the Kuiper et al. (2006) results.
In this paper, we report on the spectral and temporal properties of 1E 1841045 in the 0.5–79 keV band, measured with NuSTAR, the Swift X-ray Telescope (XRT), XMM-Newton, and Chandra. In Section 2, we describe the observations used in this paper and in Section 3, we present the results of our data analysis. In Section 3.4, we apply the model of Beloborodov (2013) to our measurements of the hard X-ray emission from 1E 1841045. We show that our spectral fitting yields results consistent with the expectations of the Beloborodov (2013) model. Section 4 presents our discussion and conclusions. These are summarized in Section 5.
| Observatory | Obs. ID | Obs. Date | Exposure | Modeaafootnotemark: |
|---|---|---|---|---|
| (MJD) | (ks) | |||
| Chandrabbfootnotemark: | 730 | 51754 | 10.5 | CC |
| XMM-Newton | 0013340101 | 52552 | 3.9 | FW/LW |
| XMM-Newton | 0013340102 | 52554 | 4.4 | FW/LW |
| Chandraccfootnotemark: | 6732 | 53946 | 24.9 | TE |
| Swift | 00080220003 | 56240 | 17.9 | PC |
| NuSTAR | 30001025002 | 56240 | 48.6 |
aPC: Photon Counting, TE: Timed Exposure, FW: Full Window, LW: Large Window, CC: Continuous Clocking.
MOS1,2/PN for XMM-Newton.
bUsed only for 1E 1841045.
cUsed only for Kes 73 because of pile-up.
2. Observations
NuSTAR is the first satellite mission that has focusing capability above 10 keV (Harrison et al., 2013). It is composed of two focusing optics (Hailey et al., 2010) and two CdZnTe focal plane modules (Harrison et al., 2010, each focal plane module has four detectors), where we use the terms “module A” and “module B” when referring to individual optics/focal plane detector sets. The observatory operates in the 3–79 keV band with FWHM energy resolution of 400 eV at 10 keV, angular resolution of 58′′ (HPD, 18′′ FWHM), and temporal resolution of 2 s (see Harrison et al., 2013, for more details).
We began observing 1E 1841045 with NuSTAR on 2012 November 9 at UT 22:00:02.184 with a total net exposure of 48.6 ks. Although NuSTAR is extremely sensitive in the hard X-ray band, a simultaneous 18-ks Swift XRT observation (PC mode) was conducted at UT 21:49:38.742 on 2012 November 9 to extend the spectral coverage down to 0.5 keV where the thermal component is dominant. A bright point source and extended emission out to 2′ in radius were clearly detected at a position consistent with that of 1E 1841045/Kes 73 (see Fig. 1).
 |
The NuSTAR data were processed with nupipeline 1.1.1 along with CALDB version 20130509,
and the Swift data with xrtpipeline along with the HEASARC
remote CALDB222http://heasarc.nasa.gov/docs/heasarc/caldb/caldb_remote_acc
ess.html
using the standard filtering procedure (Capalbi et al., 2005) to produce cleaned event files.
We then further processed the cleaned event files for analysis as described below.
We also analyzed archival Chandra and XMM-Newton observations to have better spectral
sensitivity at low energies ( keV).
The Chandra data were re-processed
using chandra_repro of CIAO 4.4 along with CALDB 4.5.3, and the XMM-Newton data
were processed with Science Analysis System (SAS) 12.0.1. See Table 1 for a
summary of all the observations on which we report.
3. Data Analysis and Results

|

|

|

|

|

|
 |
3.1. Timing Analysis
We extracted source events in the 3–79 keV and 0.5–10 keV band within circular regions with radii 60′′ and 20′′ for NuSTAR and Swift, respectively, and applied a barycentric correction to the event lists using the barycorr tool with the orbit files and the clock correction files using the position reported by Wachter et al. (2004). We then used the -test (de Jager et al., 1989) to search for pulsations and to measure the period. Pulsations were detected with very high significance, and the best measured periods () were 11.79130(2) s and 11.7914(2) s for NuSTAR and Swift, respectively. The uncertainties were estimated using the method given by Ransom et al. (2002). The periods we measured are consistent with those predicted on the basis of the ephemeris obtained with the Swift monitoring program that will be described elsewhere (Archibald, R. et al. in preparation).
Since we are measuring properties of 1E 1841045, the Kes 73 background must be subtracted; to do this optimally, the background region should be within the remnant which is extended out to 120′′ in radius from the neutron star. Extracting backgrounds from a magnetar-free region within Kes 73 was straightforward in the Swift data thanks to the XRT’s good angular resolution; the backgrounds were extracted from an annular region with inner radius 60′′ and outer radius 85′′. However, extracting backgrounds was not easy for the NuSTAR data since the PSF is broad, and finding a source-free region within the remnant was not possible. Therefore, we extracted the background with inner and outer radii 60′′ and 100′′, respectively, and then corrected for the source contamination in the background region (see Wang & Gotthelf, 1998). The correction factor was calculated with NuSTAR’s measured instrumental PSF and estimated to be 10% (Harrison et al., 2013).
We also analyzed archival Chandra and XMM-Newton observations. For the XMM-Newton and Chandra data, source events were extracted from a circle with radius 16′′ and a rectangle with 3 (CC mode, 3′′ along the event distribution), respectively. XMM-Newton backgrounds were extracted from events within an annular region with inner radius 48′′ and outer radius 80′′ centered at the source region, and Chandra backgrounds were extracted from two rectangular regions with 5 offset 5′′ to each side from the source. We then applied barycentric corrections to all the event lists for temporal analysis below.
We folded the source event time series at the best measured period to produce pulse profiles for multiple energy bands. The background level was subtracted from these pulse profiles. The background-subtracted pulse profiles obtained with NuSTAR are plotted in Figure 2. The energy bands were chosen to enable comparison with those reported by Kuiper et al. (2004). For each energy band, the significance of pulsation was greater than 99%.
The pulse profiles in Figure 2 qualitatively agree well with those reported by Kuiper et al. (2004). However, we see a double-peaked pulse profile in NuSTAR’s 24–35 keV band. The profile in this band has not been previously reported. To see if the apparent double peak occurred by chance due to binning effects, we tried 250 different binnings by varying the zero phase. For each trial binning, we fit the profile to two Gaussian functions, and measured the significance of each peak. In all 250 cases, the significance was greater than 3 for both peaks. Moreover, the two peaks do not disappear when the energy range was adjusted slightly (e.g., 25–40 keV). Therefore, we conclude that the two peaks are genuine features in the light curve in this energy band.
In order to better constrain the transition energies of the feature, we produced pulsed profiles for smaller energy bins (2 keV). The double-peaked structure is visible to the eye from 26 keV to 34 keV although the structure seen in these individual profiles may not be statistically significant.
|
 |
We calculated the rms pulsed fraction defined by
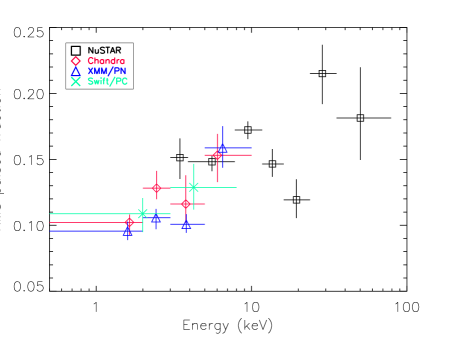
where , is the uncertainty in , , is the uncertainty in , is the number of counts in th bin, is the total number of bins, and is the number of Fourier harmonics included, in this case, (see Gonzalez et al., 2010, for more details). We also performed similar analyses for the XMM-Newton and Chandra data and show the measured rms pulsed fractions in Figure 3. We find that the rms pulsed fraction shows a somewhat complicated behavior with energy, and is 20% around 50 keV but overall increases with energy.
We also searched for aperiodic variability with the NuSTAR data in the energy band from 3–79 keV. In particular, we searched for bursting activity in any energy band during the observations. We produced light curves with various time resolutions (0.1–1000 s) for several energy bands (e.g., 3–79 keV, 15–79 keV, 24–35 keV). We then searched for time bins having a significantly larger than average number of events, accounting for the number of trials, but found none. Therefore, we conclude that there was no bursting activity on time scales of 0.1–1000 s during the observations.
| Phase | Dataaafootnotemark: | Energy | Modelbbfootnotemark: | ddfootnotemark: | fffootnotemark: | ggfootnotemark: | /dof | ||||
| (keV) | () | (keV) | (keV) | ||||||||
| 0.0–1.0 | S | 0.5–10 | BB+PL | 2.23(25) | 0.46(5) | 1.76(39) | 1.73(19) | 1.58(29) | 177/182 | ||
| 0.0–1.0 | X,C | 0.5–10 | BB+PL | 2.26(5) | 0.42(1) | 2.07(7) | 1.74(5) | 1.61(8) | 1866/1849 | ||
| 0.0–1.0 | N,S,X,C | 0.5–79 | BB+BP | 2.24(4) | 0.44(1) | 2.09(4) | 10.7(4) | 1.33(3) | 6.84(6) | 1.91(8) | 2440/2371 |
| 0.0–1.0 | N,S,X,C | 0.5–79 | BB+2PL | 2.58(10) | 0.42(1) | 2.96(18) | 1.55(2) | 1.06(9) | 5.70(9) | 1.24(21) | 2427/2371 |
| 0.15–0.5 | N,X,C | 0.5–79 | BB+BP | 2.24hhfootnotemark: | 0.44(1) | 1.98(4) | 12.4(9) | 1.35(6) | 7.50(7) | 2.34(11) | 819/797 |
| 0.5–0.8 | N,X,C | 0.5–79 | BB+BP | 2.24 | 0.44(1) | 1.99(5) | 12.6(8) | 1.18(7) | 7.78(9) | 1.95(11) | 687/652 |
| 0.8–1.15 | N,X,C | 0.5–79 | BB+BP | 2.24 | 0.45(1) | 2.15(6) | 10.0(5) | 1.27(5) | 5.79(7) | 1.69(13) | 606/633 |
| 0.15–0.5 | N,X,C | 0.5–79 | BB+2PL | 2.58 | 0.42(2) | 2.99(13) | 1.68(4) | 1.19(10) | 5.87(14) | 1.51(26) | 816/797 |
| 0.5–0.8 | N,X,C | 0.5–79 | BB+2PL | 2.58 | 0.45(4) | 3.04(11) | 1.51(4) | 1.05(9) | 6.45(16) | 0.86(23) | 680/652 |
| 0.8–1.15 | N,X,C | 0.5–79 | BB+2PL | 2.58 | 0.44(2) | 2.91(11) | 1.37(4) | 0.91(11) | 4.89(14) | 1.33(22) | 607/633 |
| Pulsediifootnotemark: | X,C | 0.5–10 | PL | 2.24 | 2.40(15) | 0.43(4) | 172/299 | ||||
| Pulsed | N,X,C | 0.5–79 | PL | 2.24 | 1.98(7) | 1.31(6) | 429/640 | ||||
| Pulsed | N | 5–79 | PL | 2.24 | 1.70(12) | 1.58(15) | 163/238 | ||||
| Pulsed | N | 10–79 | PL | 2.24 | 1.36(23) | 1.72(22) | 79/114 | ||||
| Pulsed | N | 15–79 | PL | 2.24 | 0.99(36) | 1.76(27) | 45/64 |
Notes. Uncertainties are at the confidence level. When combining data from different observatories, cross-normalization
factors were used. The cross-normalization factors was set to 0.9 for module A of NuSTAR (see text),
or 1 for XMM-Newton if NuSTAR data were not included. Fluxes were absorption-corrected and measured using the cflux model in
XSPEC.
a N: NuSTAR, S: Swift, X: XMM-Newton, C: Chandra.
b BB: Blackbody, PL: Power law, BP: Broken power law.
c Photon index for the soft power-law component.
d Break energy for the broken power-law (BB+BP) fit or soft power-law flux (BB+2PL)
in the 3–79 keV band if NuSTAR data were included. Otherwise, power-law flux in the 2–10 keV band in units of
erg cm2 s1.
e Photon index for the hard power-law component.
f Flux in units of erg cm2 s1.
The values are only the power-law (hard power-law) flux in the 3–79 keV band for the BP (PL, 2PL) model
when the NuSTAR data are included, otherwise power-law flux in the 2–10 keV band.
g Blackbody luminosity in units of for an assumed distance of 8.5 kpc.
h for the phase-resolved and pulsed spectral analysis was frozen.
i lstat in XSPEC was used for fitting pulsed spectra, and we report L-Statistic/dof
instead of /dof.
3.2. Phase-Averaged Spectral Analysis
We extracted the source and the background events using the same regions defined in Section 3.1. To see if the Swift observation was piled-up, we measured the count rate within a circle of radius 20 pixels (47′′).333http://www.swift.ac.uk/analysis/xrt/pileup.php The count rate was 0.4. Although the count rate was not large enough to produce pile-up, we verified by removing the bright core (2–4′′ in radius) and found that there was no significant spectral change and thus no pile-up. We also analyzed archival Chandra and XMM-Newton observations in order to see if there is long-term spectral variability in the soft band and to combine them with the NuSTAR observation to have better spectral sensitivity in the soft band.
We first fit the Swift data alone to see if there was any spectral change in the soft band (0.5–10 keV) since the last Chandra or XMM-Newton measurements were made 12 years ago (e.g., Morii et al., 2003). We grouped the spectrum to have at least 20 counts per bin for the fit. We first fit the data with an absorbed blackbody plus power-law model to compare with the archival XMM-Newton and Chandra data. The spectrum is a little harder than, but consistent with previous results (Morii et al., 2003) as well as with our reanalysis of XMM-NewtonChandra data (see Table 2). We also tried to fit the Swift data with the same model using the best-fit parameters obtained from modelling of the XMM-Newton and Chandra data, and found that the Swift spectrum is consistent with the model. Therefore, all four observations can be combined with the NuSTAR observation, and we report fit results for the combined data. Note that for the blackbody luminosities reported in Table 2, we assumed a distance of 8.5 kpc based on H I absorption measurements of Tian & Leahy (2008).
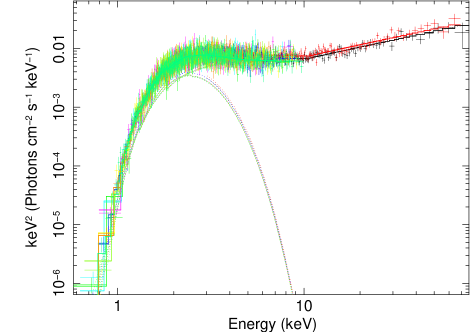
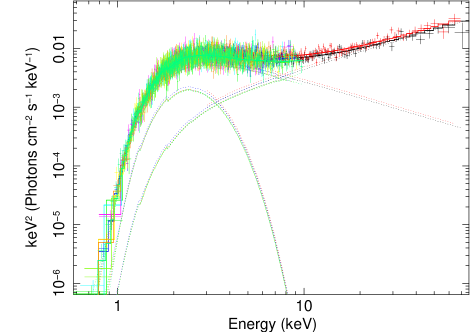
We then tied all the model parameters between NuSTAR, Swift, XMM-Newton, and Chandra except for the cross-normalization factors (set to 0.9 for NuSTAR; the PSF correction factor) to fit the broadband spectrum (0.5–79 keV). To fit the data, we grouped the spectra to have at least 100 and 20 counts per bin for NuSTAR and the soft-band instruments (Swift, XMM-Newton, and Chandra), respectively. We tried to fit the data simultaneously with a blackbody plus power-law model. In fitting, we used the 0.5–10 keV and the 3–79 keV data for the soft-band instruments and NuSTAR, respectively. The model is unacceptable (/dof=2634/2373), and adding one more component improves the fit significantly. Therefore, we fit the data to an absorbed blackbody plus broken power-law, tbabs*(bbody + bknpow), or an absorbed blackbody plus two power laws, tbabs*(bbody+pow+pow) in XSPEC 12.7.1. The former is to be compared with results of Kuiper et al. (2006) and the latter with those of Morii et al. (2010). We note that the blackbody component was required in both models. We show the spectra in Figure 4 and summarize the results in Table 2.
We studied the effects of nonuniformity in the Kes 73 supernova remnant (SNR) background because the fit results may change depending on the background region used. For NuSTAR, which operates in the 3–79 keV band with a relatively broad PSF, effects of the thermal SNR and its spatial variation are likely to be very small. For other soft-band observatories, we first estimated the background to source count rates to be 15%, 6% and 5% for the Swift, XMM-Newton and Chandra data. Although variations on small background levels would not affect the spectral fit results much, the background level in the Swift data was relatively high, which may be a concern. Therefore, we used various background regions in the SNR for the spectral fits of the Swift and XMM-Newton data. As expected from the count rate estimates, Swift results fluctuate slightly (20–40% of the statistical uncertainties) depending on the background region used, but XMM-Newton results were more stable (6–20% of the statistical uncertainties). We then used the various Swift and XMM-Newton backgrounds for the joint fit of the NuSTAR, Swift, XMM-Newton and Chandra data, and found that the spectral variations caused by different backgrounds were typically % of the statistical uncertainties.
We find that our best-fit parameters for the absorbed blackbody plus two power-law model do not agree with those of Morii et al. (2010). We checked if the spectral model of Morii et al. (2010) is consistent with the NuSTAR, Swift, XMM-Newton, and Chandra data. We found that the Morii et al. (2010) best-fit parameters do not describe our data. The null hypothesis probability was (/dof=2601/2375) with a clear trend in the residuals at high energies ( 15 keV). We then varied their best parameters for the absorbed blackbody plus two power-law model (=2.836–2.896, =0.496–0.576 keV, =4.39–5.59, =1.42–1.82) within the uncertainties (defined as direct sum of the statistical and systematic uncertainties to maximize the parameter space) using the steppar command of XSPEC to see if we could find a set of parameters that is consistent with the data. The minimum /dof was 2530/2375, implying a null hypothesis probability of 0.01, and some of the best-fit parameters hit the limit, making the probability lower. We then limited the fit to the 0.5–60 keV range similar to the Suzaku data and still found that the Morii et al. (2010) best-fit parameters are inconsistent with our data. We therefore conclude that the X-ray spectrum of 1E 1841045 we measured cannot be explained with the spectral model reported by Morii et al. (2010).
3.3. Phase-Resolved and Pulsed Spectral Analyses
We conducted a phase-resolved spectral analysis for three phase intervals, 0.15–0.5, 0.5–0.8, and 0.8–1.15 to catch distinct features in the pulse profiles (see Fig. 2 for pulse profiles). The temporal resolutions Swift XRT and XMM-Newton MOS are comparable to the phase intervals we use here, and spectral mixing between different phases will occur, blurring the spectral differences among the phase intervals. Therefore, we ignored the Swift and XMM-Newton MOS data for the phase-resolved and pulsed spectral analysis below.
We binned the NuSTAR and the soft-band instruments’ spectra to have at least 50 and 20 counts per spectral bin, respectively, and froze the cross normalizations to those obtained with the phase-averaged spectral fit. We fit the spectra with two models: an absorbed blackbody plus broken power-law and an absorbed blackbody plus double power-law model. We find that the spectra vary with spin phase, and the detailed variation depends on the spectral model used. We report the results in Table 2.
We also fit the pulsed spectrum after subtracting the unpulsed spectrum extracted in the phase interval 0.9–1.1. The Chandra and the XMM-Newton PN data were phase-aligned with the NuSTAR data by correlating the light curves. Since the number of pulsed source counts per spectral bin was small, we used lstat because the usual method may bias the results. We then froze the cross normalizations between instruments to the values obtained with the phase-averaged spectral fits.
There are not many events in the pulsed spectra, and a simple power-law model can not be ruled out. However, we see rising trends in the residuals in the soft band ( 2 keV) and hard band ( 10 keV). Also motivated by the very hard power-law component (0.7) in the pulsed spectrum in the high energy band (15–200 keV) reported by Kuiper et al. (2006), we gradually removed the soft bands from the spectral fit to see if the spectrum becomes very hard above 15 keV, and found that indeed it does. We also tried to fit the data using alternative statistical methods (e.g., usual method or cstat in XSPEC), and found that the alternative methods gave similar results except for the fit in the 0.5–79 keV band, where results were significantly different from the others. The results are summarized in Table 2.
We also measured spectral pulsed fractions in the hard band (defined as the ratio of pulsed and total spectra) in order to compare to those reported by Kuiper et al. (2006). We first fit the total ( 11 keV) and the pulsed spectra ( 15 keV) to single power-law models. The total spectrum above 11 keV is consistent with what we obtained using the absorbed blackbody plus broken power-law model (see Table 2). We then calculated the flux density ratio (which we refer to as “spectral” pulsed fraction), and find it to be % (%) at 20 keV (80 keV). The uncertainties were estimated by simulating both pulsed and total spectra using the covariance matrices obtained during the spectral fitting. Using 10,000 simulations, we calculated the flux density ratios and the standard deviation to obtain the uncertainties.
Finally, we investigated the spectral properties of the double-peaked pulse profile in the 24–35 keV band (see Fig. 2). With the double-peaked structure decidedly significant (see Section 3.1), we searched for evidence for this structure in the spectra. We detect a possible excess (deficit) of counts at 30 keV in the spectrum in the phase bin 0.525–0.725 (0.325–0.525), but not in the spectra of the other phases. However, the continuum model alone is statistically acceptable and the existence of an emission- or absorption-like feature cannot be clearly demonstrated with the present data.
3.4. Spectral fits with the outflow model
Next, we tested a new model proposed by Beloborodov (2013) to explain the hard X-ray emission from magnetars. The model envisions an outflow of relativistic electron-positron pairs created by pair discharge near the neutron star. The outflow moves along the magnetic field lines and gradually decelerates as it (resonantly) scatters the thermal X-rays. Its Lorentz factor decreases proportionally to the local magnetic field ,
| (1) |
where G. This deceleration determines the emitted spectrum of resonantly scattered photons. The outflow fills the active “j-bundle” (an extended bundle of electric currents) of closed magnetospheric field lines (Beloborodov, 2009). It radiates most of its kinetic energy in hard X-rays before the pairs reach the top of the magnetic loop and annihilate.
In a simple geometry, the j-bundle is axisymmetric and emerges from the polar cap around the magnetic dipole axis of the star. In this case, the model has the following parameters: (1) the angular size of the polar cap, , (2) the power of the outflow along the j-bundle, , (3) the magnetic dipole moment of the star, , (4) the angle between the rotation axis and the magnetic axis, , (5) the angle between the rotation axis and the observer line of sight, , and (6) the reference point of the rotational phase, . See Beloborodov (2013) for more details.
To test the model against data, we designed the following two-step method (Hascoët, R. et al., in preparation). First, we explore the entire parameter space by fitting the phase-averaged total (pulsed+unpulsed) spectrum and the phase-resolved pulsed spectra. At this step, we only consider data above 10 keV, where the outflow dominates the observed radiation. For 1E 1841045 we used three phase bins for the phase-resolved spectra (Section 3.3). We found that the model successfully fits the data, with the best-fit (for 267 dof); the obtained parameters of the model are given in Table 3. For the best-fit model, the spectrum () peaks at 7 MeV. We also found a marginally acceptable ( confidence) second minimum ( for 267 dof). Both acceptable regions are well localized in the parameter space, and we show both solutions in Table 3.
At the second step, we freeze the best-fit parameters of the outflow model and fit the spectrum in the 0.5–79 keV band, using the NuSTAR, Swift, Chandra and XMM-Newton data. This allows us to analyze possible models for the soft X-ray component. We found that the data exclude the single-blackbody model. On the other hand, the data are well fitted by a blackbody plus power-law or by a two-blackbody model. The results are summarized in Table 4. Note that the outflow model spectrum extends down to low energies, and thus the soft-band spectral parameters are different from those obtained using the phenomenological models (see Table 2).
| Solution | aafootnotemark: | bbfootnotemark: | |||
|---|---|---|---|---|---|
| (rad) | (rad) | (rad) | |||
| 1 | 0.3(2) | 0.9(2) | 5(1) | ||
| 2 | 0.7(2) | 1.4(1) | 5(1) |
aOutflow power in units of .
bMagnetic dipole moment in units of .
4. Discussion
We have reported on X-ray observations of the magnetar 1E 1841045, most notably on its high-energy X-ray properties as observed by NuSTAR. We find that the pulse profile in the 24–35 keV band shows a double-peaked structure, which has not previously been reported. We also find that the rms pulsed fraction of the source is 20% at 50 keV. We show that the phase-averaged total spectrum of 1E 1841045 can be modeled with an absorbed blackbody plus broken power-law or an absorbed blackbody plus two power-law model. Finally, we constrain the geometry of the source by fitting the phase-averaged and the phase-resolved spectra with the electron-positron outflow model of Beloborodov (2013).
4.1. Pulse Profile
The pulse profiles measured with NuSTAR broadly agree with those previously measured with RXTE (Kuiper et al., 2004). However, we note some differences. In the 7.8–11.7 keV band, the previously measured profile had a flat top, from which Kuiper et al. (2004) suggested that the dominance of the two pulses (one at phase 0.3 and the other at 0.7) changes at 9 keV. In the NuSTAR observation, the flattening occurred at 11.7–16.1 keV, implying the change occurred at 11 keV, similar to the location of the spectral break (see Table 2). Temporally measuring the exact energy over which the flattening occurs was difficult, and the difference between 9 keV and 11 keV may be marginal.
| Modelaafootnotemark: | bbfootnotemark: | ccfootnotemark: | ddfootnotemark: | ddfootnotemark: | /dof | |||
|---|---|---|---|---|---|---|---|---|
| () | (keV) | (keV) | ||||||
| BB+PL | 2.90(8) | 0.55(2) | 3.79(11) | 0.55(4) | 1.08(10) | 2316/2272 | ||
| BB+BB | 2.03(4) | 0.45(1) | 0.90(4) | 2.15(7) | 0.65(9) | 2298/2272 | ||
| BB | 1.72(2) | 0.57(1) | 2.15(4) | 2556/2274 |
a BB: Blackbody, PL: Power law.
b Photon index for the power-law component.
c Absorption-corrected flux of the power law in units of erg cm2 s1, in the 3–79 keV band.
d Blackbody luminosity in units of for an assumed distance of 8.5 kpc.
We found a double-peaked structure in the 24–35 keV band. It is not unusual for a magnetar’s pulse profiles to change with energy. For example, den Hartog et al. (2008a) and den Hartog et al. (2008b) showed that the pulse profiles of two magnetars, AXP 1RXS J170849400910 and AXP 4U 014261, change with energy. Furthermore, the two magnetars have separate peaks in their pulse profiles that correspond to the soft- and hard-band emission, respectively. It seems that the soft-emission peak leads the hard one in phase at least for those two magnetars (when considering the pulse minimum as phase 0). Although we could not clearly identify a hard peak at higher energies for 1E 1841045, the peak at phase 0.6 in the 24–35 keV band may be its counterpart; our phase-resolved spectral analysis suggests this (see Table 2). If this is correct, 1E 1841045 behaves similarly to AXP 1RXS J170849400910 and AXP 4U 014261; the soft-emission peak leads the hard one (see also Göğüş et al., 2010, for SGR 05014516). It will be interesting to see if this trend is common in other magnetars.
The pulsed fraction of the source is known to increase with energy (Kuiper et al., 2006; Morii et al., 2010) and we confirm this (see Fig. 3). Furthermore, Kuiper et al. (2006) reported that the pulsed fraction of 1E 1841045 is 25% at 20 keV, and 100% above 100 keV. Note that our measured rms pulsed fractions are shown in Figure 3, but cannot be directly compared to those reported by Kuiper et al. (2006) because they reported a spectral pulsed fraction. Therefore, we calculated the spectral pulsed fraction (Section 3.3) for the comparison. We found that the spectral pulsed fractions are % at 20 keV, and % at 80 keV. While they may be consistent with those of Kuiper et al. (2006), they may agree better with a reanalysis of the RXTE and INTEGRAL data including more exposure (Kuiper, Hermsen, & Beek, in preparation).
4.2. Spectrum
We found that the spectral parameters of Morii et al. (2010) are inconsistent with those we obtained using the NuSTAR, Swift, XMM-Newton, and Chandra data. It is possible that the discrepancy between our results and those found using Suzaku is due to spectral variability in the source. However, the source is known to be fairly stable, at least in the soft band (Zhu et al., 2010; Lin et al., 2011; Dib & Kaspi, 2013). Morii et al. (2010) noted that the point spread function of Suzaku is broad (HPD=2′), and it was difficult to subtract the Kes 73 background. Indeed, they used an SNR model obtained with Chandra to estimate the Kes 73 background instead of directly subtracting a measured background. This may pose a problem in the soft band because the Chandra SNR model fit was not very good, as previously noted by Zhu et al. (2010); residuals in the Kes 73 model fit would be attributed to 1E 1841045 spectrum. We independently checked if the Kes 73 model (vsedov used by Morii et al., 2010) fit the Chandra and XMM-Newton data well, and found that reduced values for the model were 1.3–2.3, leaving significant residuals after the fit. Moreover, the number of SNR background events is estimated to be 70% larger than that of the source events for a circle of radius 110′′ in the XMM-Newton data. Therefore, any residuals in the Kes 73 model fits will be amplified unless the source extraction region was small, which Morii et al. (2010) could not do because of the large HPD of Suzaku. Furthermore, difficulty in subtracting the high energy background (e.g., Galactic ridge emission and CXB) in the Suzaku/HXD data could have made their analysis inaccurate.
Morii et al. (2010) argued that the residuals are present only at the Kes 73 emission lines and did not affect the continuum model of the point source. It is not clear if the residuals are really only at the emission lines (for example, see their Fig. 2) and even if so, it is not clear that they do not affect the results for such a complicated point source spectral model.
Both BB+BP and BB+2PL models are phenomenological, and we use them mainly for comparison with previous data analyses. Although both provide a good fit to our data, a BB+BP model is more consistent with observations above 80 keV by Kuiper et al. (2006). Note that our analysis results support the anti-correlation between and reported by Kaspi & Boydstun (2010), and a correlation between hardness ratio (, ratio of hard to soft spectral component flux in the 1–60 keV band) and the characteristic age inferred from the spin-down rate by Enoto et al. (2010).
We note that the soft-band spectrum measured with Swift in 2012 November is consistent with those measured by XMM-Newton and Chandra 12 years ago. It has been suggested that the soft-band spectrum of the source has been stable over 13 years between 1993 and 2007 (Zhu et al., 2010). This is in spite of numerous spin-up glitches and bursts (Dib et al., 2008; Lin et al., 2011). Our observations support this, in agreement with the results of Dib & Kaspi (2013) which are based only on the pulsed flux.
We found a hint of a spectral excess at 30 keV in the phase interval which corresponds to the pulse peak (phase 0.6) of the 24–35 keV pulse profile (see Fig. 2). A hint of a spectral deficit was also found at the same energy, but in a different phase interval (phase 0.45). If we interpret this as a cyclotron line feature, the inferred magnetic-field strength would be 3 for electron, or 5 for proton. The magnetic-field strength for the electron cyclotron line is similar to those in the zone where the outflowing plasma radiates all its energy (Beloborodov, 2013). Although the excess and deficit might be produced by line emission, longer observations are required to demonstrate this.
With our 48-ks NuSTAR observation, the measurement of the pulsed spectrum in the hard X-ray band is not very precise. The obtained spectral slope in the 15–79 keV range is . It is consistent with observed by RXTE and INTEGRAL in the 15–200 keV range (Kuiper et al., 2006). Morii et al. (2010) reported a different index of the pulsed spectrum, . Note, however, that they used a different energy band of 0.7–25 keV, heavily weighted in the soft band ( keV), and thus more representative of the soft-band spectrum. When we limit our analysis to the 0.5–25 keV band with an value of (similar to those of Morii et al., 2010), we find , consistent with Morii et al. (2010). Although we argued above that the Suzaku spectral results might have been biased by Kes 73 contamination, the situation for the pulsed spectrum is different, because the Kes 73 spectrum is subtracted in a model-independent way when subtracting the DC component. Therefore the agreement with Suzaku results for the pulsed spectrum is unsurprising.
4.3. Outflow model
We found that the phase-resolved spectrum of 1E 1841045 is consistent with the model of Beloborodov (2013). In this model, the X-ray emission comes from the active j-bundle filled with a relativistic outflow, whose Lorentz factor decreases according to Equation (1). The best-fit physical parameters are in agreement with theoretical expectations. Specifically, the active j-bundle is constrained to emerge from a polar cap of angular size , and the outflow power is measured to be . Using Equation (48) in Beloborodov (2009), one can estimate the voltage of discharge in the magnetosphere of 1E 1841045. It gives V, where 1 radian is the magnetic twist implanted in the j-bundle, and we have used the magnetic moment of the neutron star G cm3, which was estimated from the spin-down rate (Dib et al., 2008). The obtained voltage is in the expected range of V (Beloborodov & Thompson, 2007).
The outflow power must be equal to the bolometric luminosity emitted in hard X-rays. The best-fit model shows that the spectrum peaks at 7 MeV, outside the NuSTAR energy range. The exact location of the peak changes depending on the solution (Table 3), but is still in the MeV band. This is consistent with previous observations by INTEGRAL and RXTE (Kuiper et al., 2006). Our analysis also gives constraints on the geometry of the magnetized rotator in 1E 1841045 (see Table 3), which may be tested and refined by future measurements of X-ray polarization (or radio polarization, if the source one day becomes radio bright), or by incorporating future modelling of the pulse profile.
We find that the hard X-ray emission from the outflow extends below 10 keV and must be included in the analysis of the soft X-ray component. When this contribution is taken into account, we find that (1) a single blackbody does not provide a good fit for the soft X-ray emission, (2) a two-temperature blackbody provides the best fit, and (3) a good fit is also provided by a blackbody plus power law model (Table 4).
The two-temperature blackbody model admits a simple physical interpretation. The cold blackbody keV corresponds to the main thermal emission of the neutron star, and the hot blackbody keV comes from a hot spot. The inferred emission areas of the cold and hot blackbodies are and , where is the area of the neutron star surface (assuming radius km). Interestingly, is comparable to the area of the j-bundle footprint . The footprint is expected to be hotter than the rest of the stellar surface, as it can be bombarded by the particles flowing in the j-bundle toward the neutron star. Similar hot spots have been reported in some other magnetars (e.g., Gotthelf & Halpern, 2007; Tiengo et al., 2008).
The soft X-ray component could also be modeled as a single blackbody modified by resonant scattering in the magnetosphere (Thompson et al., 2002). Such a modification may be expected from scattering by the decelerated, mildly relativistic pairs in the equatorial region of magnetosphere (Beloborodov, 2013). The effect is, however, currently difficult to model, because it is sensitive to the poorly understood velocity distribution of the highly opaque plasma near the magnetic equatorial plane.
5. Conclusions
We have analyzed 48-ks NuSTAR and simultaneous 18-ks Swift observations, and archival data from XMM-Newton and Chandra for the magnetar 1E 1841045. To compare with previous observations we fit the source spectra with two phenomenological models: an absorbed blackbody plus broken power-law and an absorbed blackbody plus two power laws. The measured spectral parameters are consistent with those reported by Kuiper et al. (2006), and the photon index in the hard X-ray band is better constrained with the NuSTAR data than before. However, the NuSTAR data are not consistent with the spectral parameters reported by Morii et al. (2010). Although it is possible that the source might have varied since the Suzaku observations, it seems likely that an imperfect Kes 73 model caused problems in the background subtraction of the Suzaku data.
Our measurements of the pulsed spectrum are less constraining than but consistent with those in Kuiper et al. (2006). The pulsed spectrum is also consistent with Suzaku observations. We measured the rms pulsed fraction to be 20% at 50 keV. Although the spectral pulsed fractions were not well constrained at high energies, our results suggest that the pulsed fraction is likely to be significantly lower than 100% at 100 keV.
We find that the pulse profile in the 24–35 keV band shows a double-peaked structure, which was not previously reported. The deviation of the pulse profile localized in a narrow energy range suggests a possible absorption (or emission) feature in the phase-resolved spectrum. Although we find some evidence for such a feature, it is not statistically significant in the present data and requires deeper observations for possible confirmation.
The phase-resolved spectrum of 1E 1841045 is consistent with the emission model of Beloborodov (2013). From the model fit, we obtain constraints on the angle between the rotation and magnetic axes of the neutron star. We also infer the size of the active j-bundle, the power of the flow, and the voltage of the discharge, all of which agree with theoretical expectations. The results imply that the spectrum peaks at 7 MeV. Using this model, we place constraints on geometrical properties of the magnetar that in principle can be tested with future observations.
Using the physical model for the hard X-ray emission, we revisited the analysis of the soft X-ray component. We found that its phase-averaged spectrum can be fitted by two blackbodies, and the hot blackbody area is consistent with that expected for the footprint of the active j-bundle. However, we cannot rule out a power law plus blackbody for the soft component; future deeper observations may help in this regard.
This work was supported under NASA Contract No. NNG08FD60C, and made use of data from the NuSTAR mission, a project led by the California Institute of Technology, managed by the Jet Propulsion Laboratory, and funded by the National Aeronautics and Space Administration. We thank the NuSTAR Operations, Software and Calibration teams for support with the execution and analysis of these observations. This research has made use of the NuSTAR Data Analysis Software (NuSTARDAS) jointly developed by the ASI Science Data Center (ASDC, Italy) and the California Institute of Technology (USA). V.M.K. acknowledges support from an NSERC Discovery Grant, the FQRNT Centre de Recherche Astrophysique du Québec, an R. Howard Webster Foundation Fellowship from the Canadian Institute for Advanced Research (CIFAR), the Canada Research Chairs Program and the Lorne Trottier Chair in Astrophysics and Cosmology. A.M.B. acknowledges the support by NASA grants NNX10AI72G and NNX13AI34G. Part of this work was performed under the auspices of the U.S. Department of Energy by Lawrence Livermore National Laboratory under Contract DE-AC52-07NA27344.
References
- Baring & Harding (2007) Baring, M. G., & Harding, A. K. 2007, Ap&SS, 308, 109
- Beloborodov (2009) Beloborodov, A. M. 2009, ApJ, 703, 1044
- Beloborodov (2013) Beloborodov, A. M. 2013, ApJ, 762, 13
- Beloborodov & Thompson (2007) Beloborodov, A. M., & Thompson, C. 2007, ApJ, 657, 967
- Capalbi et al. (2005) Capalbi, M., Perri, M., Saija, B., Tamburelli, F., & Angelini, L. 2005, The Swift XRT Data Reduction Guide, Technical Report 1.2
- de Jager et al. (1989) de Jager, O. C., Swanepoel, J. W. H., & Raubenheimer, B. C., et al. 1989, A&A, 221, 180
- den Hartog et al. (2008a) den Hartog, P. R., Kuiper, L., & Hermsen, W. 2008, A&A, 489, 263
- den Hartog et al. (2008b) den Hartog, P. R., Kuiper, L., Hermsen, W., & et al. 2008, A&A, 489, 245
- Dib & Kaspi (2013) Dib, R., & Kaspi, V. M. 2013, ApJ, submitted
- Dib et al. (2008) Dib, R., Kaspi, V. M., & Gavriil, F. P. 2008, ApJ, 673, 1044
- Duncan & Thompson (1992) Duncan, R. C., & Thompson, C. 1992, ApJ, 392, L9
- Enoto et al. (2010) Enoto, T., Nakazawa, K., Makishima, K., & et al. 2010, ApJ, 722, L162
- Gonzalez et al. (2010) Gonzalez, M. E., Dib, R., Kaspi, V. M., Woods, P. M., Tam, C.R. & et al. 2010, ApJ, 716, 1345
- Gotthelf & Halpern (2007) Gotthelf, E. V. & Halpern, J. P. 2007, Ap&SS, 308, 79
- Göğüş et al. (2010) Göğüş, E., Woods, P. M., Kouveliotou, C. & et al. 2010, ApJ, 722, 899
- Hailey et al. (2010) Hailey, C. J., An, H., Blaedel, K. L., et al. 2010, Proc. SPIE, 7732, 77320T
- Harrison et al. (2010) Harrison, F. A., Cook, W. R., Miyasaka, H., & McLean, R. Semiconductor Radiation Detection Systems, CRC press, 2010
- Harrison et al. (2013) Harrison, F. A., Craig, W. W., Christensen, F. E., et al. 2013, ApJ, 770, 103
- Heyl & Hernquist (2005) Heyl, J. S., & Hernquist, L. 2005, ApJ, 618, 463
- Kaspi & Boydstun (2010) Kaspi, V. M., & Boydstun, K. 2010, ApJ, 710, L115
- Kouveliotou et al. (1998) Kouveliotou, C., Dieters, S., Strohmayer, T. & et al. 1998, Nature, 393, 235
- Kuiper et al. (2006) Kuiper, L., Hermsen, W., den Hartog, P. R., & Collmar, W. 2006, ApJ, 645, 556
- Kuiper et al. (2004) Kuiper, L., Hermsen, W., & Mendez, M. 2004, ApJ, 613, 1173
- Lin et al. (2011) Lin, L., Kouveliotou, C., Göğüş, E. et al. 2011, ApJ, 740, L16
- Livingstone et al. (2011) Livingstone, M. A., Scholz, P., Kaspi, V. M., Ng, C.-Y., & Gavrill, F. P. 2011, ApJ, 743, L38
- Mereghetti (2008) Mereghetti, S. 2008, A&A Rev., 15, 255
- Molkov et al. (2004) Molkov, S. V., Cherepashchuk, A. M., Lutovinov, A. A., et al. 2004, Sov. Astron. Lett., 30, 534
- Morii et al. (2010) Morii, M., Kitamoto, S., Shibazaki, N., et al. 2010, PASJ, 62, 1249
- Morii et al. (2003) Morii, M., Sato, R., Kataoka, J. & kawai, N. et al. 2003, PASJ, 55, L45
- Olausen & Kaspi (2013) Olausen, S. A., & Kaspi, V. M. 2013, ApJ, submitted
- Ransom et al. (2002) Ransom, S. M., Eikenberry, S. S. & Middleditch, J. 2002, ApJ, 124, 1788
- Rea & Esposito (2011) Rea, N., Esposito, P., 2011, in High-Energy Emission from Pulsars and their Systems, ed. D. F. Torres & N. Rea (Berlin: Springer), 247
- Rea et al. (2010) Rea, N., Esposito, P., Turolla, R., et al. 2010, Science, 330, 944
- Rea et al. (2012) Rea, N., Israel, G. L., Esposito, P., et al. 2012, ApJ, 754, 27
- Scholz et al. (2012) Scholz P., Ng, C. Y., Livingstone, M., et al. 2012, ApJ, 761, 66
- Thompson & Beloborodov (2005) Thompson, C., & Beloborodov, A. M., 2005, ApJ, 634, 565
- Thompson & Duncan (1996) Thompson, C., & Duncan, R. C., 1996, ApJ, 473, 322
- Thompson et al. (2002) Thompson, C., Lyutikov, M., & Kulkarni, S. R. 2002, ApJ, 574, 332
- Tian & Leahy (2008) Tian, W. W., & Leahy, D. A., 2008, ApJ, 677, 292
- Tiengo et al. (2008) Tiengo, A., Esposito, P., & Mereghetti, S. 2008, ApJ, 680, L133
- Vasisht & Gotthelf (1997) Vasisht, G., & Gotthelf, E. V. 1997, ApJ, 486, L129
- Wachter et al. (2004) Wachter, S., Patel, S. K., Kouveliotou, C., et al. 2004, ApJ, 615, 887
- Wang & Gotthelf (1998) Wang, Q. D., & Gotthelf, E. V. 1998, ApJ, 494, 623
- Woods & Thompson (2006) Woods, P. M., & Thompson, C. 2006, in Compact Stellar X-ray Sources, ed. W. H. G. Lewin & M. van der Klis (Cambridge University Press, UK, 2006)
- Zhu et al. (2010) Zhu, W., & Kaspi, V. M. 2010, ApJ, 719, 351