xxx–xxx
Gas signatures of Herbig Ae/Be disks
probed with Herschel SPIRE spectroscopy
Abstract
Herbig Ae/Be objects, like their lower mass counterparts T Tauri stars, are seen to form a stable circumstellar disk which is initially gas-rich and could ultimately form a planetary system. We present Herschel SPIRE 460–1540 GHz spectra of five targets out of a sample of 13 young disk sources, showing line detections mainly due to warm CO gas.
keywords:
circumstellar matter, planetary systems: protoplanetary disks, ISM: molecules1 Observations, processing, and line detections
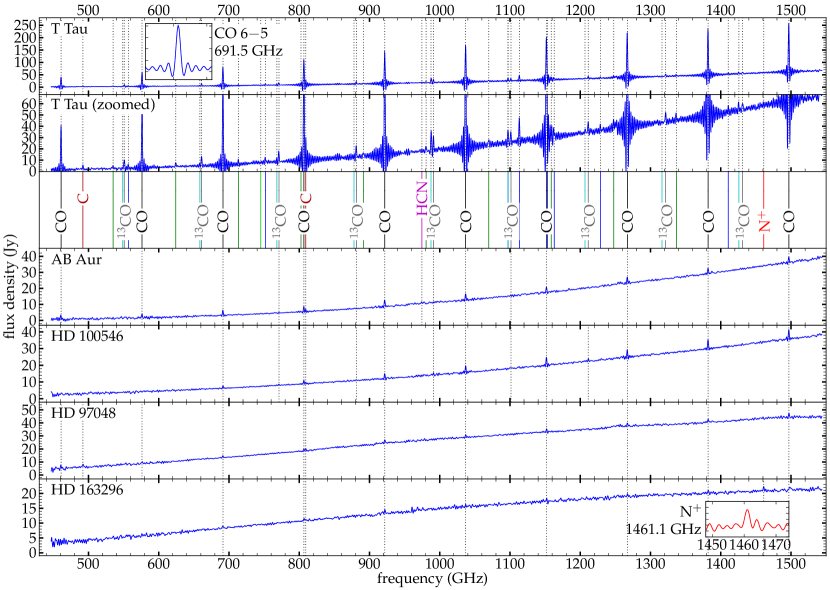
In a 16-hour guaranteed time project (P.I. Göran Olofsson) using the SPIRE Fourier Transform Spectrometer (FTS), spectra in the 460–1540 GHz range were obtained of 13 protoplanetary disks around Herbig stars: AB Aur, HD 100546, HD 97048, HD 163296, T Tau, HD 142527, HD 144432, RY Tau, HD 104237, HD 36112, HD 169142, HD 100453 and TW Hya. The data were processed in HIPE 9, followed by subtraction of a median background signal obtained from the off-center detectors. All spectra show a smoothly rising dust continuum, while only the first five of the above list show detectable line signal. The disk emission lines, presented in Fig. 1, are unresolved both spatially (the SPIRE FTS beam is 42–17′′) and spectrally ( 400–1300). Spectral lines are fitted using a dedicated Fourier Transform line fitter tool (available online at www.uleth.ca/phy/naylor/). Table 1 lists lines detected in at least one target besides T Tau.
2 Interpretation and analysis plans
First, it is evident from the observations that the continuum and CO lines toward T Tau originate in an extended protostellar envelope rather than in a much smaller disk. This is likely also the case for the cold H2O vapor.
Second, the N+ line toward HD 163296 is – times brighter than what is predicted by current (X-ray) irradiated disk models (e.g., Aresu et al. 2011), even when invoking X-ray luminosities much higher than appropriate for HD 163296. Since N+ is also detected in all off-center detectors up to 1′ away from the star, we hypothesize that a single (external) source is responsible for ionizing nitrogen both in the disk/jet of HD 163296 and in the surrounding gaseous medium.
Finally, we plan to use the unique set of 4–3 to 13–12 lines of CO and 13CO ( 50–500 K) to characterize warm gas in the Herbig protoplanetary disks.
Acknowledgements: This work is supported by CSA and NSERC. SPIRE has been developed by a consortium of institutes led by Cardiff University (UK) and including contributions from Canada, China, France, Italy, Spain, Sweden, UK, and USA.
| line | frequency(2) | line flux(3) ( W m-2) [uncertainty] | |||||
|---|---|---|---|---|---|---|---|
| transition(1) | (K) | (GHz) | T Tau | AB Aur | HD 100546 | HD 97048 | HD 163296 |
| CO 4–3 | 55 | 461.0 | 448 [5] | 35 [2] | - | 37 [3] | - |
| C 3P1–3P0 | 24 | 492.2 | 35 [5] | - | - | 26 [3] | - |
| CO 5–4 | 83 | 576.3 | 599 [5] | 25 [2] | - | 13 [3] | - |
| CO 6–5 | 116 | 691.5 | 740 [5] | 38 [2] | 17 [2] | 17 [3] | 8 [2] |
| 13CO 7–6 | 148 | 771.2 | 100 [5] | 6 [2] | 7 [2] | - | - |
| CO 7–6 | 155 | 806.7 | 1141 [5] | 38 [2] | 22 [2] | 17 [3] | 10 [2] |
| C 3P2–3P1 | 62 | 809.3 | 93 [5] | 14 [2] | 8 [2] | 17 [3] | 5 [2] |
| CO 8–7 | 199 | 921.8 | 1531 [5] | 48 [2] | 36 [2] | 31 [3] | 16 [2] |
| HCN 11–10 | 281 | 974.5 | 10 [4] | 11 [2] | - | - | - |
| 13CO 9–8 | 238 | 991.3 | 75 [4] | 5 [2] | 14 [2] | - | - |
| CO 9–8 | 249 | 1036.9 | 1106 [4] | 47 [2] | 45 [2] | 25 [3] | 9 [2] |
| CO 10–9 | 304 | 1152.0 | 1202 [4] | 39 [2] | 53 [2] | 29 [3] | 12 [2] |
| 13CO 11–10 | 349 | 1211.3 | 50 [4] | - | 14 [2] | - | - |
| CO 11–10 | 365 | 1267.0 | 1225 [4] | 46 [2] | 51 [2] | 32 [3] | 12 [2] |
| CO 12–11 | 431 | 1382.0 | 1224 [4] | 38 [2] | 59 [2] | 24 [3] | 10 [2] |
| N+ 3P1–3P0 | 70 | 1461.1 | - | - | - | - | 17 [2] |
| CO 13–12 | 503 | 1496.9 | 1262 [4] | 44 [2] | 62 [2] | 41 [3] | 11 [2] |
Notes: (1) In addition to the lines listed here, in T Tau we detect six H2O lines and 25 others identified as 13CO, C18O, HCO+, HCN and N2H+. (2) Rest frequency from JPL, [Pickett et al. (1998)], except N+ from SLAIM. (3) A ‘-’ indicates a non-detection. Uncertainties include only the formal fitting error.
References
- [Aresu et al. (2011)] Aresu, G., Kamp, I., Meijerink, R., Woitke, P., Thi, W.-F., & Spaans, M. 2011, A&A, 526, A163
- [Pickett et al. (1998)] Pickett, H.M., Poynter, R.L., Cohen, E.A., et al. 1998, J. Quant. Spec. Radiat. Transf., 60, 883