Order-disorder phase transition on the (100) surface of magnetite
Abstract
Using low-energy electron diffraction, we show that the room-temperature reconstruction of Fe3O4(100) reversibly disorders at 450 ∘C. Short-range order persists above the transition, suggesting that the transition is second order and Ising-like. We interpret the transition in terms of a model in which sub-surface Fe3+ is replaced by Fe2+ as the temperature is raised. This model reproduces the structure of antiphase boundaries previously observed with STM as well as the continuous nature of the transition. To account for the observed transition temperature, the energy cost of each charge rearrangement is 82 meV.
Metal oxides are often useful because of their stability at high temperatures. An example is magnetite, Fe3O4. In catalytic applications such as the water-gas shift reaction Ratnasamy and Wagner (2009) magnetite is used at temperatures between 300–500 ∘C. Furthermore, magnetite’s high Curie temperature of 580 ∘C allows spintronic applications. Bibes et al. (2011) Since such applications frequently depend on surface properties, a natural question arises – how does the surface structure change with temperature?
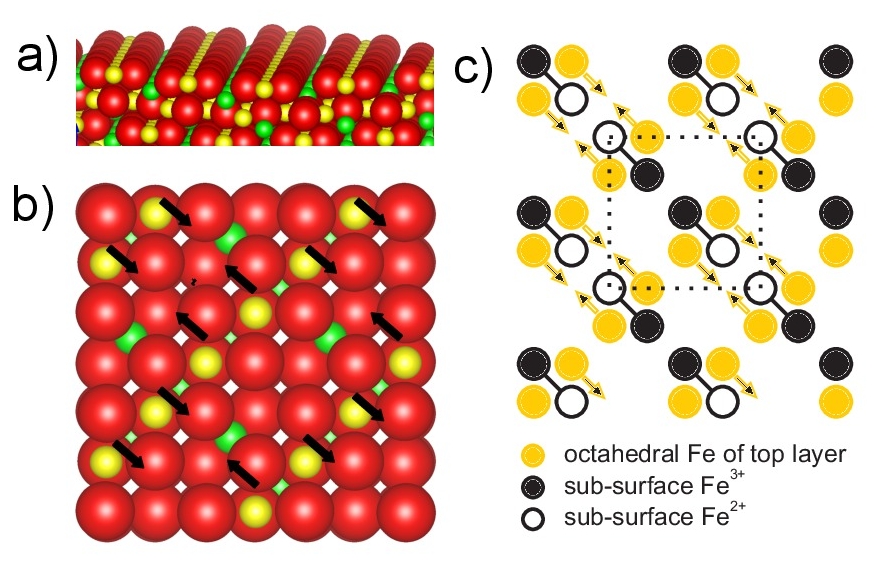
The room-temperature properties of magnetite’s surfaces are complex. Its (100) surface has been extensively studied. Stanka et al. (2000); Pentcheva et al. (2008); Chambers et al. (2000); Mijiritskii et al. (2000); Mijiritskii and Boerma (2001); Wiesendanger et al. (1992); Mariotto et al. (2002); Stoltz et al. (2008); Parkinson et al. (2010, 2011); Jordan et al. (2006); Pentcheva et al. (2005); Lodziana (2007) Instead of the bulk-like termination, it reconstructs into a structure with a larger unit cell. The atomic structure of this reconstruction has been painstakingly unraveled by density functional theory (DFT), low-energy electron diffraction (LEED) and scanning tunneling microscopy (STM) Pentcheva et al. (2008) – the surface is terminated by octahedrally coordinated iron atoms arranged in rows, as shown in Fig. 1(a). The observed periodicity results from small displacements of the iron atoms perpendicular to the rows [see Fig. 1(b)]. The driving force for the reconstruction is believed to be ordering of the charge state of the iron in octahedral sites beneath the surface.Lodziana (2007); Parkinson et al. (2012) In bulk magnetite at room temperature the average charge state of octahedral iron is +2.5. The sub-surface charge ordering involves disproportionation of this charge into more positively and negatively charged sites. It has been proposed Lodziana (2007); Parkinson et al. (2012) that the disproportionation is greatest in the plane of octahedral iron beneath the top layer. Fig. 1(c) sketches the proposed charge order in this subsurface layer. (In Fig. 1(c), and in our discussion below, the two charge states in the 2nd layer are labeled by their nominal oxidation state Fe3+ and Fe2+, although the charges are estimated to only differ by 0.2-0.4 e rather than e. Lodziana (2007); Mulakaluri et al. (2009)) The top layer octahedral iron is displaced in the surface plane to decrease the distance to the nearest sub-surface Fe2+, giving the undulating rows of surface octahedral iron observed by LEED and STM.
What might happen to such a structure when the temperature is raised? One possibility is that the high-temperature, high-entropy surface differs significantly in stoichiometry and termination from the charge ordered phase. For example, the reconstructed TiO2(110) surface has been observed to unreconstruct at high temperature to a surface with different stoichiometry. McCarty and Bartelt (2003) In this case the transition was first order, with a discontinuous change in order and surface stoichiometry at the transition. Another possibility is that the surface stoichiometry remains fixed and the charge order is lost. Indeed, stoichiometric magnetite itself undergoes a first-order phase transition 111The Verwey transition is first order for stoichimetric samples, while it is second order for extreme deviations of the composition (R. Aragón, D.J. Buttrey, J.P. Shepherd, J.M. Honig, Phys. Rev. B 31, 430 (1985)) at 120 K, the Verwey transition,Walz (2002); García and Subías (2004) which has been interpreted in terms of the disappearance of charge order.Walz (2002) Or the high- and low-temperature surfaces may be locally similar (with comparable charge disproportionation and iron displacements), albeit with a loss of long-range order. A continuous, second-order transition driven by configurational entropy in the charge arrangement is then a possibility. Because the ground state shown in Fig. 1(c) is two-fold degenerate, the transition would be expected to be Ising-like. Finally, if magnetic order were important for the surface reconstruction, one might expect that magnetite’s Curie transition at 580 ∘C Cornell and Schwertmann (1997) would influence the reconstruction.
Here we use LEED to study the temperature dependence of the magnetite (100) surface. We show that there is a phase transition at 450∘C. The transition is one of order/disorder, i.e., the structural motif that characterizes the surface at low temperature is still present at high temperature but is not ordered over long distances.
Two crystals of natural magnetite (100) from Mateck GmbH were examined in detail. Similar results were observed in a synthetic crystal and in a magnetite (100) film grown on SrTiO3 by infrared pulsed-laser deposition.Sanz et al. (2013) The samples were cleaned by cycles of mild sputtering (1.5 kV Ar+ for 10 minutes) followed by annealing to about 600 ∘C in a background of molecular oxygen at 110-6 Torr. Temperature was measured by a two-color infrared pyrometer. The experiments were performed in a low-energy electron microscope (LEEMAltman (2010)) from Elmitek GmbH, which offers several advantages over a conventional diffractometer for collecting LEED data. de la Figuera et al. (2006); McCarty and de la Figuera (2013) Namely, diffraction is obtained from well-defined regions that have been imaged and characterized. Also light emitted from the hot sample is isolated from the electron detector and does not degrade high-temperature measurements.
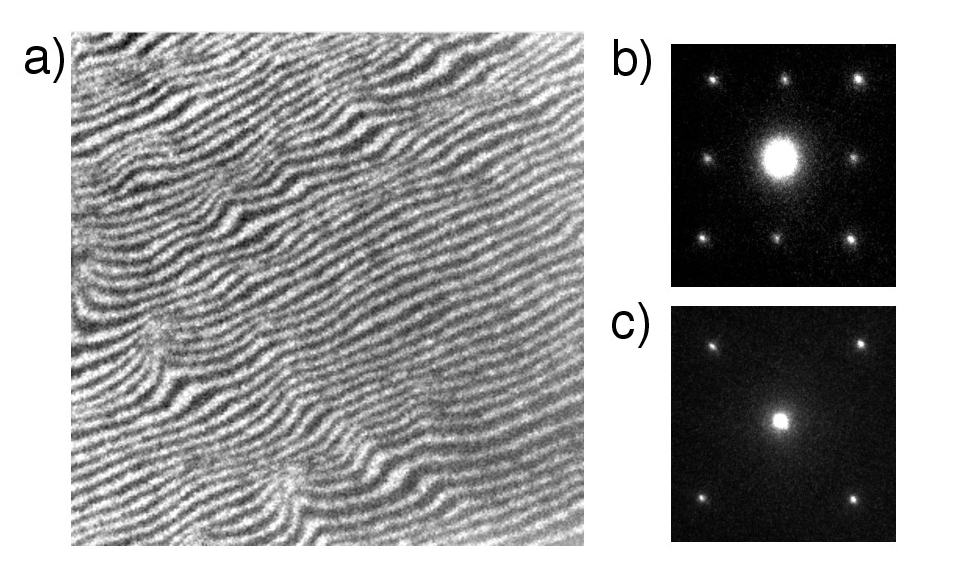
Simply degassing the crystals in vacuum gave good LEED patterns. After cycles of sputtering and annealing no carbon or other impurities were detected on the surface by Auger electron spectroscopy. Terraces separated by steps could be observed on the surface. The dark-field LEEM image shown in Fig. 2(a) was formed from a first-order diffraction beam. The Fe rows impart two-fold symmetry to a single terrace. But the row direction rotates 90∘ when crossing between adjacent terraces separated by atomic (2.1 Å-high) steps. So at an energy that has strong contrast between the (1,0) and (0,1) beams of a single terrace, adjacent terraces then show black and white contrast in the dark-field image. Nie et al. (2013)
Figure 2(b) shows the LEED pattern from such a surface. The region examined, two microns in diameter, contains many atomic terraces. Thus the biaxial symmetry of an individual terrace is averaged out, giving a pattern with four-fold symmetry. In addition to the outer spots, there are spots that correspond to a surface unit cell. The reconstruction beams become weaker upon heating the sample. At 488 ∘C, the reconstruction spots are not visible [see Fig. 2(c)]. The diffraction pattern reappears upon lowering the temperature, i.e., the transition is reversible, and there is no discernible hysteresis. LEEM showed only a gradual change in electron reflectivity through the transition. There was no sign of the step motion that would signal surface mass transport due to an abrupt stoichiometry change, as was observed on TiO2(110).McCarty and Bartelt (2003) The transition is significantly below the Curie temperature of 580 ∘C, so bulk spin order does not play a crucial role in the surface phase transition. (Spin-polarized LEEMde la Figuera et al. (2013) has observed surface magnetic domains up to the bulk Curie temperature, so surface magnetic order seems to persist on the surface to the Curie point.)
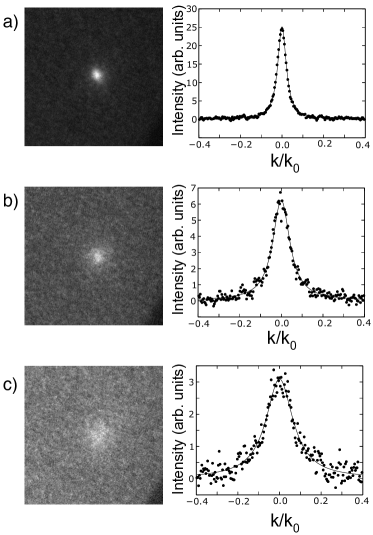
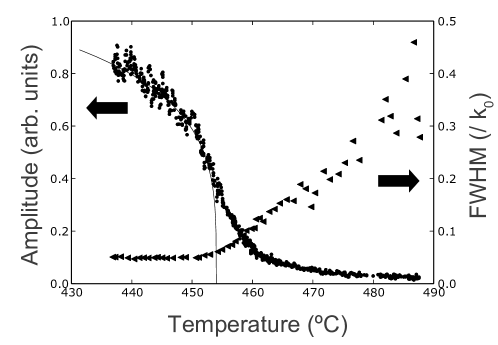
To gain further insight into the properties of the surface transition, we measure the profiles of the reconstruction spots through the transformation (see Fig. 3). At all temperatures, the profiles can be reasonably fit by a Lorentzian (continuous lines in Fig. 3). The amplitude and full width at half maximum of the fitted Lorentzian is plotted in Fig. 4. At low temperature the FWHM is limited by instrumental resolution. This is consistent with long-range order. Above 450 ∘C, the width of the reconstruction beam increases. This large increase, to 10 times the instrumental resolution, is characteristic of scattering above the critical temperature of a second-order phase transition when long-range order is replaced by short-range order with a finite correlation length. (In the limit of perfect instrumental resolution, the FWHM is inversely proportional to the correlation length.) Since the ground state of the reconstruction is two-fold degenerate, we expect its second-order transition to be reasonably described by a two-dimensional Ising model. Roelofs (1996) Beneath the temperature dependence of the spot intensity due to long-range order is proportional to the square of the order parameter of the transition. The continuous line in Fig. 4 fits this diffraction data to the square of the Ising order parameter :
| (1) |
where is the transition temperature. The agreement between the measured diffraction intensity and the 2D Ising model is good. We estimate to be 454 ∘C. Furthermore, the approximately linear increase in the FWHM (i.e., the inverse correlation length) is also consistent with the Ising model. Roelofs (1996) Thus, the 2D Ising model provides a reasonable description of the temperature dependence of the transition. 222Lack of data very near to precludes making useful estimates of critical exponents. We did not observe time dependent fluctuations in the LEEM image intensity which can be caused by critical fluctuations near (Ref. Tromp et al., 1996], presumably because they were much faster than our image acquisition time of 0.03 s.
The transition temperature was the same in vacuum or 110-6 Torr of oxygen. While we cannot exclude a dependence of the transition temperature on the crystal’s bulk stoichiometry, we note that our natural crystal and a synthetic crystal had the same transition temperature within a few tens of degrees.
Given the continuous nature of the transition and the absence of any direct evidence for a stoichiometry change, it is likely that the transition is driven by configurational entropy in the charge order. To interpret the observed then requires understanding the low-energy excitations of the charge-order pattern. The structure of anti-phase domain boundaries deduced from STM images by Parkinson et al. Parkinson et al. (2012) provide significant information about these excitations. They find that the boundary between the two degenerate ground states always consists of four adjacent Fe2+ in a row, as shown schematically in Fig. 5(a). Other possible types of antiphase domains with four Fe3+ in a row or three Fe2+ and Fe3+ in a row (Fig. 5(b) and (c), respectively) were not observed. Thus the phase boundaries appear to be relatively rich in sub-surface Fe2+.
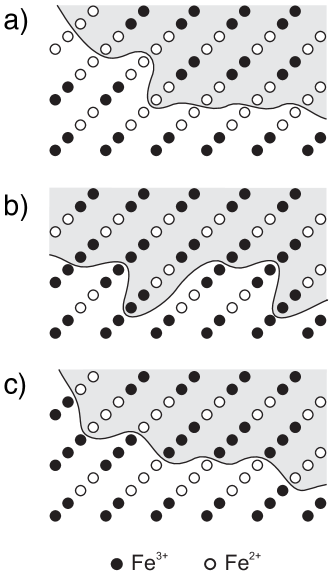
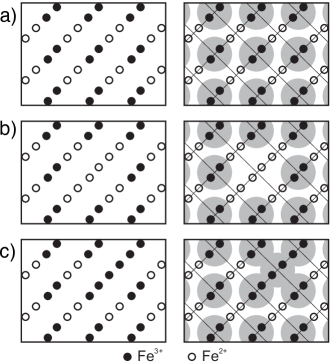
By comparing allowed and disallowed configurations, we can hypothesize two microscopic rules governing the observed antiphase boundaries: 1) Fe2+ and Fe3+ are always arranged in pairs because anti-phase boundaries such as Fig. 5(c) were not observed, 2) The four nearest neighbor pairs of an Fe3+ pair are always Fe2+ pairs because phase boundaries such as Fig. 5(b) were not observed. These rules would imply that the lowest energy excitation of the ground state is a replacement of an Fe3+ pair by an Fe2+ pair, as shown in the left hand panels of Figs. 6(a) and (b). Thus as the temperature is raised, sub-surface Fe2+ defects will be gradually created. When the density of these defects becomes large, anti phase boundaries can form. Eventually, long-range order will be lost as the anti-phase boundaries proliferate. To estimate this critical defect density, and to give in terms of the energy of the lowest energy excitation we can map our problem onto the hard square lattice gas model of statistical mechanics as shown in the right hand panels of Fig. 6. The hard square model assumes that sites of a square lattice can be occupied only if nearest neighbor sites are unoccupied. If one identifies Fe3+ pairs with occupied lattice sites, then the hard square lattice gas rule upholds the rule 2, the maximum coverage of occupied sites is 1/2 (in the state), as in Fig. 6(a). Occupation of nearest neighbor sites, which correspond to adding Fe3+ charges to the ordered state as in Fig. 6(c), is not allowed. As shown in Fig. 6(b), the lowest energy excitation is equivalent to forming a vacancy in the hard square model.
The ordered state of the hard square model is known to disorder in an Ising-like second-order transition when the coverage of occupied sites drops from 0.5 to . (See, e.g., Ref. [Kinzel and Schick, 1981].) To relate this transition to the observed disordering of the magnetite’s reconstruction and the energy to create a vacancy, we note that the partition function of our problem, taking the zero in energy as the ground state, is
| (2) |
where the sum is over all allowed configuration, is the total number of sites, is the number of occupied sites (i.e. Fe3+ pairs) and . The order-disorder transition occurs when .Kinzel and Schick (1981) From the measured ∘C the energy of the rearrangement (changing two Fe3+ to two Fe2+) is thus predicted to be 82 meV. This number could provide a check to density functional theory models of the stability of the reconstruction.333The complications of enforcing charge states in this system make theoretical estimates difficult. Calculations in Ref. [Parkinson et al., 2012] suggest that replacing one Fe3+ with Fe2+ costs 55 meV, which would be of the same order as we predict, but since the details of the configuration studied is not given, it is difficult to directly compare with our model. Preliminary DFT calculations 444I. Bernal and S. Gallego, to be published. suggest that completely removing the charge order only changes the energy per unit cell by a few per unit cell, lending support to the plausibility that the transition is driven by configurational entropy of the charge order and not changes in stoichiometry.
Another prediction of this model is that the second layer octahedral iron would gradually become more reduced as is raised. Perhaps this change would be compensated by a more oxidized top layer (which is already known to be Fe3+ rich at room temperature Chambers et al. (2000); Novotny et al. (2013)).
As mentioned, the charge-ordered reconstruction has been proposed as the surface equivalent of the low-temperature monoclinic phase of bulk magnetite. Lodziana (2007) The charge order in the monoclinic phase is complex, Senn et al. (2012) with many inequivalent states of the octahedral iron. Therefore, it s likely that models such as in Fig. 1(c), where disproportionation is restricted to two charge states in a single octahedral plane, are a considerable oversimplification. Thus, there could well be other degrees of freedom and sources of entropy that would influence the transition temperature. More detailed calculations of the nature of the surface charge order are clearly needed to address this question. The analogy with the monoclinic phase also begs the question of whether the transition we observe at high temperature, , can be interpreted as a surface analog of the Verwey transition.Lodziana (2007) Strictly, the bulk Verwey transition is a first-order transition that involves a substantial structural change, a small change in the charge order and limited changes in the spin order. So from this point of view, our transition is not simply a ‘surface’ Verwey transition. Nevertheless, our model suggests that an interplay between charge order and atomic structure is responsible for the surface phase transition.
In summary, we have experimentally observed that the magnetite (100) surface undergoes a phase transition. Motivated by the structure of antiphase boundaries observed in Ref. [Parkinson et al., 2012] we speculate that the transition is caused by a gradual reduction of sub-surface octahedral iron as the temperature is raised.
Acknowledgments
We thank Prof. Gareth Parkinson for lending us a synthetic magnetite crystal and Dr. Mikel Sanz for providing the magnetite thin film. This research was supported by the Office of Basic Energy Sciences, Division of Materials and Engineering Sciences, U. S. Department of Energy under Contract No. DE-AC04-94AL85000 and by the goverment of Spain through Project No. MAT2009-14578-C03-01/03 and MAT2012-38045-C04-01/04. LV and IB thanks the Spanish CSIC for support through a JAE-Doc contract.
References
- Ratnasamy and Wagner (2009) C. Ratnasamy and J. P. Wagner, Catal. Rev. 51, 325 (2009).
- Bibes et al. (2011) M. Bibes, J. E. Villegas, and A. Barthélémy, Adv. Phys. 60, 5 (2011).
- Stanka et al. (2000) B. Stanka, W. Hebenstreit, U. Diebold, and S. Chambers, Surf. Sci. 448, 49 (2000).
- Pentcheva et al. (2008) R. Pentcheva, W. Moritz, J. Rundgren, S. Frank, D. Schrupp, and M. Scheffler, Surf. Sci. 602, 1299 (2008).
- Chambers et al. (2000) S. Chambers, S. Thevuthasan, and S. Joyce, Surf. Sci. 450, L273 (2000).
- Mijiritskii et al. (2000) A. Mijiritskii, M. Langelaar, and D. Boerma, J. Mag. Mag. Mat. 211, 278 (2000).
- Mijiritskii and Boerma (2001) A. Mijiritskii and D. Boerma, Surf. Sci. 486, 73 (2001).
- Wiesendanger et al. (1992) R. Wiesendanger, I. V. Shvets, D. Bürgler, G. Tarrach, H. J. Güntherodt, J. M. D. Coey, and S. Gräser, Science 255, 583 (1992).
- Mariotto et al. (2002) G. Mariotto, S. Murphy, and I. V. Shvets, Phys. Rev. B 66, 245426 (2002).
- Stoltz et al. (2008) D. Stoltz, A. Önsten, U. Karlsson, and M. Göthelid, Ultramicroscopy 108, 540 (2008).
- Parkinson et al. (2010) G. S. Parkinson, N. Mulakaluri, Y. Losovyj, P. Jacobson, R. Pentcheva, and U. Diebold, Phys. Rev. B 82, 125413 (2010).
- Parkinson et al. (2011) G. S. Parkinson, Z. Novotný, P. Jacobson, M. Schmid, and U. Diebold, Surf. Sci. 605, L42 (2011).
- Jordan et al. (2006) K. Jordan, A. Cazacu, G. Manai, S. F. Ceballos, S. Murphy, and I. V. Shvets, Phys. Rev. B 74, 085416 (2006).
- Pentcheva et al. (2005) R. Pentcheva, F. Wendler, H. L. Meyerheim, W. Moritz, N. Jedrecy, and M. Scheffler, Phys. Rev. Lett. 94, 126101 (2005).
- Lodziana (2007) Z. Lodziana, Phys. Rev. Lett. 99, 206402 (2007).
- Parkinson et al. (2012) G. S. Parkinson, T. A. Manz, Z. Novotný, P. T. Sprunger, R. L. Kurtz, M. Schmid, D. S. Sholl, and U. Diebold, Phys. Rev. B 85, 195450 (2012).
- Mulakaluri et al. (2009) N. Mulakaluri, R. Pentcheva, M. Wieland, W. Moritz, and M. Scheffler, Phys. Rev. Lett. 103, 176102 (2009).
- McCarty and Bartelt (2003) K. F. McCarty and N. C. Bartelt, Surf. Sci. 527, L203 (2003).
- Note (1) The Verwey transition is first order for stoichimetric samples, while it is second order for extreme deviations of the composition (R. Aragón, D.J. Buttrey, J.P. Shepherd, J.M. Honig, Phys. Rev. B 31, 430 (1985)).
- Walz (2002) F. Walz, J. Phys. Cond. Mat. 14, R285 (2002).
- García and Subías (2004) J. García and G. Subías, J. Phys. Cond. Mat. 16, R145 (2004).
- Cornell and Schwertmann (1997) R. M. Cornell and U. Schwertmann, The Iron Oxides (John Wiley & Sons Ltd, 1997) p. 604.
- Sanz et al. (2013) M. Sanz, M. Oujja, E. Rebollar, J. F. Marco, J. de la Figuera, M. Monti, A. Bollero, J. Camarero, F. J. Pedrosa, M. García-Hernández, and M. Castillejo, Appl. Surf. Sci. 282, 642 (2013).
- Altman (2010) M. S. Altman, J. Phys. Cond. Mat. 22, 084017 (2010).
- de la Figuera et al. (2006) J. de la Figuera, J. M. Puerta, J. I. Cerda, F. E. Gabaly, and K. F. McCarty, Surf. Sci. 600, L105 (2006).
- McCarty and de la Figuera (2013) K. F. McCarty and J. de la Figuera, in Surface Science Techniques, Springer Series in Surface Sciences, Vol. 51 (Springer Berlin Heidelberg, 2013) p. 531.
- Nie et al. (2013) S. Nie, E. Starodub, M. Monti, D. A. Siegel, L. Vergara, F. El Gabaly, N. C. Bartelt, J. de la Figuera, and K. F. McCarty, J. Am. Chem. Soc. 135, 10091 (2013).
- de la Figuera et al. (2013) J. de la Figuera, L. Vergara, A. T. N’Diaye, A. Quesada, and A. K. Schmid, Ultramicroscopy 130, 77 (2013).
- Roelofs (1996) L. Roelofs, in Handbook of Surface Science, Vol. 1, edited by W. Unertl (North-Holland, 1996) pp. 713–807.
- Note (2) Lack of data very near to precludes making useful estimates of critical exponents.
- Tromp et al. (1996) R. M. Tromp, W. Theis, and N. C. Bartelt, Phys. Rev. Lett. 77, 2522 (1996).
- Kinzel and Schick (1981) W. Kinzel and M. Schick, Phys. Rev. B 24, 324 (1981).
- Note (3) The complications of enforcing charge states in this system make theoretical estimates difficult. Calculations in Ref. [\rev@citealpnumGarethPRB2012] suggest that replacing one Fe3+ with Fe2+ costs 55 meV, which would be of the same order as we predict, but since the details of the configuration studied is not given, it is difficult to directly compare with our model.
- Note (4) I. Bernal and S. Gallego, to be published.
- Novotny et al. (2013) Z. Novotny, N. Mulakaluri, Z. Edes, M. Schmid, R. Pentcheva, U. Diebold, and G. S. Parkinson, Phys. Rev. B 87, 195410 (2013).
- Senn et al. (2012) M. S. Senn, J. P. Wright, and J. P. Attfield, Nature 481, 173 (2012).