Tapered nanofiber trapping of high-refractive-index nanoparticles
Abstract
A nanofiber-based optical tweezer is demonstrated. Trapping is achieved by combining attractive near-field optical gradient forces with repulsive electrostatic forces. Silica-coated Fe2O3 nanospheres of 300 diameter are trapped as close as 50 nm away from the surface with 810 W of optical power, with a maximum trap stiffness of 2.7 pN m-1. Electrostatic trapping forces up to 0.5 pN are achieved, a factor of 50 larger than those achievable for the same optical power in conventional optical tweezers. Efficient collection of the optical field directly into the nanofiber enables ultra-sensitive tracking of nanoparticle motion and extraction of its characteristic Brownian motion spectrum, with a minimum position sensitivity of 3.4 .
The sensing and manipulation of small dielectric particles has useful applications in single molecule biophysics Greenleaf-2006 ; Neuman-2008 , label-free biomolecule detection Vollmer-2002 ; Arnold-2009 ; Armani-2007 and nanotechnology Erickson-2009 . Optical tweezers, one of the most well-known manipulation techniques, can stably trap micro-scale particles with forces compatible with the molecular machinery of living cells Jannasch-2012 . This has enabled force spectroscopy on individual biomolecules such as DNA Wang-1997 , RNA Bustamante and motor proteins Block . Currently, there is much interest in extending the achievable trapping forces into the nanonewton range and broadening the applications of optical tweezers to include processes involving larger biological structures such as protein folding Jannasch-2012 . Although a variety of methods have been developed in order to increase trapping forces Jannasch-2012 ; Simpson-1997 ; Reihani-2007 ; Mahamdeh-2011 ; Bormuth-2008 , most still rely on mW levels of optical power and micro-scale particles. To minimize intrusion on the biological system, it is important to extend these advances to smaller nano-scale probes and W powers. Unfortunately, the diffraction limit of light and the precipitous scaling of trap strength with probe size limit the ability of optical tweezers to meet these challenges Erickson-2009 .

Sub-diffraction limited trapping has been achieved in systems such as slot waveguides Erickson-2009 , plasmonic nano-tweezers Juan-2011 and optical microresonators Arnold-2009 ; Lin-2010 ; Mandal-2010 . In such systems, near-field effects led to stronger forces without the need for large optical power. Here, we extend these approaches to nanofiber-based optical tweezers, demonstrating trapping and tracking of 300 nm silica-coated, high-refractive-index () particles. Following pioneering work in optical microcavity-based trapping reported in Ref. Arnold-2009 , a combination of strong near-field attractive forces and electrostatic repulsive forces traps nanoparticles as close as 50 nm away from the nanofiber surface with only 810 W of optical power. Trap stiffnesses as high as 2.7 pN m-1 are achieved, as well as peak electrostatic and optical trapping forces of 0.5 pN and 0.14 pN, respectively, which are both more than an order of magnitude larger than those achievable in conventional optical tweezers under similar conditions. Although tweezers have previously been reported using optical gradient forces from single-sided tapered fibers Liu-2006 ; Xin-2012 , our experiments differ in that they utilize strong electrostatic repulsion and a continuous tapered fiber design with high numerical aperture which enables efficient collection of the scattered light. This allows ultra-sensitive tracking of nanoparticle motion with a position sensitivity of 3.4 . By extending optical tweezers into the nanoscale regime, providing ultra-sensitive tracking and strong forces, as well as eliminating the need for high NA objectives, the technique provides a simple architecture for applications in single molecule force spectroscopy and characterization of molecular interactions, and paves the way towards all-fiber-based optical trapping of nano-scale particles.
As illustrated in Fig. 1(a), the basic principle behind the trapping method implemented here is to balance attractive near-field optical gradient forces with repulsive electrostatic forces Arnold-2009 . In the evanescent field of the nanofiber, the optical gradient force attracts particles towards the position of maximum field intensity at the surface of the fiber, scaling linearly with the injected optical power. Consequently, using only optical forces, stable trapping is not possible in the field of a nanofiber. The gradient force can be opposed, however, by electrostatic repulsion between charged surface groups on the particle and the fiber. The combination of gradient attraction and electrostatic repulsion then produces a potential well in the radial direction where the particle can be trapped. In the trap, position-dependent scattering from the particle decreases the transmitted power collected at the photodetector Zhu-2011 , allowing precise measurement of particle’s position provided that the evanescent field profile is known. Perturbations in the particle’s position, such as those resulting from forces applied by nearby biomolecules, could then be easily detected to perform force spectroscopy on individual biomolecules present in between the nanofiber surface and the trapped particle.
The scattered power from a single nanoparticle is given by the product of the incident field intensity with the particle’s scattering cross-section :
| (1) |
where is the speed of light, is permittivity of free space and is the squared modulus of the electric field at the particle position . To maximize the electric field magnitude at the surface of the nanofiber, the electric field distribution of the HE11 mode of a nanofiber in water was calculated as a function of diameter using finite element modeling software COMSOL Multiphysics 3.4, with the result for a 500 nm diameter fiber shown in Fig. 1(b). As the diameter of the nanofiber is decreased, the fraction of evanescent power increases (see red dashed curve in Fig. 1(c)). However, the width of the optical mode also increases and consequently the maximum evanescent amplitude occurs at an intermediate nanofiber diameter. As shown in Fig. 1(c), the model predicts the evanescent amplitude to be within 5% of the maximum over a range of diameters from 390 to 570 nm, with the maximum occurring at approximately 460 nm. In this work, nanofibers 500 nm in diameter were fabricated by stretching standard 630 nm single-mode fiber under a H2 torch until the measured transmission was single-mode and the diameter reached 500 nm as confirmed by scanning electron microscopy.
Fig. 1(a) illustrates the experimental trapping setup. Light from a fiber-coupled laser source ( = 630 nm) was guided into the tapered nanofiber and the transmitted light was collected on a photodetector and analyzed on an oscilloscope at a sampling rate of 5 kHz. By bringing the nanofiber into close proximity with a glass coverslip, a L-sized droplet of pure water completely immerses the nanofiber as shown in Fig. 1(a). A dilute solution of 300 nm silica-coated Fe2O3 nanospheres (density of 200 g/cm3; np = = 2.42) was then added to the droplet, and the nanofiber’s transmitted light was recorded on the oscilloscope.

Fig. 2(a) shows the detected light transmitted through the nanofiber after addition of the nanoparticles. Sharp drops in the tranmission are seen as the nanoparticles enter the evanescent field of the fiber and are trapped by the combined electrostatic and optical forces. Ultimately, however, the nanoparticles are repelled from the fiber surface due to electrostatic repulsion. The total duration of this experiment was 155 seconds, in which about 130 trapping events occured before evaporation of the liquid droplet was evident in the nanofiber’s transmitted light. Fig. 2(b) shows a magnified image of a single trapping event. The scattered power fluctuates over a duration of about 1 second before the nanoparticle diffuses away. By considering the position dependence of the scattered power (Eq. 1), these fluctuations can be understood as Brownian motion of the trapped nanoparticle that is read-out optically via the intensity of the fiber’s transmitted light. The position of the nanoparticle can be extracted from the normalized power scattered by the nanoparticle using the relation Arnold-2009 , where is the wavenumber and is the effective refractive index of a 500 nm HE11 mode in water. Following Ref. Arnold-2009 , the maximum scattered power observed for a given trapping event is taken to conincide with the nanoparticle being in contact with the fiber. Taking a histogram of then gives the probability distribution of the nanoparticle’s position, from which the potential energy of the trap can be calculated from the equipartition theorem Neuman-2004 ; Arnold-2009 . The calculated trap potential is shown in Fig. 2(c) for a representative single nanoparticle event. We numerically fit this data to a sum two exponentials (shown as the solid red line), which reveals an anharmonic trap with a depth of 5.5 , confining the nanoparticle approximately 78.4 nm away from the fiber surface. We also calculate the expected gradient potential (shown as the dashed black line) for our nanofiber, where the calculated field intensity is normalized for an input power of 810 W. Good agreement is found between the calculated potential and the numerical fit.
Since stable trapping is facilitated by a repulsive electrostatic force, the properties of the trap may be controlled by modifying the surface chemistry of the nanofiber. We demonstrate this here by introducing 1 nM of NaCl into the nanoparticle solution. Fig. 2(d) shows the intensity of transmitted light as a single nanoparticle diffuses into the optical field and is trapped near the fiber in NaCl solution. The addition of NaCl reduces the electrostatic repulsion between surface groups Arnold-2009 , thereby increasing the trap depth to 7.4 and trapping the nanoparticle closer to the fiber surface (about 50 nm away). In this case the duration of the optical trap was increased to 4.5 seconds and, in contrast to trapping without surface chemistry modification, the nanoparticle eventually binds to the fiber surface.
By differentiating the numerical fits to the trapping potentials with and without surface chemistry modification, we obtain the applied forces shown in Fig. 2(e). From these we can obtain estimates of the trapping stability. As expected, reduction of the electrostatic force via NaCl screening led to an increase in the optical gradient force, since the particle is trapped closer to the fiber surface. We also observe an improvement in the trap stiffness, which is given by the slope of the force-distance curve at the position where the particle is trapped. For purified water, the maximum gradient force was 0.10 pN and the stiffness was 1.3 pN m-1. With NaCl, however, these values increased to 0.14 pN and 2.7 pN m-1, respectively. It is interesting to compare these forces with those which are possible in a conventional optical tweezer trap (NA = 1) with identical particles and optical power. Using the toolbox described in Ref. Nieminen-2007 , we find that for these conditions the maximum trapping force is less than 0.01 pN. Thus, the strong evanescent field of a nanofiber tweezer improves the optical trapping forces by a factor of approximately 14. We note that the use of layered nanoparticles with a high-refractive-index core produces larger trapping forces than what is achievable with lower refractive-index probes such as polystyrene Jannasch-2012 . Moreover, the high-refractive-index of the nanoparticles used in this work results in a larger scattering cross-section through Eq. 1, thus improving the optical read-out of the trapped particle’s position. The maximum electrostatic force applied in the nanofiber tweezer was -0.5 pN, a factor of 50 greater than that possible in conventional optical tweezers. Since electrostatic forces scale with particle area, while optical scattering forces scale with volume squared, one would expect electrostatic forces to scale much more favorably for smaller particle sizes. This improved scaling could be relevant for biological situations in which both low optical power and strong trapping forces are desirable. Furthermore, while we have carried out these experiments with Fe2O3 nanoparticles, even larger optical forces could be expected for plasmonic nanoparticles (e.g., gold) due to their enhanced polarizability Swaim-2011 .
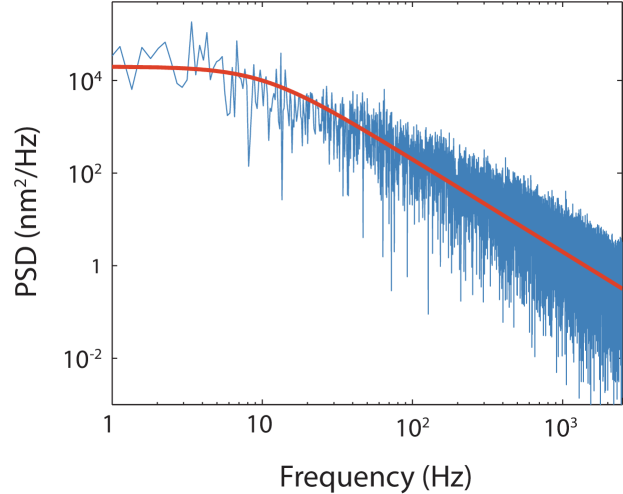
Lastly, we calculate the power spectal density (PSD) of the position fluctuations from the nanoparticle trapped in Fig. 2(c). Shown in Fig. 3, the calculated PSD reveals a characteristic Brownian motion spectrum, with a corner frequency of about 10 Hz, which is well matched to a Lorentzian fit. At 2.5 kHz, the position sensitivity is 3.4 , which is comparable to the best sensitivities previously reported for similar sized nanoparticles Neuman-2008 and noteworthy given that it was achieved without optimization.
In conclusion, we have shown that the combination of attractive optical gradient forces and repulsive electrostatic forces allows trapping of nanoparticles with a tapered nanofiber. Electrostatic forces are independent of optical power and scale with the nanoparticle’s area, providing a better scaling of trap strength with nanoparticle size than that in conventional optical tweezers. This allows trapping of particles with forces that are a factor of 50 larger than what is possible conventional optical tweezers. We expect that nanofibers could find applications in single molecule force spectroscopy, where large forces are desirable to study complex biological structures and low power is needed to reduce the risk of damaging the sample.
The authors would like to acknowledge Jiangang Zhu for helpful discussions on tapered optical fibers, David Thompson for his knowledge of nanoparticle interactions, and the Australian Research Council for funding (Grant No. DP0987146).
References
- (1) W. J. Greenleaf and S. M. Block. Science 5, 801 (2006)
- (2) K. C. Neuman and A. Nagy. Nature Methods 5, 491 - 505 (2008)
- (3) F. Vollmer, D. Braun, A. Libchaber, M. Khoshima, I. Teraoka and S. Arnold. Applied Physics Letters 80, 80, 4057-4059 (2002)
- (4) S. Arnold, D. Keng, S. I. Shopova, S. Holler, W. Zurawsky and F. Vollmer. Optics Express 17 8 (2009)
- (5) A. M. Armani, R. P. Kulkarni, S. E. Fraser, R. C. Flag
- (6) A. H. J. Yang, S. D. Moore, B. S. Schmidt, M. Klug, M. Lipson and D. Erickson. Nature 457, 71-75 (2009)
- (7) A. Jannasch, A. F. Demirors, P. D. J. van Oostrum, A. van Blaaderen and E. Schaffer. Nature Photonics 6 469 - 473 (2012)
- (8) N. B. Simpson, D. McGloin, K. Dholakia, L. Allen and M. J. Padgett. Journal of Modern Optics 45, 9 (1998)
- (9) S. N. Reihani and L. B. Oddershede. Optics Letters. 32 1998–2000 (2007).
- (10) M. Mahamdeh, C. P. Campos and E. Schaffer. Optics Express 19 1759–11768 (2011).
- (11) V. Bormuth, A. Jannasch, M. Ander, C. M. van Kats, A. van Blaaderen, J. Howard and E. Schäffer. Optics Express 16 13831–13844 (2008)
- (12) S. M. Block, L. S. Goldstein, B. J. Schnapp. Nature 348 348-352 (1990)
- (13) M. D. Wang, H. Yin, R. Landick, J. Gelles and S. M. Block. Biophysics Journal 72 1335 - 1346 (1997)
- (14) C. Bustamante. Q. Rev. Biophys. 38, 291–301 (2005)
- (15) M. L. Juan, M. Righini and R. Quidant. Nature Photonics 5, 349–356 (2011)
- (16) S. Lin, E. Schonbrun and K. Crozier. Nano Letters 10, 2408-2411 (2010)
- (17) S. Mandal, X. Serey, and D. Erickson. Nano Letters 10, 99-104 (2010)
- (18) J. D. Swaim, J. Knittel and W. P. Bowen. Applied Physics Letters 99, 243109 (2011)
- (19) J. Zhu, S. K. Ozdemir and L. Yang. IEEE Photonics Technologty Letters 23, 1346-1348 (2011)
- (20) D. Erickson, X. Serey, Y. Chenac and S. Mandala. Lab on a Chip 11, 995 (2011)
- (21) C. F. Bohren and D. R. Huffman. Absorption and scattering of light by small particles. Wiley-Interscience, New York, 1983
- (22) K. C. Neuman and S. M. Block. Rev. Sci. Instrum. 75, 2787 - 2809 (2004)
- (23) H. Xin, R. Xu and B. Li. Scientific Reports 2, 818 (2012)
- (24) Z. Liu, C. Guo, J. Yang and L. Yuan. Optics Express 14 12510 - 12516 (2006)
- (25) T. A. Nieminen, V. L. Y. Loke, A. B. Stilgoe, G. Knöner, A. M. Branczyk, N. R. Heckenberg, and H. Rubinsztein-Dunlop. Journal of Optics A 9, S196-S203 (2007)
- (26) M. A. Taylor, J. Janousek, V. Daria, J. Knittel, B. Hage, H-A. Bachor and W. P. Bowen. Nature Photonics 7 229 - 233 (2013)