Depleted cores, multi-component fits, and structural parameter relations for luminous early-type galaxies
Abstract
New surface brightness profiles from 26 early-type galaxies with suspected partially depleted cores have been extracted from the full radial extent of Hubble Space Telescope images. We have carefully quantified the radial stellar distributions of the elliptical galaxies using the core-Sérsic model whereas for the lenticular galaxies a core-Sérsic bulge plus an exponential disc model gives the best representation. We additionally caution about the use of excessive multiple Sérsic functions for decomposing galaxies and compare with past fits in the literature. The structural parameters obtained from our fitted models are in general, in good agreement with our initial study using radially limited () profiles, and are used here to update several “central” as well as “global” galaxy scaling relations. We find near-linear relations between the break radius and the spheroid luminosity such that , and with the supermassive black hole mass such that . This is internally consistent with the notion that major, dry mergers add the stellar and black hole mass in equal proportion, i.e., . In addition, we observe a linear relation for the core-Sérsic elliptical galaxies—where is the galaxies’ effective half light radii—which is collectively consistent with the approximately-linear, bright-end of the curved relation. Finally, we measure accurate stellar mass deficits that are in general 0.5 , and we identify two galaxies (NGC 1399, NGC 5061) that, due to their high ratio, may have experienced oscillatory core-passage by a (gravitational radiation)-kicked black hole. The galaxy scaling relations and stellar mass deficits favor core-Sérsic galaxy formation through a few “dry” major merger events involving supermassive black holes such that , for .
keywords:
galaxies: elliptical and lenticular, cD – galaxies: fundamental parameters – galaxies: nuclei – galaxies: photometry – galaxies: structure1 Introduction
Within the hierarchical model of the Universe, galaxy mergers are thought to be the main formation channel for the build up of massive elliptical galaxies. These, and fainter, galaxies are known to host a supermassive black hole (SMBH) at their centre (Magorrian et al. 1998; Richstone et al. 1998; Ferrarese & Ford 2005, and references therein). It has therefore been hypothesized that the depleted cores in core-Sérsic111A “core-Sérsic” galaxy (Graham et al. 2003) has a central deficit relative to the inward extrapolation of the elliptical galaxy’s or bulge’s outer Sérsic (1963) profile. As such, it is not equivalent to the “core” galaxy (Lauer et al. 1995) classification. A Sérsic galaxy has no such central deficit. galaxies are due to the action of coalescing black hole binaries which are produced in major, dissipationless (gas free or “dry”) mergers of galaxies (e.g., Begelman et al. 1980; Ebisuzaki et al. 1991; Milosavljević & Merritt 2001; Merritt 2006). Indeed, observations have found binary SMBHs at kpc separation (e.g., NGC 6240, Komossa et al. 2003; Arp 299, Ballo et al. 2004; 0402+379, Rodriguez et al. 2006; Mrk 463, Bianchi et al. 2008), and slowly more are being found at closer separations (e.g., Burke-Spolaor 2011; Ju et al. 2013; Liu et al. 2014). In such a scenario, three-body interactions involving stars and the SMBH binary would decay the SMBH binary orbit via the slingshot ejection of stars from the centres of the “dry” galaxy merger remnant, naturally creating the observed central stellar light (mass) deficits in giant elliptical galaxies and bulges (e.g., King & Minkowski 1966; King 1978; Binney & Mamon 1982; Lauer 1985; Kormendy 1985; Crane et al. 1993; Ferrarese et al. 1994, 2006; Lauer et al. 1995; Byun et al. 1996; Faber et al. 1997; Carollo et al. 1997b).
Numerical simulations targeting the evolution of massive black hole binaries have predicted that the central stellar mass deficit, , of a core-Sérsic galaxy, i.e., the ejected stellar mass, scales with the mass of the SMBH binary and the number of (equivalent) major “dry” mergers that the galaxy has experienced (e.g., Milosavljević & Merritt 2001; Merritt 2006). Other theoretical studies have proposed enhanced mass deficits as large as 5 as a result of additional stellar ejections from repetitive core passages of “recoiled” SMBHs (e.g., Boylan-Kolchin et al. 2004; Gualandris & Merritt 2008), or due to the actions of multiple SMBHs from merging galaxies (Kulkarni & Loeb 2012).
Tight scaling relations involving the structural parameters of both core-Sérsic and Sérsic galaxies have been shown to exist (e.g., Graham 2013 and references therein). While these correlations can yield clues to the processes of galaxy formation and evolution, the reliability of this approach depends on the robustness of the modelling employed for deriving the structural parameters. Although the parameters of the Nuker model (Grillmair et al. 1994; Kormendy et al. 1994; Lauer et al. 1995) are known to vary with the fitted radial extent of the light profile, due to the fact that the straight outer power-law profile of the Nuker model fails to capture the curved (Sérsic) surface brightness profiles of galaxies beyond their core region (Graham et al. 2003; Dullo & Graham 2012), a work around has been suggested. Applying the Nuker model to the light profiles of 120 “core” galaxies, Lauer et al. (2007a) noted that the Nuker model break radii () are only roughly correlated with the galaxy properties. However, they identified a better correlated parameter (the “cusp radius”) as a measure of the core size (Carollo et al. 1997a; Rest et al. 2001). Dullo & Graham (2012) subsequently showed that this cusp radius closely matches the break radius of the core-Sérsic model which we employ here222Trujillo et al. (2004), Ferrarese et al. (2006), Richings et al. (2011) and Dullo & Graham (2012, 2013) revealed that the Nuker model break radii () are typically two times bigger than the core-Sérsic model break radii which are defined relative to the inward extrapolation of the outer Sérsic function.. Fitting this model additionally enables us to determine a galaxy’s global structural parameters such as its luminosity and half light radius, and to measure the central stellar deficit relative to the outer Sérsic profile.
As noted by Graham et al. (2003), the issue is not only measuring the core sizes of core-Sérsic galaxies, but also the misclassification of coreless “Sérsic” galaxies as galaxies having partially depleted cores. Using the core-Sérsic model, Dullo & Graham (2012) found that 18 of their sample of 39 galaxies which were previously alleged to have depleted cores according to the Nuker model were actually Sérsic galaxies with no cores. Although Lauer (2012) subsequently reported that the core identification disagreement between the Nuker model and the core-Sérsic model was only at the level of , Dullo & Graham (2013, their Appendix A.2) revisited and confirmed the 18% disagreement. In some cases, additional nuclear components show up as an excess relative to the outer Sérsic profile, yet these components’ shallow inner profile resulted in the Nuker model labelling them as “core” galaxies.
In this paper we analyse the 26 suspected core-Sérsic elliptical galaxies, presenting new light profiles which cover a large radial range . Our sample selection, data reduction, and light profile extraction technique are discussed in Section 2. In Section 3 we outline our fitting analysis, provide our results, and additionally compare them to those from published works, paying attention to the issue of double, triple and higher Sérsic model fits.
In Section 4, we present updated structural parameters and scaling relations, including central and global properties, of core-Sérsic early-type galaxies. In Section 5.1 we discuss the connection between the galaxy core size and the black hole mass. In Section 5.2, we discuss the methodology that is applied to derive the stellar mass deficits in the core-Sérsic early-type galaxies, and in Section 5.3 we then compare our mass deficits with past measurements. Finally, Section 5.4 discusses alternative scenarios which have been presented in the literature for generating cores in luminous galaxies. Our main conclusions are summarised in Section 6.
We include three appendices at the end of this paper. The first presents the core-Sérsic model fits for all 26 galaxies together with a review on two galaxies with complicated structures. Notes on five suspected lenticular galaxies with a bulge plus disc stellar light distribution are given in the second appendix, while the third Appendix provides a comparison between this work and modelling by others of common light profiles. In so doing we highlight a number of issues in the literature today that are important but currently poorly recognised.
| Galaxy | Type | D | HST | ||
|---|---|---|---|---|---|
| (mag) | (Mpc) | (km s-1) | Filters | ||
| (1) | (2) | (3) | (4) | (5) | (6) |
| NGC 0507w | S0 | 306 | F555W | ||
| NGC 0584w | Ed | 206 | F555W | ||
| NGC 0741w | E | 291 | F555W | ||
| NGC 1016w | E | 302 | F555W | ||
| NGC 1399A | E | 342 | F475W/F814W | ||
| NGC 1700w | E | 239 | F555W | ||
| NGC 2300w | S0 | 261 | F555W | ||
| NGC 3379w | E | 209 | F555W | ||
| NGC 3608w | E | 192 | F555W | ||
| NGC 3640w | E | 182 | F555W | ||
| NGC 3706w | E | 270 | F555W | ||
| NGC 3842w | E | 314 | F555W | ||
| NGC 4073w | cDd | 275 | F555W | ||
| NGC 4278A | E | 237 | F475W/F850LP | ||
| NGC 4291w | E | 285 | F555W | ||
| NGC 4365A | E | 256 | F475W/F850LP | ||
| NGC 4382A | S0 | 179 | F475W/F850LP | ||
| NGC 4406A | E | 235 | F475W/F850LP | ||
| NGC 4472A | Ed | 294 | F475W/F850LP | ||
| NGC 4552A | Ed | 253 | F475W/F850LP | ||
| NGC 4589w | E | 224 | F555W | ||
| NGC 4649A | E | 335 | F475W/F850LP | ||
| NGC 5061w | E | 186 | F555W | ||
| NGC 5419w | Ed | 351 | F555W | ||
| NGC 5557w | E | 253 | F555W | ||
| NGC 5813w | S0 | 237 | F555W | ||
| NGC 5982w | E | 239 | F555W | ||
| NGC 6849w | SB0 | 209 | F555W | ||
| NGC 6876w | E | 229 | F555W | ||
| NGC 7619w | E | 323 | F555W | ||
| NGC 7785w | E | 255 | F555W |
Notes.—Col. (1) Galaxy name. Instrument: HST WFPC2; HST ACS. Col. (2) Morphological classification from the NASA/IPAC Extragalactic Database (NED)333(http://nedwww.ipac.caltech.edu) except for NGC 3706 and NGC 5813. We adopt an elliptical morphology for NGC 3706 based on the results in Dullo & Graham (2013), while for NGC 5813 we adopt an S0 morphology based on the fitting analysis as well as the photometric profile (Section 3, Appendices A and C). The superscript shows elliptical galaxies which are classified as disc galaxies in the literature (Appendix C). Col. (3) Absolute V-band (galaxy or bulge) magnitude obtained from Lauer et al. (2007b). These magnitudes are corrected for Galactic extinction and surface brightness dimming, and adjusted using the distances from col. (4). The five bulge magnitude are additionally corrected for inclination and internal dust attenuation (Driver et al. 2008, their Table 1 and Eqs. 1 and 2). Sources: () Tonry et al. (2001) after reducing their distance moduli by 0.06 mag (Blakeslee et al. 2002); () from NED (3K CMB). Col. (5) Central velocity dispersion from HyperLeda444(http://leda.univ-lyon1.fr) (Paturel et al. 2003). Col. (6) Filters.
2 Data
2.1 Sample selection
As noted above, in this paper we have targeted 26 suspected core-Sérsic elliptical galaxies from Dullo & Graham (2012) using more radially extended light profiles. We additionally use the data for the five core-Sérsic galaxies (NGC 507, NGC 2300, NGC 3706, NGC 4382 and NGC 6849) from Dullo & Graham (2013) excluding NGC 3607 because of its dusty nuclear spiral which affected the recovery of the structural parameters as detailed there. Updated magnitudes, distances and velocity dispersions pertaining to this combined sample of 31 core-Sérsic early-type galaxies are presented in Table 1.
2.2 Galaxy imaging
The HST images for the 26 core-Sérsic elliptical galaxies, observed with the ACS and/or WFPC2 cameras were taken from the public Hubble Legacy Archive (HLA)555http://hla.stsci.edu. Although both the ACS (plate scale of ) and the WFPC2 (plate scale of ) cameras have comparable high spatial resolution, the ACS Wide Field Channel (WFC) has a larger, rhomboidal field-of-view (FOV) of compared to that of the WFPC2 CCD array (160160 L-shaped FOV). We therefore prefer the ACS/F475W ( SDSS ) and ACS/F850LP ( SDSS ) images when available. For NGC 1399, these were not available, and we instead used the ACS/F475W ( SDSS ) and ACS/F814W (similar to the Johnson-Cousins -band) images. For the other galaxies where the ACS images were not available we use the WFPC2 images taken in the F555W filter (similar to the Johnson-Cousins V-band). Table 1 provides the observation summaries including the programs, instruments and filters used for imaging our sample galaxies.
2.3 Surface brightness profiles
As in Dullo & Graham (2013), we build new, composite light profiles for all the 26 core-Sérsic elliptical galaxies by combining the Lauer et al. (2005) very inner () deconvolved F555W ( -band) light profiles with our new (calibrated -band) major-axis light profiles (see below). We have chosen to use the inner deconvolved light profile from Lauer et al. (2005) so that differences in the core parameters between our works are not attributed to the use of different treatments of the PSF, but rather the application of the Nuker versus the core-Sérsic model. The new outer profiles are extracted using the IRAF/ellipse task (Jedrzejewski 1987) and cover in radius. Our data reduction steps, along with the surface brightness profile extraction procedures, are discussed in detail in Sections and of Dullo & Graham (2013).
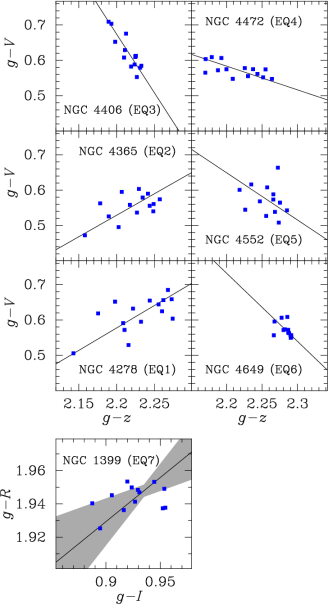
In order to match the ACS and -band data with the very inner Lauer et al. (2005) deconvolved -band data, we made color transformations for the six galaxies without -band data (NGC 4278, NGC 4365, NGC 4406, NGC 4472, NGC 4552 and NGC 4649) using Eqs. 16 which were derived here by applying a least-squares fit to each galaxy’s and data (see also Dullo & Graham 2013 and references therein for a similar practice). For NGC 1399, Lauer et al. (2005) published this galaxy’s F606W (roughly -band) light profile, thus we calibrate our ACS - and -band data to the -band light profile using Eq. 7. Fig. 1 illustrates these linear fits to the above seven sample galaxies for which the ACS Wide Field Channel (WFC) images are available, as listed in Table 1.
| (1) |
| (2) |
| (3) |
| (4) |
| (5) |
| (6) |
| (7) |
2.3.1 Sky background determination
Accurate sky level subtraction is of critical importance when determining the surface brightness profile of a galaxy at large radii. The galaxy flux is often just a few percent of the sky background values in the outermost parts. The automatic HLA reduction pipeline subtracts the sky values from the images. Thus, poor sky subtraction is a concern for galaxies which extend beyond the HST WFPC2 and ACS FOVs. However, reliable sky background determination can be done for galaxies with mag arcsec-2 diameters . Not only do the bulk of these galaxies lie within the WFPC2 and ACS FOVs but their “counts” at the edges of the WFPC2/ACS CCDs are about 10% fainter than the typical HST -band sky value mag arcsec-2 (Lauer et al. 2005). Eight of the 31 sample galaxies (NGC 1399, NGC 3379, NGC 4365, NGC 4382, NGC 4406, NGC 4472, NGC 4552 and NGC 4649) have major-axis diameter (at mag arcsec-2) (Graham et al. 1998; Smith et al. 2000; Trager et al. 2000). Fortunately, all these galaxies except two (NGC 1399 and NGC 3379) have published composite (ACS plus ground-based) data (Ferrarese et al. 2006; Kormendy et al. 2009). The ground-based data enabled these authors to better constrain the sky level. For NGC 3379, Schombert & Smith (2012) published an extended () ground-based profile and for NGC 1399, Li et al. (2011) published a very extended ground-based light profile. Our HST-derived light profiles for all eight extended galaxies are in a good agreement with those past published profiles, suggesting only a small or negligible sky subtraction error by the pipeline.
For the remaining galaxies, we additionally checked the pipeline sky subtraction by measuring the sky values at the edges of the WFPC2 and ACS chips , i.e., away from the galaxy and free of contaminating sources. As expected, the average of the median of the sky values from several 10 10 pixel boxes is very close to zero for most galaxies. For a few galaxies, we find that the average values are slightly below zero even if these galaxies are well within the FOV of the WFPC2 or ACS. Therefore, we adjust the background level to zero.
3 Fitting analysis
3.1 Models for core-Sérsic elliptical galaxies
In general, the three-parameter Sérsic (1968) model, a generalization of the de Vaucouleurs (1948) model, is known to provide accurate representations to the stellar light distributions of both elliptical galaxies and the bulges of disc galaxies over a large luminosity and radial range (e.g., Caon et al. 1993; D’Onofrio et al. 1994; Young & Currie 1994; Andredakis et al. 1995; Graham et al. 1996). However, because the model was very popular, even referred to by many as the law, Saglia et al. (1997) attempted to explain the observed light profiles as the sum of models and exponential discs. While this approach had some merit, in that pressure-supported elliptical galaxies are becoming increasingly rare, and in fact many intermediate luminosity early-type galaxies possess rotating discs (e.g., Graham et al. 1998; Emsellem et al. 2011; Scott et al. 2014), we now know that lenticular galaxies are very well described by an bulge plus an exponential disc which can often additionally contain a bar and/or a lens (e.g. Laurikainen et al. 2013, and references therein). The Sérsic model’s radial intensity distribution can be written as
| (8) |
where is the intensity at the half-light radius . The variable , for (e.g., Caon et al. 1993), is coupled to the Sérsic index , and ensures that the half-light radius encloses half of the total luminosity. The luminosity of the Sérsic model within any radius is given by
| (9) |
where is the incomplete gamma function and . The review by Graham & Driver (2005) describes the Sérsic model in greater detail.
The Sérsic model fits the surface brightness profiles of the low- and intermediate-luminosity ( mag) spheroids all the way to the very inner region. Although, additional nuclear components are often present in these galaxies and require their own model (e.g., Graham & Guzmán 2003; Côté et al. 2006; den Brok et al. 2014). On the other hand, the inner light profiles of luminous ( mag) spheroids deviate downward from the inward extrapolation of their outer Sérsic model fits (Graham et al. 2003; Trujillo et al. 2004; Ferrarese et al. 2006). In order to describe such galaxies’ light distributions, Graham et al. (2003) introduced the core-Sérsic model which is a combination of an inner power-law with an outer Sérsic model. This six-parameter model is defined as
| (10) |
with
| (11) |
is intensity measured at the core break radius , is the slope of the inner power-law profile, and controls the sharpness of the transition between the inner power-law and the outer Sérsic profile. represents the half-light radius of the outer Sérsic model, and the quantity has the same meaning as in the Sérsic model (Eq. 8). The total core-Sérsic model luminosity (Trujillo et al. 2004; their Eq. A19) is
| (12) |
3.2 Application
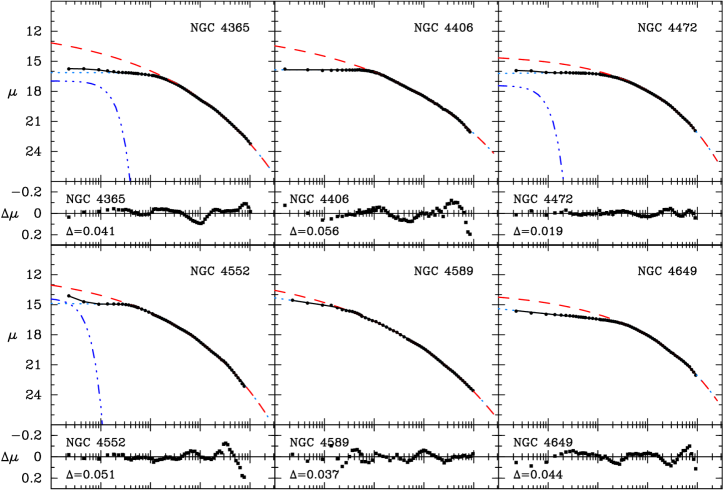
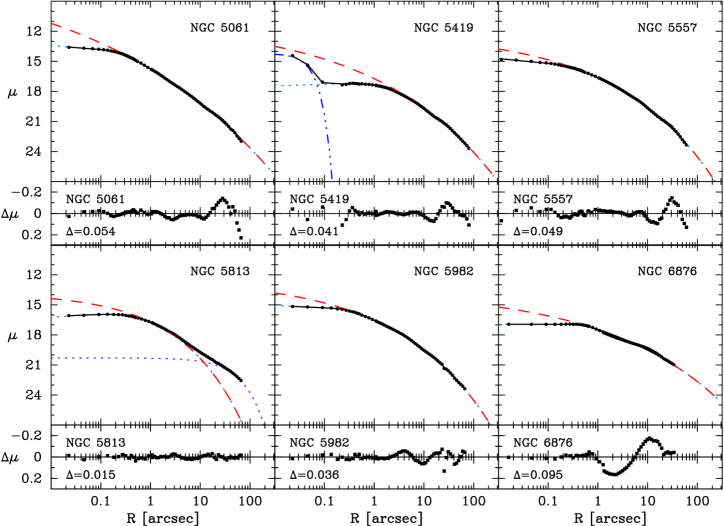
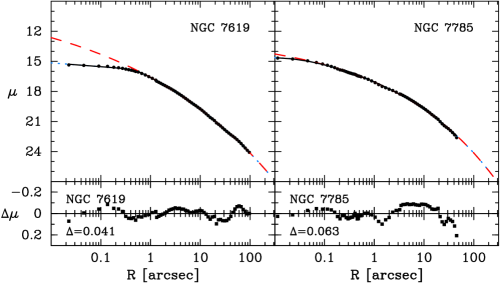
Fig. A1 shows our core-Sérsic model fit to the underlying host galaxy, major-axis, light distributions for all 26 galaxies. The fit residuals together with their root-mean-square (rms) values are given for each galaxy in Appendix A. We find that the light profile for one of these suspected elliptical galaxies (NGC 5813; see Appendices A and C) is better described with a core-Sérsic bulge plus an exponential disc model, suggesting an S0 morphology as discussed later. We note that this galaxy’s large-scale disc had negligible contribution to the Dullo & Graham (2012) light profile fit. Further, in agreement with Dullo & Graham (2012), we also detect additional nuclear light components (i.e., AGN or nuclear star clusters) on the top of the underlying core-Sérsic light distributions in six galaxies (NGC 741, NGC 4278, NGC 4365, NGC 4472, NGC 4552, and NGC 5419). We account for these nuclear light excesses using a Gaussian function.
Dullo & Graham (2013) presented the core-Sérsic(+exponential) model fits, along with the fit parameters, to five galaxies (NGC 507, NGC 2300, NGC 3706, NGC 4382 and NGC 6849). Table 2 presents the best fit structural parameters for the full (26+5=)31 galaxy sample obtained by applying our adopted models to the -band, major-axis, light profiles probing large radial ranges ().
In general, from Appendix A it is apparent that the main body of luminous ellipticals can be very well described with the core-Sérsic model. Our fits yield a median root-mean-square (rms) residual of mag arcsec-2. Out of the full galaxy sample, only two elliptical galaxies (NGC 4073 and NGC 6876) reveal complicated structures, as such their light profiles, discussed in Appendix A, are somewhat poorly matched by the core-Sérsic model.

3.2.1 NGC 1700, NGC 3640 and NGC 7785
For three sample elliptical galaxies NGC 1700, NGC 3640 and NGC 7785, while their light profiles are well fit by the core-Sérsic model with reasonable rms residuals mag arcsec-2, we find that their cores are unusually small for their brightnesses. The core-Sérsic model yields break radii of and for NGC 1700, NGC 3640, and NGC 7785, respectively. Not surprisingly, in Section 4, it can be seen that these three questionable cores are outliers in several galaxy scaling relations involving , , , and and as such they have not been included in the regression analysis. For the interested reader, these galaxies are discussed in more detail in Appendix B.
| Galaxy | Type | ||||||||||||
| (arcsec) | (pc) | (arcsec) | (kpc) | (mag) | (arcsec) | ||||||||
| (1) | (2) | (3) | (4) | (5) | (6) | (7) | (8) | (9) | (10) | (11) | (12) | (13) | (14) |
| NGC 0507∗ | S0 | 16.16 | 16.38 | 0.33 | 102 | 0.07 | 5 | 2.2 | 5.3 | 1.65 | 21.03 | 27.69 | |
| NGC 0584 | Ed | 13.81 | 14.61 | 0.21 | 21 | 0.47 | 5 | 6.6 | 112.5 | 11.25 | |||
| NGC 0741 | E | 16.83 | 17.52 | 0.76 | 267 | 0.19 | 5 | 7.4 | 53.0 | 18.60 | 22.1 | ||
| NGC 1016 | E | 16.35 | 17.00 | 0.48 | 204 | 0.15 | 2 | 5.2 | 41.7 | 17.79 | |||
| NGC 1399+ | E | 15.45 | 16.36 | 2.30 | 202 | 0.11 | 2 | 5.6 | 36.6 | 3.22 | |||
| NGC 1700? | E | 13.34 | 13.38 | 0.04 | 11 | 0.19 | 5 | 6.1 | 32.0 | 8.23 | |||
| NGC 2300∗ | S0 | 16.23 | 16.61 | 0.53 | 70 | 0.08 | 2 | 2.2 | 7.7 | 1.02 | 20.39 | 21.08 | |
| NGC 3379 | E | 14.76 | 15.76 | 1.21 | 102 | 0.19 | 2 | 5.9 | 50.2 | 4.21 | |||
| NGC 3608 | E | 14.56 | 15.14 | 0.23 | 24 | 0.29 | 5 | 6.4 | 68.7 | 7.28 | |||
| NGC 3640? | E | 14.80 | 14.72 | 0.03 | 4 | -0.01 | 5 | 3.5 | 28.0 | 2.99 | |||
| NGC 3706∗ | E | 14.15 | 14.16 | 0.11 | 24 | -0.02 | 10 | 6.4 | 42.1 | 9.18 | |||
| NGC 3842 | E | 16.73 | 17.42 | 0.72 | 315 | 0.19 | 5 | 6.9 | 102.4 | 45.17 | |||
| NGC 4073 | cDd | 16.51 | 16.46 | 0.22 | 90 | -0.06 | 10 | 6.1 | 141.6 | 58.61 | |||
| NGC 4278 | E | 15.07 | 15.84 | 0.83 | 52 | 0.22 | 5 | 3.8 | 20.2 | 1.25 | 19.4 | ||
| NGC 4291 | E | 14.87 | 15.14 | 0.30 | 36 | 0.10 | 5 | 4.4 | 13.6 | 1.64 | |||
| NGC 4365 | E | 16.14 | 16.50 | 1.21 | 127 | 0.00 | 2 | 4.8 | 47.3 | 4.97 | 20.2 | ||
| NGC 4382∗ | S0 | 14.82 | 15.01 | 0.27 | 24 | 0.07 | 5 | 2.7 | 11.1 | 0.99 | 19.50 | 35.07 | |
| NGC 4406 | E | 15.86 | 15.97 | 0.76 | 61 | 0.00 | 5 | 5.5 | 145.2 | 11.62 | |||
| NGC 4472 | Ed | 16.18 | 16.34 | 1.21 | 108 | -0.02 | 2 | 3.0 | 48.8 | 4.34 | 22.0 | ||
| NGC 4552 | Ed | 14.91 | 15.03 | 0.38 | 17 | 0.03 | 10 | 4.4 | 29.7 | 1.31 | 20.6 | ||
| NGC 4589 | E | 14.80 | 15.33 | 0.20 | 27 | 0.30 | 5 | 5.6 | 70.8 | 9.56 | |||
| NGC 4649 | E | 15.75 | 16.70 | 2.51 | 241 | 0.21 | 2 | 3.6 | 62.8 | 6.02 | |||
| NGC 5061 | E | 13.70 | 14.09 | 0.22 | 34 | 0.16 | 5 | 8.4 | 68.44 | 10.81 | |||
| NGC 5419 | Ed | 17.35 | 17.53 | 1.43 | 416 | -0.06 | 2 | 5.6 | 55.0 | 16.01 | 19.9 | ||
| NGC 5557 | E | 15.05 | 15.46 | 0.23 | 51 | 0.19 | 5 | 4.6 | 30.2 | 6.80 | |||
| NGC 5813 | S0 | 16.04 | 16.11 | 0.35 | 51 | -0.10 | 2 | 2.8 | 7.1 | 1.02 | 20.30 | 31.28 | |
| NGC 5982 | E | 15.22 | 15.48 | 0.25 | 51 | 0.09 | 5 | 4.3 | 26.8 | 5.45 | |||
| NGC 6849∗ | SB0 | 16.33 | 16.67 | 0.18 | 69 | 0.20 | 5 | 3.2 | 7.8 | 2.98 | 20.72 | 16.93 | |
| NGC 6876 | E | 17.00 | 16.98 | 0.45 | 119 | 0.00 | 10 | 5.9 | 250.0 | 65.8 | |||
| NGC 7619 | E | 15.41 | 15.93 | 0.49 | 109 | 0.16 | 5 | 7.2 | 72.2 | 16.23 | |||
| NGC 7785? | E | 14.98 | 14.76 | 0.03 | 5 | 0.00 | 10 | 4.9 | 55.1 | 12.63 |
Notes.—Structural parameters from fits to the -band major-axis surface brightness profiles (Appendix A). The superscript + indicates that we use an -band surface brightness profile instead of a -band surface brightness profile for NGC 1399. The superscript * shows (4S0s and 1E) galaxies for which the fit parameters are taken from Dullo & Graham (2013). A “?” is used to indicate three galaxies with questionable core sizes. Col. (1) Galaxy name. Col. (2) adopted morphological classification. The superscript shows elliptical galaxies which are classified as disc galaxies in the literature (Appendix C). Col. (3)-(11) Best-fit parameters from the core-Sérsic model, Eq. 10. Col. (12) Central point source apparent magnitude. Col. (13) Disc central surface brightness. Col. (14) Disc scale length. The surface brightnesses , and are in units of mag arcsec-2.

3.3 Comparison with core-Sérsic fits from the literature
Here we illustrate two diagrams comparing our values of and with those from similar studies in the literature. The agreement is generally good. We have gone to some effort to identify and explain all notable disagreements with past studies.
We have three core-Sérsic galaxies (NGC 4291, NGC 5557, and NGC 5982) in common with Trujillo et al. (2004) who used a radial extent of . NGC 1700 is also an overlapping galaxy but its light profile used by Trujillo et al. (2004) extends from to , thus they did not detect the questionably small core () that we potentially measure here. With the exception of NGC 1700, classified as a Sérsic galaxy by Trujillo et al. (2004), there is an excellent agreement between our break radii and those from Trujillo et al. (2004), see Fig. 2. Their Sérsic indices are also consistent for all four galaxies in common with our study, i.e. including NGC 1700 (Fig. 3).
There are six core-Sérsic galaxies (NGC 4365, NGC 4382, 4406, NGC 4472, NGC 4552 and 4649) in common with Ferrarese et al. (2006) who used a radial extent of . For these galaxies, the Ferrarese et al. (2006) geometric-mean, -band, break radii were taken and converted to major-axis values. We prefer their g-band than the z-band data as it more closely matches our -band data. The agreement between their break radii and our measurements are good except for three galaxies (NGC 4382, NGC 4552, and NGC 4472). The most discrepant (by more than 100%) is the S0 galaxy NGC 4382 but this is because it was modelled with a core-Sérsic+exponential model by Dullo & Graham (2013, their Fig. 3). Ferrarese et al. (2006) treated this galaxy as a single component system, and thus fit the bulge+disc light with just a core-Sérsic model, resulting in a systematically higher and value (Figs. 2 and 3, see also Dullo & Graham 2012, their Fig. 7). The core-Sérsic stellar light distributions of the remaining two elliptical galaxies666We note that NGC 4552 and NGC 4472 were classified as S0s by Laurikainen et al. (2011), see Appendix C. NGC 4552 and NGC 4472 have a broad and an intermediate (inner core)-to-(outer Sérsic) transition region, respectively, which are well described by the core-Sérsic model and values (Fig. A1). This in contrast to Ferrarese et al’s. sharp transition () core-Sérsic model fits which poorly match these two galaxies’ transition regions as can be seen by the systematic bump in their fit residuals. Due to this, we find a 70% discrepancy between the Ferrarese et al. (2006) break radii and ours for NGC 4552 and NGC 4472, much bigger than the uncertainty range of 10% quoted in Dullo & Graham (2012). However, Dullo & Graham (2012, their Fig. 7) already discussed the source of this discrepancy for NGC 4552.
Omitting the S0 galaxy NGC 4382, the agreement between the Sérsic indices of Ferrrarese et al. (2006) and ours is generally good. We note that of the data in Fig. 3 have a Sérsic index ratio within -30% and 25% of perfect agreement. This is in fair agreement with typical uncertainties of 25% reported for the Sérsic index (e.g., Caon et al. 1993) and is slightly better than the Allen et al. (2006) uncertainty range of 36%. It should be remembered that using different filters as well as modelling minor, major and geometric-mean axis profiles can yield different values for a galaxy (e.g., Caon et al. 1993; Ferrari et al. 2004; Kelvin et al. 2012).
We have six core-Sérsic galaxies (NGC 3379, NGC 3608, NGC 4278, NGC 4472, NGC 4552 and NGC 5813) in common with Richings et al. (2011) whose data extended to . Their break radii for these common galaxies agree with ours except for NGC 5813. NGC 5813 is a similar case to that of the S0 galaxy NGC 4382 noted above; it has a core-Sérsic bulge+exponential disc light distribution which was modelled using only the core-Sérsic model by Richings et al. (2011), thus they measured larger and values. Our Sérsic indices agree within 25% with Richings et al. (2011) for half of the six core-Sérsic galaxies in common, but for the remaining half (NGC 3379, NGC 4552 plus the S0 NGC 5813) there is more than a 40% discrepancy. For NGC 3379 and NGC 4552, the origin of this discrepancy appears to be the HST/NICMOS NIC2 F160W light profiles777The large ellipticals NGC 3379 and NGC 4552, each with a ( mag arcsec-2) major-axis diameter of , extend beyond the NICMOS NIC2 CDD. used by Richings et al. (2011). Their profiles for these two galaxies may be too limited in radius for the core-Sérsic model to capture the actual galaxy light distributions. Finally, we note that the elliptical galaxy NGC 5982 is also in common with Richings et al. (2011) who classified it as a Sérsic galaxy based on their Sérsic model fit to the NICMOS NIC2 F160W profile. It seems that Richings et al. (2011) might have missed the core with their Sérsic fit to this large elliptical galaxy with km s-1 and mag.
Kormendy et al. (2009) adopted Graham et al’s. (2003) logic of defining a core as a deficit in light relative to the inward extrapolation of a spheroid’s outer Sérsic profile, but they fit the major-axis light profiles of their core-Sérsic galaxies using only the Sérsic model. They advocate fitting the Sérsic model over the radius range where it fits well by eye and distinguishing the core region in a subjective manner. This exercise assumes no transition region between the inner core and the outer Sérsic profile, but actual galaxy profiles can have a broad transition region. As with the Nuker model, the “break radius” is not the outermost boundary of this transition region—controlled by the parameter —but the mid-point of the transition. The outer edge of the transition region is very hard to judge by eye, and highly subjective. We have six core-Sérsic galaxies (NGC 4365, NGC 4382, NGC 4406, NGC 4472, NGC 4552 and NGC 4649) in common with Kormendy et al. (2009). It is worth comparing the inner most Sérsic model fitting radius () from Kormendy et al. (2009) with our break radius () for these six overlapping galaxies: NGC 4365, NGC 4382, NGC 4406, NGC 4472, NGC 4552 and NGC 4649. As shown in Fig. 2, for each core-Sérsic galaxy in common with Kormendy et al. (2009), their are much further out than ours and part of the explanation likely arises from their method of not measuring the actual “break radii”. Fitting the core-Sérsic model provides this radius, the extent of the transition region, and the central flux deficit from within the outer-edge of the transition region.
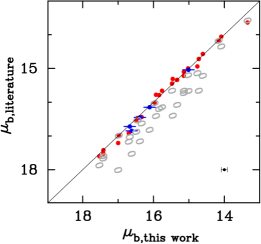
Figs. 2 and 4 additionally compare our break radii and break surface brightnesses, respectively, with those from Lauer et al. (2005) and Dullo & Graham (2012) for all 31 galaxies (including the three with questionable core in Appendix B). It is important to note that Lauer et al. (2005) fit the Nuker model to their galaxy light profiles, while Dullo & Graham (2012) re-modelled these using the core-Sérsic model. Our new break radii, determined from spatially extended () light profiles, are in excellent agreement with those from Dullo & Graham (2012), i.e., within the uncertainty range, except for NGC 1700 and NGC 2300. NGC 1700 is an elliptical galaxy with a questionably small core mentioned earlier (see Section 4 and Section B.1 for further details), while for the S0 galaxy NGC 2300, as noted in Dullo & Graham (2013), the contribution of the disc light to the light profile modeled by Dullo & Graham (2012) resulted in a bigger break radius and Sérsic index. Given the remarkable agreement between the core-Sérsic break radii of Dullo & Graham (2012) and those from their model-independent estimates (their Fig. 11), it implies that our break radii from this work (Table 2) are also in a very good agreement with the model-independent radii where the slope of the logarithmic profile equals -1/2 (Carollo et al. 1997a). In addition, as can be seen in Fig. 4, our new break surface brightnesses fully agree with those from Dullo & Graham (2012).
On the other hand, in line with previous core-Sérsic works, we find the Nuker model break radii are larger (Fig. 2). The Nuker break radii (e.g., Lauer et al. 2005, 2007a, b; Krajnović et al. 2013) are on average two times bigger than our core-Sérsic break radii. In estimating larger break radii, the Nuker model consequently estimates the associated surface brightness up to 2 mag arcsec-2 fainter (Fig. 4).
3.4 Multi-component model fits for core-Sérsic galaxies
Hopkins et al. (2009a, b) fit the surface brightness profiles of both Sérsic and core-Sérsic elliptical galaxies using a double Sérsic model. They claimed that these galaxies’ outer component is an old spheroid (with ) formed by the violent relaxation of pre-existing stars from a merger event while their inner component was “excess light” formed from a dissipative starburst produced by the same “wet” (gas-rich) merger event (e.g., Hernquist et al. 1993; Mihos & Hernquist 1994).
While this reasonable scenario sounds plausible, we point out two concerns. First, the lower luminosity early-type (Sérsic) galaxies ( mag) tend to have fast-rotating, outer exponential discs (Emsellem et al. 2011; Krajnović et al. 2013), rather than old, outer spheroid-like components. Second, the higher luminosity (core-Sérsic) elliptical galaxies have a central deficit of light rather than an excess, and are thought to be formed from dry merger events (e.g., Faber et al. 1997). The violent relaxation simulations yield (e.g., van Albada 1982; McGlynn 1984) and therefore cannot account for luminous elliptical galaxies with built from dry mergers. In addition, they do not explain how low-luminosity elliptical galaxies with are made, nor why these galaxies follow the same relation as the massive ellipticals with .
The Hopkins et al. (2009a, b) galaxy sample included lenticular galaxies (NGC 507, NGC 1400, NGC 2778, NGC 4382, NGC 4459, NGC 4476, NGC 5813 and NGC 4515) which were thought to be ellipticals and modelled using an inner Sérsic model plus an outer Sérsic model with . Our fits in Fig. A1 and those in Dullo & Graham (2013) show that NGC 507, NGC 4382 and NGC 5813 are core-Sérsic lenticular galaxies that are well described by a core-Sérsic bulge plus an exponential disc model with very small rms residuals of 0.027 mag arcsec-2, 0.016 mag arcsec-2 and 0.015 mag arcsec-2, respectively. Laurikainen et al. (2010, 2011) have also detected a weak nuclear bar in the unsharp mask image of NGC 507. Further, all of our core-Sérsic elliptical galaxies (Table 1), except for NGC 1016, NGC 3706 and NGC 4073, are in common with Hopkins et al. (2009b). As discussed in Section 3.2, these galaxies are well described by the core-Sérsic model, which can be seen from the residual profiles888The (not shown) residual profile from the core-Sérsic fit to the simulated light profile by Hopkins et al. (2008, their Fig. 2) would reveal systematic structures that have not been properly modelled. Similarly, the residual profile from the double Sérsic fit to, for example, AM 2246-490 (Hopkins et al. 2008, their Fig. 6) would also reveal telling mismatches. (Fig. A1) which also have small rms residuals 0.045 mag arcsec-2. This can be compared to the larger rms residuals given by Hopkins et al. (2009b, their Figs. 10-14) from their double Sérsic model fits for six core-Sérsic galaxies in common with our sample (NGC 4365, NGC 4382, NGC 4406, NGC 4472, NGC 4552 and NGC 4649). That is, with better fits, we have shown that these galaxies have a central deficit of light, in accord with the dry merging scenario involving supermassive black holes. In stark contrast, Hopkins et al. (2009b) argued that these galaxies support a wet merger scenario.
Similarly, Dhar & Williams (2012) argued that both Sérsic and core-Sérsic galaxies can be represented well by two or three “DW” functions which are the 2D projections of the 3D Einasto density model (Dhar & Williams 2010). As in Hopkins et al. (2009a, b), all their sample galaxies, including the six common core-Sérsic galaxies (NGC 4365, NGC 4382, NGC 4406, NGC 4472, NGC 4552 and NGC 4649), are presented as having an inner “extra light” component that has a half-light radius kpc. This is somewhat similar to the ground-based work by Huang et al. (2013) who argued that elliptical galaxies comprise three distinct components—an inner ( kpc) component, a middle ( kpc) component and an outer kpc envelope—which are all represented by Sérsic models with , at odds with the traditional picture of violent relaxation producing profiles. In contrast, the fits from our study show that the inner kpc of “ellipticals” (excluding the depleted core) are not disconnected from, but are rather the simple extensions of, their outer regions999Although, we do note that some luminous cD galaxies (e.g., Seigar et al. 2007) may have excess flux at large radii with respect to their inner Sérsic profiles as a result of minor mergers (Hilz et al. 2013) and accretion from their cluster environment.. Of course disturbed, unrelaxed galaxies, especially those with peculiar morphology, won’t be well described by a single core-Sérsic model. These particular galaxies may well appear to have multiple (Sérsic) spheroidal components.
In addition to a handful of S0 galaxies (IC 2006, NGC 4697), a handful of barred S0 galaxies (IC 4329, NGC 6673), and a handful of unrelaxed peculiar galaxies (NGC 2305, NGC 4976), Huang et al. (2013) included 15 cD galaxies (IC 1633, IC 2597, IC 4765, IC 4797, NGC 596, NGC 1172, NGC 1339, NGC 1427, NGC 3087, NGC 4696, NGC 4786, NGC 6909, NGC 6958, NGC 7192, NGC 7796) in their galaxy sample. The tell-tale signature of a fit which has failed to fully capture the curvature in the radial stellar distribution is evidenced by the pattern in the residual profile. This can be seen in, for example, Fig. 36 from Huang et al. (2013), where, from 150 to beyond 400 there is a systematic hump in their residual profile for ESO 185-G054. The artificial ring in their residual image also reveals that the fit is not optimal. This is because the 9 parameters of their three fitted Sérsic models have collectively managed to approximate the light profile out to a radius . In this instance, the use of a fourth, extended Sérsic model would have enabled a better fit to the outer half of the light profile, as in the case of ES0 221-G026 which Huang et al. (2013) fit with 4 Sérsic models. However, this does not mean that the galaxy ESO 185-G054 actually has 4 components, simply that if one uses enough parameters then one can better approximate the light profile. Rather than applying a multitude of Sérsic components, we advocate trying to establish which components are real and then applying the appropriate function, as done by, for example, Läsker et al. (2014).
To continue this important point, but avoid creating too much of a distraction in the main text, in Appendix D we provide comparisons between our core-Sérsic modelling of our galaxy sample and some other recent works which obtained dramatically different results for galaxies with depleted cores.
4 Structural parameter relations
We explore several galaxy structural parameter relations for 28 core-Sérsic early-type galaxies with carefully acquired core-Sérsic parameters.
4.1 The core’s size and brightness
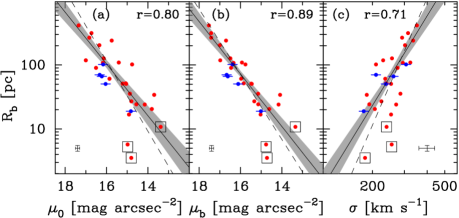
The good agreement between the structural parameters from this work and those form our initial study using profiles (Dullo & Graham 2012) suggests that the different correlations that will be shown here agree with those of Dullo & Graham (2012). Fig. 5 shows the relation between the core-Sérsic break radius (Table 2) and central galaxy properties including (a) the core-Sérsic model’s central -band surface brightness (Table 2), (b) the break surface brightness (Table 2) and (c) the velocity dispersion (Table 1). The solid and dashed lines shown in each panel of Figs. 5 to 8 are two distinct linear regression fits obtained with and without the three elliptical galaxies (NGC 1700, NGC 3640 and NGC 7785) with questionably small cores (). We note that all the relations given in Table 3 are for the galaxy data without these three questionable galaxies. Using the ordinary least squares (OLS) bisector regression from Feigelson & Babu (1992), a fit to the and data gives , while applying the bisector fit to and yields , and the bisector fit to and yields (Table 3).
| Relation | OLS bisector fit | (Vertical scatter) |
|---|---|---|
| 0.24 dex | ||
| 0.18 dex | ||
| 0.29 dex | ||
| 0.30 dex | ||
| 0.43 dex | ||
| 0.45 dex | ||
| 0.28 | ||
| 0.80 | ||
| 0.80 | ||
| 1.17 | ||
| ( derived for 23 galaxies | 0.27 dex | |
| plus 8 direct masses) | ||
| ( derived for 23 galaxies | 0.27 dex | |
| plus 8 direct masses) |
Similar to Fig. 5, Fig. 6 reveals that the core-Sérsic break radii correlate with global galaxy properties such as (a) the -band absolute magnitude (Table 1) and (b) the effective radius (Table 2). The bisector fit gives the near-linear relation between and as , while the fitted relation for the and data is (Table 3). Of all the relations (Figs. 5 and 6, Table 3), the weakest correlation with a Pearson correlation coefficient of is between and , while the for the remaining relations .
We note that, intriguingly, the bulges seem to reveal a systematic trend in the , (Figs 5a and 5b) and (Fig. 6b) diagrams, although it is more obvious in the plane. For a given break radius, bulges appear to be compact, i.e., kpc (see also Dullo & Graham 2013 and Graham 2013) and possess somewhat fainter central and break surface brightnesses. Thus, in Fig 6(b) we additionally include the OLS bisector fit to the relation between and (dotted line) for only the elliptical galaxies, which is given by (Table 3). Combining this relation with the relation (Table 3, Fig. 6a) gives for elliptical galaxies with mag. This can be compared with the bright end of the curved relation given in Section 5.3.1 of Graham & Worley (2008). The linear regression fit to the luminous ( mag) galaxies in Graham & Worley (2008, their Fig. 11a) has a slope of 0.9 (see also Liu et al. 2008, Bernardi et al. 2007), and it is steeper at brighter luminosities. While the elliptical galaxies appear to follow the steeper near-linear relation than the relation for the combined (elliptical+bulge) sample, the vertical rms scatters for both these relations are large (Table 3).


The tight correlations seen in the and diagrams (Figs. 5b and 5c) were also shown by Faber et al. (1997, their Fig. 8), Lauer et al. (2007a, their Figs. 4 and 6) and Dullo & Graham (2012, their Fig. 17). Similar trends to the distribution (Fig.6a) can be seen in the works by Faber et al. (1997, their Fig. 4), Ravindranath et al. (2001, their Fig. 5a, b), Laine et al. (2003, their Fig. 9), Trujillo et al. (2004, their Fig. 9), de Ruiter et al. (2005, their Fig. 8), Lauer et al. (2007a, their Figs. 5) and Dullo & Graham (2012, their Fig. 17). The slope of the relation (Table 3) that we find here can be compared to the similar slopes 1.15, 0.72, , and published by Faber et al. (1997), Laine et al. (2003), de Ruiter et al. (2005), Lauer et al. (2007a) and Dullo & Graham (2012), respectively. It is worth noting that the relations in Faber et al. (1997), Laine et al. (2003) and de Ruiter et al. (2005) were derived using the Nuker break radii, while Lauer et al. (2007a) used the “cusp radius”—the radius at which the negative logarithmic slope of the Nuker model equals 0.5. The slopes (not the intercepts) of the relations obtained using the core-Sérsic model and the Nuker model break radii can coincidentally be consistent because of the way the Nuker model systematically overestimates the break radius in comparison with the core-Sérsic model. Also provided here, achieved using well constrained core-Sérsic fit parameters, are the and relations which are consistent with Dullo & Graham (2012, their Eqs. 7, and 5) within the errors. Due to coupling of and along the light profile (Dullo & Graham 2012, their Figs. 17c and 18), our relation agrees with that of Lauer et al. (2007a, their Eq. 17).
As shown in Fig. 5(b), the core size of a galaxy () and its surface brightness () are closely related. Fig. 7 reveals that is thus also tightly correlated with (a) the central surface brightness , (b) the velocity dispersion , (c) the spheroid absolute magnitude , and (d) the effective (half-light) radius . The OLS bisector fits are given in Table 3. The and relations (Table 3) agree with those in Dullo & Graham (2012, their Eqs. 10 and 9, respectively).
Lastly, given the disagreement between the “core” parameters () of the core-Sérsic model and the Nuker model (Section 3.3), it is expected that our galaxy scaling relations (Table 3) may differ from similar relations obtained using the Nuker model. However, as mentioned above, some of the slopes (not the intercepts) of these scaling relations derived from these two models can agree. Moreover, the close agreement between the core-Sérsic break radius and the Lauer et al. (2007a) “cusp radius” (Dullo & Graham 2012) suggests that the scaling relations based on these two core measurements would be consistent.
5 The central stellar deficit
5.1 Core size versus black hole mass
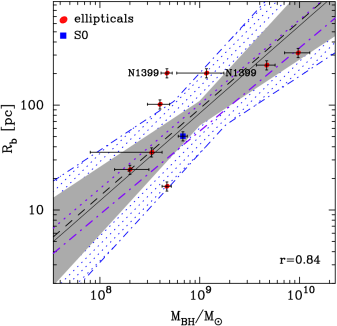
If galaxy core formation proceeds by the orbital decay of black hole binaries, from merging galaxies, as suggested by simulations (e.g., Ebisuzaki et al. 1991; Merritt 2006) and advocated by Faber et al. (1997), then a close relation between the core size () and the black hole mass () of a galaxy might be expected. Given the well known (Ferrarese & Merritt 2000; Gebhardt et al. 2000) and (Marconi & Hunt 2003; Graham & Scott 2013) relations, the strong and correlations in Section 4.1 hint at a tight relation. This trend is observed in Fig. 8, and quantified in Table 3 for our sample of 31 galaxies. Eight of these galaxies have direct SMBH mass measurements, while the remaining SMBH masses were predicted using either the Graham & Scott (2013) “non-barred ” relation101010We are able to use the non-barred relation, which has smaller uncertainties, because it is consistent with the core-Sérsic relation.
| (13) |
or their -band core-Sérsic relation which is converted here to -band using (Fukugita et al. 1995; Faber et al. 1997), to give
| (14) |
Following Graham et al. (2011, see the discussion in their Section 2.1.1), we assumed a 10 % uncertainty on our velocity dispersions in order to estimate the errors on the SMBH masses which were predicted using the relation. The predicted masses are given in Table 4. Note that since the resulting distributions, shown in Figs. 8a and b, are primarily driven by galaxies with predicted SMBH masses, the observed trend may simply be due to the existence of the (Fig. 5c), (Fig. 6a) relations and the , relations, although we find below that this is not the case.
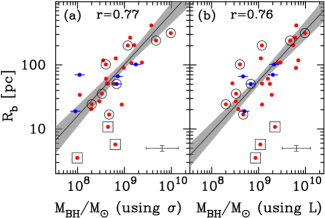
Fig. 9 plots the relation for the eight galaxies with directly measured SMBH masses. NGC 1399 has two distinct SMBH mass measurements in the literature (Houghton et al. 2006, ; Gebhardt et al. 2007, ). While this galaxy has a normal core (202 pc) for its absolute magnitude ( mag), it appears that the dynamical SMBH mass measurement of Gebhardt et al. (2007) may be too small for its 202 pc core size. This mass estimate makes the galaxy an obvious outlier in the diagram (Fig. 9). Using the Houghton et al. (2006) SMBH mass for NGC 1399, the OLS bisector fit to the and data for our eight galaxies with direct SMBH measurements yields
| (15) |
with an rms scatter of dex in the log direction. When using the SMBH mass for NGC 1399 from Gebhardt et al. (2007) rather than from Houghton et al. (2006), with an intercept of 1.96 0.14 (Fig. 9, dashed line). While this relation is in excellent agreement with Eq. 15, the scatter in this distribution is larger (0.35 dex in the log direction).
We note that, as shown in Fig. 9, the near-linear relation established by these eight galaxies (Eq. 15, solid line) is consistent with the relations constructed by including the remaining sample galaxies with predicted SMBH mass measurements (Figs. 8a and b, Table 3). However, the relation (Eq. 14, Graham & Scott 2013) appears to somewhat overpredict the SMBH masses relative to the relation (Eq. 13, Graham & Scott 2013) for our core-Sérsic galaxy sample. This can be seen from the smaller intercept of the ()-based relation, 1.75 0.06 (Fig. 8b, Table 3), compared to the intercept of the ()-based relation, (Fig. 8a, Table 3). This unexpected situation has arisen because of a difference in the relation between the core-Sérsic galaxy sample in Graham & Scott (2013) and that used here. We find a 2.44 difference between the intercepts of the relations from these two studies111111We found consistent results using both the linear regression code employed in this paper and in Graham & Scott (2013)., which largely explains the 3.25 difference between the intercepts of the ()-based and ()-based relations (Table 3).
To further appreciate the (galaxy core)-(SMBH mass) connection we derive additional relations by combining the non-barred relation from Graham & Scott (2013) with the relation (Table 3) to obtain the new relation
| (16) |
which is in good agreement with Eq. 15. Similarly, combining the relation (Table 3) with the core-Sérsic relation from Graham & Scott (2013, their Table 3 -band), which is converted here to the -band using =1.0, gives
| (17) |
Although we only have eight galaxies with direct black hole mass measurements, Eq. 15 is consistent (i.e., overlapping uncertainties) with the two inferred relations (Eqs. 16 and 17).
| Galaxy | log () | log () | log () | |||
|---|---|---|---|---|---|---|
| (1) | (2) | (3) | (4) | (5) | (6) | (7) |
| NGC 0507 | 1.40[a] | 5.5 | 8.34 | 9.08 | 9.24[p] | 0.69 |
| NGC 0584 | 1.27[b] | 4.5 | 7.78 | 8.43 | 8.29[p] | 1.38 |
| NGC 0741 | 1.32[a] | 5.0 | 8.96 | 9.66 | 9.12[p] | 3.43 |
| NGC 1016 | 1.32[a] | 5.0 | 9.10 | 9.80 | 9.21[p] | 3.85 |
| NGC 1399 | 1.21[a] | 4.0 | 9.57 | 9.97 | 8.67 , 9.07 [d] | 20.0, 7.90 |
| NGC 1700 | 1.29[b] | 4.8 | 7.77 | 8.45 | 8.65[p] | 0.63 |
| NGC 2300 | 1.33[b] | 5.0 | 7.81 | 8.51 | 8.86[p] | 0.45 |
| NGC 3379 | 1.28[b] | 4.6 | 8.63 | 9.29 | 8.60[d] | 4.90 |
| NGC 3608 | 1.29[b] | 4.8 | 7.82 | 8.50 | 8.30[d] | 1.57 |
| NGC 3640 | 1.22[a] | 4.0 | 6.35 | 6.96 | 7.99[p] | 0.09 |
| NGC 3706 | 1.34[a] | 5.2 | 8.30 | 9.01 | 8.94[p] | 1.18 |
| NGC 3842 | 1.38[a] | 5.6 | 9.20 | 9.95 | 9.98[d] | 0.93 |
| NGC 4073 | 1.17[a] | 3.2 | 8.50 | 9.00 | 8.98[p] | 1.05 |
| NGC 4278 | 1.26[b] | 4.5 | 8.31 | 8.96 | 8.62[p] | 2.17 |
| NGC 4291 | 1.27[a] | 4.5 | 8.15 | 8.81 | 8.52[d] | 1.94 |
| NGC 4365 | 1.33[b] | 5.0 | 8.68 | 9.38 | 8.81[p] | 3.70 |
| NGC 4382 | 1.10[b] | 2.6 | 7.68 | 8.09 | 7.95[p] | 1.37 |
| NGC 4406 | 1.25[b] | 4.5 | 8.28 | 8.93 | 8.61[p] | 2.12 |
| NGC 4472 | 1.33[b] | 5.0 | 8.59 | 9.29 | 9.15[p] | 1.40 |
| NGC 4552 | 1.29[b] | 4.8 | 8.02 | 8.70 | 8.67[d] | 1.08 |
| NGC 4589 | 1.33[b] | 5.0 | 7.50 | 8.22 | 8.49[p] | 0.54 |
| NGC 4649 | 1.34[a] | 5.2 | 9.05 | 9.76 | 9.67[d] | 1.22 |
| NGC 5061 | 1.24[a] | 4.2 | 8.64 | 9.27 | 8.05[p] | 16.7 |
| NGC 5419 | 1.35[a] | 4.7 | 9.70 | 10.37 | 9.57[p] | 6.26 |
| NGC 5557 | 1.18[a] | 3.2 | 8.23 | 8.74 | 8.78[p] | 0.90 |
| NGC 5813 | 1.31[b] | 5.0 | 8.24 | 8.93 | 8.83[d] | 1.27 |
| NGC 5982 | 1.26[b] | 4.5 | 8.24 | 8.89 | 8.65[p] | 1.75 |
| NGC 6849 | 1.03[a] | 2.4 | 7.97 | 8.35 | 8.04[p] | 2.03 |
| NGC 6876 | 1.26[a] | 4.5 | 8.52 | 9.17 | 8.55[p] | 4.25 |
| NGC 7619 | 1.35[b] | 4.7 | 8.99 | 9.66 | 9.37[p] | 1.95 |
| NGC 7785 | 1.33[a] | 5.0 | 6.67 | 7.37 | 8.80[p] | 0.04 |
Notes.—Col. (1) Galaxy name. Col. (2) Galaxy colour: we use the Lauer et al. (2005) central colours [b] when available; otherwise the colours [a] were taken from the HyperLeda database. Col. (3) -band stellar mass-to-light () ratios determined using the galaxy colours (col. 2) and the colour-age-metallicity- relation given by Graham & Spitler (2009, their Fig. A1). Col. (4) Central luminosity deficit in terms of -band solar luminosity. Col. (5) Central stellar mass deficit determined using col. (3) and col. (4). Col. (6) SMBH mass. Sources: [p] supermassive black hole mass predicted using the Graham & Scott (2013, their Table 3 and Fig. 2) “non-barred ” relation (and the “barred ” relation for NGC 6849); [d] galaxies with dynamically determined SMBH mass measurements taken from Graham & Scott (2013). For NGC 1399, we use two direct (dynamically determined) SMBH mass measurements taken from Gebhardt et al. (2007, 4.7 ) and Houghton et al. (2006, 1.2) and adjusted to our distance. We use Eq. 4 from Graham et al. (2011), updated according to the relation in Graham & Scott (2013), as well as the values in Table 1 and assume a 10% uncertainty on to estimate the error on the predicted SMBH mass (see Graham et al. 2011, their Section 2.1.1). Col. (7) Ratio between mass deficit and black hole mass.
5.2 Central stellar mass deficits
As mentioned before, the central stellar mass deficits of core-Sérsic galaxies are naturally generated through the gravitational sling-shot ejection of core stars by the inspiraling black hole binaries that that are formed in a merger remnant (Begelman et al. 1980; Ebisuzaki et al. 1991). A key point to note is that high-accuracy simulations (e.g., Milosavljević & Merritt 2001; Merritt 2006) predicted that multiple dissipationless mergers will have cumulative effects on core formation. Merritt (2006) found that the total stellar mass deficit, , after successive dry major mergers is , with the final SMBH mass.
Past studies have quantified this stellar mass deficit from the difference in luminosity, , between the inward extrapolation of the outer Sérsic profile (of the core-Sérsic model) and a sharp-transition121212The 5-parameter sharp-transition core-Sérsic model is obtained by setting the transition parameter (Graham et al. 2003). core-Sérsic model (Graham 2004; Ferrarese et al. 2006; Hyde et al. 2008). Here, we apply the same prescription for as in these past works but we use a smoother transition (instead of a sharp) core-Sérsic model by applying a finite in Eq. 10 (cf. also Dullo & Graham 2012, 2013). Therefore, the difference in luminosity between the outer Sérsic model (Eq. 9) and the core-Sérsic model (Eq. 12) is the central stellar luminosity deficit . For each galaxy this luminosity deficit is converted into a mass deficit using the -band stellar mass-to-light () ratio given in Table 4. In order to determine these ratios, the central (if available, otherwise the galaxy) colours (Table 4) together with the colour-age-metallicity-() diagram (Graham & Spitler 2009, their Fig. A1) were used, assuming a 12 Gyr old stellar population. We note that the Graham & Spitler (2009) colour-age-metallicity-() diagram is constructed using the Bruzual & Charlot (2003) stellar population models and the Chabrier (2003) stellar initial mass function (IMF). Recent works suggest that the IMF may vary with velocity dispersion for early-type galaxies but there is a significant scatter in this relation (e.g., Cappellari et al. 2012, 2013; Conroy & van Dokkum 2012; Spiniello et al. 2012; Wegner et al. 2012; Ferreras et al. 2013; Zaritsky et al. 2014). Galaxies with low-velocity dispersions require a Kroupa (2001, or a Chabrier 2003) IMF, while high-velocity dispersion galaxies ( km s-1) may prefer a “bottom-heavy” IMF having a steeper slope than that of Salpeter (1955), although Cappellari et al. (2013, their Fig. 15) found a shallow ( relation for their slow rotators with km s-1 (see also Rusli et al. 2013; Clauwens, Schaye & Franx 2014). Once these mass-to-light issues are settled, it may be worth trying to refine the stellar mass deficits reported here.

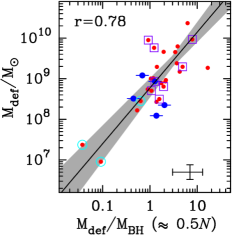
Fig. 10 plots the mass deficits that we derive against the dynamically determined or predicted SMBH masses for our 31 core-Sérsic early-type galaxies (Table 4), the largest sample of core-Sérsic galaxies with extended light profiles that has been modelled to date. We find the mass deficits for these galaxies are typically , in agreement with past core-Sérsic model estimates (Graham 2004; Ferrarese et al. 2006; Hyde et al. 2008; Dullo & Graham 2012, 2013). This translates to core-Sérsic galaxy formation through one to several successive “dry” major merger events, consistent with theoretical expectations (e.g., Haehnelt & Kauffmann 2002). In addition, recent observations on close major merger pairs have revealed that massive galaxies have undergone major mergers since (e.g., Bell et al. 2004, 2006; Bluck et al. 2012; Man et al. 2012; Xu et al. 2012). The most massive galaxies, with stellar mass , may have experienced up to six major mergers since (Conselice 2007).
Four elliptical galaxies NGC 1399, NGC 3640, NGC 5061 and NGC 7785 are outliers from the main distribution (Fig. 10). NGC 3640 and NGC 7785 are two of the three galaxies with unusually small depleted cores (see Section 4 and Appendix B). They both have small mass deficits ( and ) for their predicted SMBH masses ( and ). The remaining galaxy with a questionable core (NGC 1700) is an outlier in most central galaxy scaling relations (Figs. 5, 6 and 7) but it has a normal mass deficit for its SMBH mass. This owes to the fact that NGC 1700, unlike NGC 3640 and NGC 7785, has a relatively steep outer Sérsic profile (). This larger Sérsic index value helps to compensate for the small core size, taking its estimated mass deficit into the normal range in Fig. 10.
In the case of the potentially outlying galaxy NGC 1399, the discussion given in Section 5.1 explains the behavior seen here. The smaller dynamical SMBH mass determination by Gebhardt et al. (2007) yields an inflated ratio of , while assuming the larger dynamical SMBH mass measurement of Houghton et al. (2006) implies a somewhat reasonable value of .
The situation with the fourth offset elliptical galaxy NGC 5061 is somewhat unclear given it is not a deviant galaxy in the other galaxy scaling relations (Section 4). The core-Sérsic model fits its light profile very well with a fairly small rms residual of mag arcsec-2, but from these fit parameters we determine a large mass ratio . Its core size pc is a good match to its -band absolute magnitude mag (Table 1) and velocity dispersion km s-1 (Table 1), but its Sérsic index (Table 2) may be too high for the aforementioned galaxy properties. Indeed, NGC 5061 has the largest Sérsic index from our sample, attributed to its noticeably straight surface brightness profile (Fig. A1). This may suggest that the envelope of this galaxy was built via several dry minor and major merging events (Hilz et al. 2013). On the other hand, it has the third smallest velocity dispersion km s-1 (HyperLeda’s mean value) from our sample which seems to underpredict its SMBH mass (Table 4). Using the largest reported velocity dispersion value km s-1 (Davies et al. 1987), instead of the mean measurement, increases its predicted SMBH mass roughly by a factor of 2, i.e., . As such the associated ratio reduces roughly by a factor of two, to give . This latter ratio is marginally consistent with the distribution shown in Fig. 9. In summary, it appears that both the high Sérsic index and the relatively low velocity dispersion of NGC 5061 may collectively act to inflate the ratio to 17.
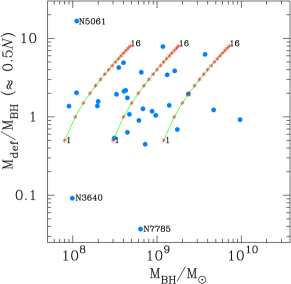
As shown in Fig. 11, excluding the three galaxies with questionably small/real cores, and using the Hougton et al. (2006) SMBH mass for NGC 1399, the OLS bisector regression between and ( , Merritt 2006) gives
| (18) |
In Fig. 12, we explore the behavior of the ratio with . We find that the distribution in this diagram appears largely consistent with the simulations by Merritt (2006, his Table 2). As in Merritt (2006), for the first merger (), an object with a supermassive black hole mass of (1/3)() was added to a system having a black hole mass of (2/3)(). The same black hole mass of (1/3)() was then added for each successive merger. These accumulated black hole masses are plotted against to construct each of the three curves shown in Fig. 12. Form this figure it is apparent that core-Sérsic galaxies with the same SMBH mass (or merger history) can have different merger histories (SMBH masses). This is consistent with the notion that the stellar mass deficits of core-Sérsic galaxies reflect the amount of merging as well as the masses of their SMBHs.
5.3 Comparison with past stellar mass deficit measurements
The mean elliptical galaxy ratio from Graham (2004) is 2.1 1.1, while Ferrarese et al. (2006) reported a mean ratio of 2.4 0.8 after excluding the S0 galaxy NGC 4382 from their sample. Hyde et al. (2008) found a comparable mean ratio of 2.3 0.67 for their sample. In Dullo & Graham (2012), we modelled light profiles and cautioned that the outer Sérsic parameters might be less constrained than desirable, although the Sérsic indices were shown to be in a fair agreement with those determined from published fits to larger radial extents. Nonetheless, we reported tentative ratios that were some 0.5. In Dullo & Graham (2013) we fit the extended light profiles of four core-Sérsic lenticular galaxies (NGC 507; NGC 2300; 4382 and NGC 6849) using a core-Sérsic model for the bulge plus an exponential model for the disc. One suspected S0 galaxy NGC 3706 was found to have a stellar distribution that is best described by the core-Sérsic model and was thus reclassified as an elliptical galaxy. Using these core-Sérsic fit parameters we reported a robust for these five core-Sérsic galaxies (Dullo & Graham 2013, their Fig. 4), which are also shown here in Fig. 10.
Prior to Graham (2004) who reported ratio of , previous estimates based on Nuker model parameters had been an order of magnitudes larger (e.g., Milosavljevic & Merritt 2001; Milosavljević et al. 2002; Ravindranath 2002). Graham (2004) argued that the Universe was some ten times less violent, in terms of major galaxy mergers, than previously believed. Subsequent works using Nuker model parameters (Lauer et al. 2007a; Gültekin et al. 2011) or subjectively identifying the core from visual inspections (Kormendy et al. 2009) have reported mass deficits up to an order of magnitude larger than typically found here. As discussed in Section 3 and Appendix D, this discrepancy is partly due to the contrasting core sizes measured by these distinct methodologies. Using a model-independent analysis of the light profiles, Hopkins & Hernquist (2010) confirmed the result of Graham (2004) and reported . The larger mass deficits () of Kormendy & Bender (2009) are also partly because they used the dynamical mass-to-light ratios rather than the stellar ratios to derive the mass deficits. There is not much dark matter at the centre of massive spheroids (e.g., Dekel et al. 2005), and assuming the dynamical for the galaxy (= [ + / ) overpredicts the central mass deficits. Recently, Kormendy & Ho (2013) scaled up the SMBH masses for the galaxies in Kormendy & Bender (2009) by about a factor of two and reported a new lower, mean ratio .
Alternative mechanisms for the production of enhanced depleted cores in luminous galaxies has been suggested in the literature (Boylan-Kolchin et al. 2004; Gualandris & Merritt 2008; Kulkarni & Loeb 2012). Gualandris & Merritt (2008) invoked the recurrent core passages of gravitationally kicked and “recoiled” (and then oscillating about the centre) SMBH in a merger remnant to explain the formation of large stellar mass deficits that are up to 5 . Kulkarni & Loeb (2012) also suggested that mass deficits as large as could be formed as a result of the action of multiple SMBHs from merging galaxies. If these processes have always occurred, then the result we found here, i.e., for our sample galaxies implies that these galaxies are formed via just one major merger or minor merger events only, at odds with both observations of close galaxy pairs of equal mass, and theoretical expectations (e.g., Khochfar & Burkert 2003; Bell et al. 2004; Naab et al. 2006; Bluck et al. 2012). However, spheroids with (i.e., probably need some black hole oscillations as 8 or more major mergers seem excessive. We find two elliptical galaxies (NGC 1399, NGC 5061) with , suggesting that these oversized mass deficits might be partly due to the action of their gravitationally kicked SMBHs.
5.4 Alternative core formation scenarios
It should be noted that several authors have considered alternative ways in which cores can be produced in luminous galaxies. Dissipationless collapses in existing dark matter haloes were invoked by Nipoti et al. (2006) as a possible mechanism for forming depleted cores. Another suggested alternative was the adiabatic expansion of the core region driven by the rapid mass loss from the effects of supernova and AGN feedback (Navarro et al. 1996; Read & Gilmore 2005; Peirani, Kay & Silk 2008; Martizzi et al. 2012, 2013) and Krajnović et al. (2013) pointed out that this scenario is compatible with the properties of “core slow rotators”. In addition, Goerdt et al. (2010) proposed that the energy transferred from sinking massive objects would produce cores that are as large as 3 kpc in size. These suggested mechanisms, however, are not without problems. For example, it is unclear how the cores created by the simulations in Nipoti et al. (2006) are guarded against infalling satellites (which would replenish the core) in the absence of a central SMBH. Also, the oversized ( kpc) cores produced by the latter two mechanisms (e.g., Goerdt et al. 2010; Martizzi et al. 2012, 2013) are generally inconsistent with the typical 0.5 kpc cores observed in galaxies (e.g., Trujillo et al. 2004; Ferrarese et al. 2006; Richings et al. 2011; Dullo & Graham 2012). Section 6.1 of Dullo & Graham (2013) provides further details, including the merits and weaknesses of these core formation models in the context of the observations.
5.5 Comparison of core-Sérsic elliptical and lenticular galaxies
Finally, we note that the standard Lambda Cold Dark Matter (CDM) model predicts that elliptical galaxies are built via major mergers (e.g., Kauffmann et al. 1993; Khochfar & Burkert 2005). In this hierarchical picture, the bulges of lenticular galaxies form early via major mergers while their discs grow later through gas accretion events (e.g., Steinmetz & Navarro 2002). Alternatively, the evolutionary transformation of spiral galaxies into S0 galaxies via mechanisms such as ram pressure stripping has been suggested (e.g., Gunn & Gott 1972). Comparing various galaxy scaling relations, Luarikainen et al. (2010), for example, showed that the bulges of S0 galaxies are closely correlated with the bulges of bright spiral galaxies, having (bulge) 20 mag, than with elliptical galaxies. On the other hand, in Dullo & Graham (2013), we argued that core-Sérsic S0s with (bulge) mag might be assembled inside-out in two stages: an earlier “dry” major merger process involving SMBHs forms their bulge component, while the surrounding disc is subsequently formed via cold gas accretion. The bulges of our small S0 galaxy sample tend to have (Dullo & Graham 2013, see also Balcells et al. 2003 and Laurikainen et al. 2005), however, core-Sérsic elliptical galaxies have . As we mentioned in Section 4.1, for the same core size, these massive bulges tend to be compact ( kpc, Fig. 6b) and have somewhat fainter break, and central, surface brightnesses than the elliptical galaxies (Figs. 5a and 5b). Furthermore, the ratio for S0s is lower compared to the spread seen in elliptical galaxies (Fig. 10). This implies that the bulges of core-Sérsic S0s have experienced fewer major mergers than core-Sérsic elliptical galaxies (Fig. 11).
6 Conclusions
We extracted the major-axis surface brightness profiles from 26 core-Sérsic early-type galaxies observed with the HST WFPC2 and ACS cameras. We additionally included five core-Sérsic early-type galaxies (NGC 507, NGC 2300, NGC 3706, NGC 4382 and NGC 6849) from Dullo & Graham (2013). This compilation represents the largest number of core-Sérsic galaxies modelled to large radii , giving the fitting functions enough radial expanse to robustly measure the galaxy stellar distribution (see Fig. 3 for a comparison of the Sérsic indices obtained from fits using profiles). We fit the extended surface brightness profiles of the 26 core-Sérsic elliptical galaxies using the core-Sérsic model, while light profiles of the remaining five core-Sérsic S0 galaxies were modelled with the core-Sérsic model for the bulge plus an exponential model for the disc. We accounted for additional nuclear cluster light using the Gaussian function. Our principal results are summarised as follows:
1. The global stellar distributions of core-Sérsic elliptical galaxies are robustly represented with the core-Sérsic model, while core-Sérsic lenticular galaxies are accurately described using the core-Sérsic bulge + exponential disc model. These fits yield a median rms scatter of 0.045 mag arcsec-2 for our sample of 31 core-Sérsic galaxies, and argue against excessive multi-component Sérsic models (Section 3.4).
2. We provide updated core-Sérsic model parameters for 31 core-Sérsic early-type galaxies with spheroidal components having mag and km s-1. In general, there is a good agreement with the parameters obtained from our earlier analysis of the publicly available, but radially limited () surface brightness profiles given by Lauer et al. (2005).
3. The bulges of our core-Sérsic S0s are compact ( 2 kpc) and have (Dullo & Graham 2013), as compared to the core-Sérsic elliptical galaxies which typically have kpc and .
4. The core-Sérsic model break radii are in agreement with both (i) the previously published core-Sérsic break radii and (ii) the model-independent break radii which mark the locations where the negative logarithmic slopes of the light profiles equal 0.5 (Carollo et al. 1997a; Dullo & Graham 2012).
5. Updated structural parameter relations involving both the central and global galaxy properties are provided in Section 4. We have found tight correlations involving the central galaxy properties , , , and (see Table 3). We have also found near-linear relations between the break radius , and the spheroid luminosity and the SMBH mass given by and . We additionally found a near-linear relation between and such that but with a large scatter.
6. We have derived central stellar mass deficits in 31 early-type galaxies that are typically 0.5 to 4 times the host galaxy’s black hole mass. Given published theoretical results, these mass deficits suggest a few dissipationless major mergers for core-Sérsic galaxies.
7. As noted in Dullo & Graham (2013), mass deficits in core-Sérsic S0s suggest a two stage assembly: an earlier “dry” major merger event involving SMBHs creates the bulges with depleted cores, and the disc subsequently builds up via cold gas accretion events.
8. The relation between the stellar mass deficit and the cumulative number of major “dry” mergers that the galaxy has undergone is such that is roughly .
9. The close relation between the galaxy cores and the SMBHs supports the popular core depletion hypothesis where cores are thought to be created by sinking binary SMBHs that eject stars away from the centres of their host galaxies. The small cores seen in some galaxies, if real, may arise from loss cone regeneration by newly produced stars and/or recent stellar accretion events. Alternatively, small galaxy cores can be interpreted as a sign of minor mergers.
10. We have identified two galaxies (NGC 1399 and NGC 5061) which have a high ratio, suggesting that their central SMBH may have experienced a kick due to a gravitational-radiation recoil event leading to multiple core passages.
7 Acknowledgments
This research was supported under the Australian Research Council’s funding scheme (DP110103509 and FT110100263). This research has made use of the NASA/IPAC Extragalactic Database (NED) which is operated by the Jet Propulsion Laboratory, California Institute of Technology, under contract with the National Aeronautics and Space Administration. We acknowledge the usage of the HyperLeda database (http://leda.univ-lyon1.fr.). BTD is grateful for the SUPRA scholarship offered by Swinburne University of Technology, and travel support from the Astronomical Society of Australia.
Appendix A
Figure A1 shows core-Sérsic model fits to the major-axis surface brightness profiles of the 26 (suspected elliptical) core-Sérsic galaxies listed in Table 1. Notes on two of these 26 galaxies (NGC 4073 and NGC 6876) with complicated structures are given below, while their photometric profiles are shown in Figs. A2 and A3.
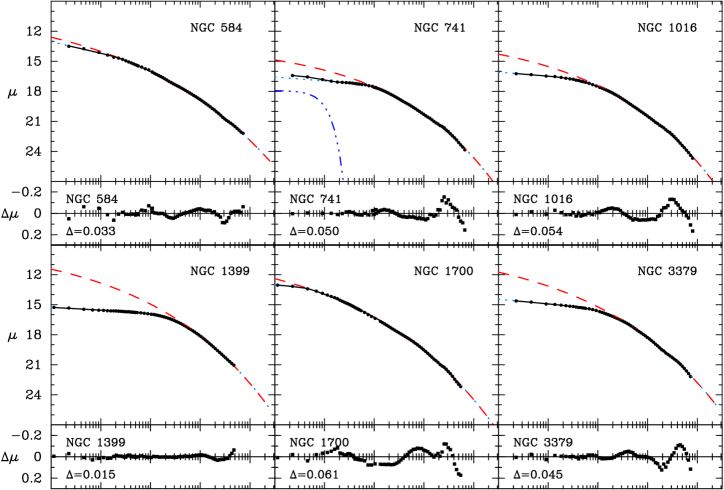
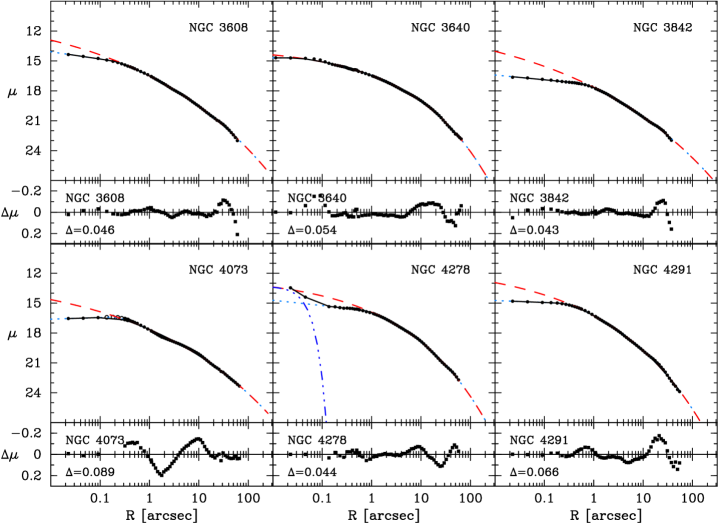
A.1 NGC 4073
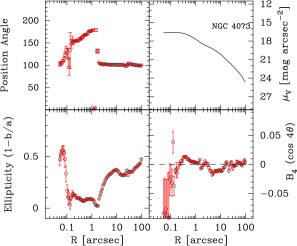
NGC 4073 is a cD galaxy in the poor MKW 4 cluster (de Vacouleurs et al. 1991). It has a double classification in Laurikainen et al. (2011, their Table 3), i.e., SAB0- for the inner regions and E for the outer parts. Also, this galaxy has a small bump in its light profile over due to a nuclear ring of stars (Lauer et al. 2005). Our models are not designed to fit stellar rings, thus we simply exclude data points that are contaminated by the nuclear ring light. Further, the core-Sérsic model fit to NGC 4073 shows an excess of light on top of the core-Sérsic light distribution over , creating the residual pattern seen in Fig. A1. cD galaxies are known to grow via cannibalism of their neighboring, less massive cluster galaxies (e.g., Ostriker & Hausman 1977). If these accreted objects (or at least their dense cores) survive, they would be visible as extra light like in NGC 4073. However, we did not find clear evidence for such a feature in this galaxy’s 2D residual image, possibly suggesting a collection of large scale disturbances in the galaxy. Fig. A2 shows the surface brightness and photometric profiles for NGC 4073 determined using the IRAF task ellipse. These profiles are connected with the galaxy’s residual structure observed in the model fit (Fig. A1). The position angle profile shows an abrupt 90∘ twist at around . The galaxy is also highly flattened () outside , while the ellipticity shows a steady drop from 0.45 (at ) to 0.1 (at ) accompanied by negative B4 values, then becomes nearly circular () inside the core (). Fisher, Illingworth & Franx (1995) reported NGC 4073 as having a counterrotating stellar core which they attribute to possible cannibalism events. Laurikainen et al. (2011) interpreted the excess light and the associated ellipticity trend over as being due to a weak inner bar. Without accounting for its light excess at , and omitting its ring light, the core-Sérsic model fits the light distribution of NGC 4073 with rms residual of mag arcsec-2.
A.2 NGC 6876
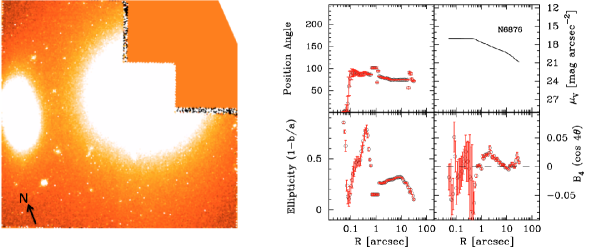
NGC 6876 is a dominant elliptical galaxy in the Pavo group. As shown in Fig. A3, this galaxy is only from its smaller companion, the elliptical galaxy NGC 6877. Using multi-wave observations, Machacek et al. (2005, 2009) showed evidence for interaction between NGC 6876 and the highly disturbed spiral galaxy NGC 6872. Dullo & Graham (2012, their Fig. 4) showed the double optical nucleus in NGC 6876 possibly associated with the dense core of a lesser galaxy or the ends of an inclined ring (Lauer et al. 2002). The residual structure at (Fig. A1) is associated with a 13∘ twist in the position angle, and the change in the ellipticity and the isophote shape of this galaxy beyond its core regions.
Appendix B
B.1 Questionable cores
NGC 1700
NGC 1700, a luminous ( mag) elliptical galaxy
with an estimated (luminosity weighted) age of 31 Gyr (Brown et
al. 2000) and a velocity dispersion km s-1, shows
post merger morphological signatures such as shells, and boxy isophote
at large radii (Franx et al. 1989; Statler et
al. 1996; Whitmore et al. 1997; Brown et al. 2000; Stratler &
McNamara 2002). It was also reported to be offset from the
Fundamental Plane (e.g., Statler et al. 1996; Reda et
al. 2005). Given this galaxy’s recent (wet) merger history, its small
core size may be because of loss cone regeneration via newly produced
and/or accreted stars. That is, a pre-existing large core in this
galaxy may be partially replenished by these new stars. We do however
caution that because this core is defined by just the inner two data
points of the deconvolved surface brightness profile, i.e., within
, its validity can be questioned, but it
remains unlikely that they are any bigger than reported here.
NGC 3640
NGC 3640 is a fast rotating (Krajnović et al. 2013) early-type
galaxy with mag and km s-1.
Prugniel et al. (1988, see also Michard & Prugniel 2004) noted that
this galaxy is a merger in progress, possibly with a gas-poor disc
system. Not only did they find low surface brightness structures such
as shells and ripples but they also showed that the radial
colour profile of this galaxy gets bluer towards the inner region.
Hibbard & Sansom (2003) however fail to detect neutral hydrogen
associated with NGC 3640. Also, Tal et al. (2009) recently reported
this galaxy to be highly disturbed system revealing morphological
peculiarities. Therefore, as in the case of NGC 1700, this galaxy’s
undersized core and mass deficit can be interpreted as loss cone
replenishment via new star formation and/or stellar accretion not
associated with a secondary black hole (see also Krajnović et al. 2013). It is also possible that the observed core, defined by just
one inner data point, may not be real.
NGC 7785
Our core-Sérsic model fit to this elliptical galaxy light profile yields a core size of just 5 pc, which is too small for its absolute magnitude mag and velocity dispersion 255 km s-1. There is no evidence for an ongoing or a recent merging event associated with this galaxy in the literature. Thus, its small core size as well as undersized mass deficit suggest that one or a few minor (instead of major) dissipationless mergers might have taken place in the absence of loss cone refilling. Alternatively, the apparent core in this galaxy, also defined by one data point, may be spurious.
Appendix C
This section provides a review of five galaxies (i.e., excluding NGC 4073 already discussed above) from our 26 suspected elliptical galaxies which were shown to have a bulge+disc stellar distribution in the literature.
C.1 NGC 0584
This galaxy is classified as an elliptical galaxy in the Third Reference Catalogue, RC3 (de Vacouleurs et al. 1991) and as an S0 by Sandage & Tammann (1981). Laurikainen et al. (2010, 2011) fit a 3-component (bulge+bar+disc) model to this galaxy’s -band light profile and noted that it has a large disc-like outer envelope and a weak inner bar. However, these (bar and disc) components were not detected in the -band light profile that we modelled. We do however wish to bring them to the attention of readers.
C.2 NGC 4472
The Virgo cluster galaxy NGC 4472 is classified as an elliptical galaxy in the RC3 but as an S0 by Sandage & Tammann (1981). Laurikainen et al. (2010, 2011) identified a large-scale disc in this galaxy which dominates the light at large radii (. In contrast, NGC 4472 was considered to be an elliptical galaxy by Kormendy et al. (2009) who fit a single Sérsic model to its light profile over . We did not detect a disc component in our profile (see also Ferrarese et al. 2006). Interestingly, however, this galaxy has the lowest Sérsic value () from our 26 suspected elliptical galaxies (Table 2), possibly suggesting an S0 morphology. It is classified as a slow rotator (over its inner region) by the ATLAS3D team (Cappellari et al. 2011).
C.3 NGC 4552
Like NGC 4472, NGC 4552 is a member of the Virgo cluster. It is classified as an elliptical galaxy in the RC3, but was recognized as an S0 by Sandage & Tammann (1981). While Kormendy et al. (2009) adopted an elliptical morphology for this galaxy, their Sérsic model fit to its light profile over shows a clear residual structure, in agreement with the S0 morphology adopted by Laurikainen et al. (2010, 2011). However, it too is classified as a slow rotator by Cappellari et al. (2011) perhaps because they only sampled the pressure-supported, bulge-dominated inner portion of the galaxy. The disc light (e.g., Laurikainen et al. 2011), dominant at large radii, does not contribute to our light profile (see also Ferrarese et al. 2006).
C.4 NGC 5813
As hinted at in Section 3.2, although NGC 5813 is classified as an elliptical galaxy (E1-2) in RC3, we find that its () light profile is best fit using the core-Sérsic bulge+exponential model with a small rms residual of mag arcsec-2. This suggests the galaxy may be an S0 disc galaxy, consistent with its steadily increasing ellipticity at as well as the kinks in the position angle and profiles at (Fig. C4). The residual image of this galaxy shown in Fig. C4 is regular, there is no evidence for a distinct morphological feature. Trujillo et al. (2004) also concluded that NGC 5813 may be an S0 galaxy which is better described using a bulge+disc model. This however appears to disagree with the rotation curve given by Efstathiou, Ellis & Carter (1982). Using long slit data, these authors showed that the core () of NGC 5813 rotates rapidly, while beyond the galaxy shows little rotation: evidence for a kinematically decoupled core.
C.5 NGC 5419
This galaxy is classified as an elliptical galaxy in the RC3, yet it was identified as an S0 by Sandage & Tammann (1981) and also recently by Laurikainen et al. (2011). We fit a core-Sérsic bulge plus a gaussian point source model to (-band) light profile, while Laurikainen et al. (2011) fit a three-component (bulge+lens+outer-disc) model to a more radially extended -band brightness profile. Our data does not probe this galaxy’s large-scale disc. Also, the lens component is not seen in our -band light profile.

Appendix D
D.1 Light profile modelling comparison with some recent studies
Recently, Krajnović et al. (2013) fit the Nuker model (Kormendy et al. 1994) to the nuclear light profiles of 135 ATLAS3D galaxies. While these authors are aware that the Nuker model is not a robust parametrization (i.e., the parameters are unstable), this model was used for the purpose of distinguishing core and coreless galaxies. As in the previous Nuker model works (e.g., Lauer et al. 2005) they opt to use (the slope of the Nuker model at ) as a diagnostic tool for separating their galaxies as core (), intermediate (0.3 0.5) and power-law () type. However, it has been shown (Graham et al. 2003; Dullo & Graham 2012, their Section 5.1) that the distance-dependent is not a physically robust or meaningful quantity to use. Moreover, galaxies with small Sérsic indices will have but no central deficit relative to the inward extrapolation of their outer Sérsic profile.
In Dullo & Graham (2012, see also Graham et al. 2003), we highlighted that the Nuker model is not ideal for describing central light profiles, and we revealed that seven () of the sample galaxies with low and thus shallow inner profile slopes were misidentified as galaxies having depleted cores by the Nuker model. Four of these seven galaxies (NGC 4458, NGC 4473, NGC 4478 and NGC 5576) are in common with Krajnović et al. (2013). Krajnović et al. (2013) classify three of them (NGC 4458, NGC 4478 and NGC 5576) as an intermediate type (i.e., coreless galaxies based on their criteria) in agreement with Dullo & Graham (2012) and at odds with Lauer et al. (2005). They, however, reminded the reader that the Nuker model actually detected cores in all these galaxies but this detection may change depending on the range over which the fits were done. It is perhaps worth clarifying that the Nuker model break radii reported by Lauer et al. (2005) for NGC 4458, NGC 4478 and NGC 5576 are smaller than those from Krajnović et al. (2013). These differing break radii have resulted in a significant difference in the measurements from these two works. For these three galaxies in question, Krajnović et al. (2013) found values that are times larger than those from Lauer et al. (2005). For the remaining common galaxy NGC 4473, Krajnović et al. (2013) found and subsequently classified it as a core galaxy in agreement with Lauer et al. (2005) and in contrast to Ferrarese et al. (2006), Kormendy et al. (2009) and Dullo & Graham (2012; 2013, their section 9.2.2). NGC 4473 does not have a central light deficit but quite the opposite: an embedded stellar disk (e.g., Krajnović et al. 2006; Capellari et al. 2007).
References
- [1] Allen, P.D., Driver, S.P., Graham, A.W., Cameron, E., Liske, J., De Propris, R., 2006, MNRAS, 371, 2
- [2] Andredakis Y. C., Peletier, R. F., & Balcells, M. 1995, MNRAS, 275, 874
- [3] Balcells, M., Graham, A. W., Domínguez-Palmero, L., & Peletier, R. F. 2003, ApJL, 582, L79
- [4] Ballo L., Braito V., Della Ceca R., Maraschi L., Tavecchio F., Dadina M., 2004, ApJ, 600, 634
- [5] Begelman, M. C., Blandford, R. D., & Rees, M. J. 1980, Nature, 287, 307
- [6] Bell, E.F., Wolf C., Meisenheimer K., et al. 2004, ApJ, 608, 752
- [7] Bell E. F. et al., 2006, ApJ, 640, 241
- [8] Bianchi, S., Chiaberge, M., Piconcelli, E., Guainazzi, M., & Matt, G. 2008, MNRAS, 386, 105
- [9] Binney, J., & Mamon, G. A. 1982, MNRAS, 200, 361
- [10] Blakeslee, J. P., Lucey, J. R., Tonry, J. L., Hudson, M. J., Narayanan, V. K., Harris, B. J., 2002, MNRAS, 330, 443
- [11] Bluck, A. F. L., Conselice, C. J., Buitrago, F., et al. 2012, ApJ, 747, 34
- [12] Bouché, N., Murphy, M. T., Kacprzak, G. G., Péroux, C., Con- tini, T., Martin, C., & Dessauges-Zavadsky, M., 2013, Science, 341, 50
- [13] Boylan-Kolchin M., Ma C., Quataert E., 2004, ApJ, 613, L37
- [14] Brown R. J. N., Forbes D. A., Kissler-Patig M., Brodie J. P., 2000, MNRAS, 317, 406
- [15] Bruzual G., Charlot S., 2003, MNRAS, 344, 1000
- [16] Buitrago F., Trujillo I., Conselice C. J., Haeussler B., 2013, MNRAS, 428, 1460
- [17] Burke-Spolaor S., 2011, MNRAS, 410, 2113
- [18] Byun, Y.-I., et al. 1996, AJ, 111, 1889
- [19] Caon N., Capaccioli M., D’Onofrio M. 1993, MNRAS, 265, 1013
- [20] Cappellari, M., McDermid, R. M., Alatalo, K., et al. 2012, Natur, 484, 485
- [21] Cappellari, M., McDermid, R. M., Alatalo, K., et al. 2013, MNRAS, 432, 1862
- [22] Carollo, C. M., Franx, M., Illingworth, G. D., & Forbes, D. A. 1997a, ApJ, 481, 710
- [23] Carollo, C. M., Stiavelli, M., de Zeeuw, P. T., & Mack, J. 1997b, AJ, 114, 2366
- [24] Carter, D. 1978, MNRAS, 182, 797
- [25] Chabrier G., 2003, ApJ, 586, L133
- [26] Cimatti, A., Nipoti, C., & Cassata, P. 2012, MNRAS, 422, L62
- [27] Clauwens, B., Schaye, J., Franx., M., 2014, MNRAS, arXiv:1406.0854
- [28] Conroy, C., & van Dokkum, P. G. 2012, ApJ, 760, 71
- [29] Conselice C. J., 2006, MNRAS, 373, 1389
- [30] Conselice C. J., 2007, in Combes F., Palous J., eds, Proc. IAU Symp. 235. Galaxy Evolution Across the Hubble Time. Cambridge Univ. Press, Cambridge, p. 381
- [31] Côté, P., et al. 2007, ApJ, 671, 1456
- [32] Crane, P., Stiavelli, M., King, I. R., et al. 1993, AJ, 106, 1371
- [33] Daddi, E., Renzini, A., Pirzkal, N., et al. 2005, ApJ, 626, 680
- [34] Davies R. L., Burstein D., Dressler A., Faber S. M., Lynden Bell D., Terlevich R. J., Wegner G., 1987, ApJS, 64, 581
- [35] de Ruiter, H. R., Parma, P., Capetti, A., Fanti, R., Morganti, R., Santantonio, L., 2005, A&A, 439, 487
- [36] de Vaucouleurs G., 1948, Ann. d’Astrophys., 11, 247
- [37] de Vaucouleurs G., de Vaucouleurs A., Corwin H. G., Jr., et al. 1991, Third Reference Catalogue of Bright Galaxies (Berlin: Springer)
- [38] Dhar, B. K., & Williams, L. L. R. 2012, MNRAS, 427, 204
- [39] Djorgovski, S., & Davis, M. 1987, ApJ, 313, 59
- [40] Dressler A., Lynden-Bell D., Burstein D., Davies R. L., Faber S. M., Terlevich R., Wegner G., 1987, ApJ, 313, 42
- [41] Driver S. P., Popescu C. C., Tuffs R. J., Graham A. W., Liske J., Baldry I., 2008, ApJ, 678, L101
- [42] Dullo B. T., Graham A. W., 2012, ApJ, 755, 163
- [43] Dullo B. T., Graham A. W., 2013, ApJ, 768, 36
- [44] Ebisuzaki T., Makino J., & Okumura S. K. 1991, Nature, 354, 212
- [45] Efstathiou G., Ellis R. S., Carter D., 1982, MNRAS, 201, 975
- [46] Emsellem E. et al., 2011, MNRAS, 414, 888
- [47] Faber, S. M., Tremaine, S., Ajhar, E. A., et al. 1997, AJ, 114, 1771
- [48] Feigelson, E. D., & Babu, G. J. 1992, ApJ, 397, 55
- [49] Ferrarese, L., Merritt, D., 2000, ApJ, 539, L9
- [50] Ferrarese, L., Côté, P., Jordán, A., et al. 2006, ApJS, 164, 334
- [51] Ferrarese L., Ford H., 2005, Space Sci. Rev., 116, 523
- [52] Ferrarese L., van den Bosch F. C., Ford H. C., Jaffe W., O’Connell R. W., 1994, AJ, 108, 1598
- [53] Ferrari, F., Dottori, H., Caon, N., Nobrega, A., Pavani, D.B. 2004, MNRAS, 347, 824
- [54] Ferreras, I., La Barbera, F., de la Rosa, I. G., et al. 2013, MNRAS, 429, L15
- [55] Fisher D., Illingworth G., Franx M., 1995, ApJ, 438, 539
- [56] Franx M., Illingworth G. D., & Heckman T. 1989, AJ, 98, 538
- [57] Fukugita M., Shimasaku K., & Ichikawa T. 1995, PASP, 107, 945
- [58] Gebhardt K., Bender, R., Bower, G., et al. 2000, ApJ, 539, L13
- [59] Gebhardt K., Lauer T. R., Pinkney J., et al. 2007, ApJ, 671, 1321
- [60] Glass L. et al., 2011, ApJ, 726, 31
- [61] Goerdt T., Moore B., Read J. I., Stadel J., 2010, ApJ, 725, 1707
- [62] Graham A. W., 2004, ApJ, 613, L33
- [63] Graham, A. W. 2012, ApJ, 746, 113
- [64] Graham A. W. 2013, in Planets, Stars and Stellar Systems, 6, ed. T. D. Oswalt & W. C. Keel (Berlin: Springer), 91
- [65] Graham A. W., Colless M. M., Busarello G., Zaggia S., Longo G., 1998, A&AS, 133, 325
- [66] Graham A. W., & Driver S.P. 2005, Publ. Astron. Soc. Australia, 22, 118
- [67] Graham A. W., Erwin P., Trujillo I., & Asensio Ramos A. 2003, AJ, 125, 2951
- [68] Graham A. W., & Guzmán R. 2003, AJ, 125, 2936
- [69] Graham A. W., Lauer T.R., Colless M.M., & Postman M. 1996, ApJ, 465, 534
- [70] Graham A. W., & Scott N. 2013, ApJ, 764, 151
- [71] Graham A. W., Spitler L. R., 2009, MNRAS, 397, 2148
- [72] Grillmair, C. J., Faber, S. M., Lauer, T. R., et al. 1994, AJ, 108, 102
- [73] Gualandris A., Merritt D., 2008, ApJ, 678, 780
- [74] Gunn J. E., Gott J. R., 1972, ApJ, 176, 1
- [75] Gültekin K., Richstone D. O., Gebhardt K., et al. 2011, ApJ, 741, 38
- [76] Haehnelt M.G., Kauffmann H. 2002, MNRAS, 336, L61
- [77] Hernquist L., Spergel D. N., & Heyl J. S. 1993, ApJ, 416, 415
- [78] Hibbard J. E., Sansom A. E., 2003, AJ, 125, 667
- [79] Hilz M., Naab T., Ostriker J. P., 2013, MNRAS, 429, 2924
- [80] Holley-Bockelmann K., Richstone D. O., 1999, ApJ, 517, 92
- [81] Houghton R., Magorrian J., Sarzi M., Thatte N., Davies R., & Krajnovic D. 2006, MNRAS, 367, 2
- [82] Hopkins P. F., Cox T. J., Dutta S. N., Hernquist L., Kormendy J., Lauer T. R., 2009a, ApJS, 181, 135
- [83] Hopkins P. F., Hernquist L., Cox T. J., Dutta S. N., Rothberg B., 2008, ApJ, 679, 156
- [84] Hopkins P. F., Lauer T. R., Cox T. J., Hernquist L., Kormendy J., 2009b, ApJS, 181, 486
- [85] Hopkins P. F., & Hernquist L. 2010, MNRAS, 407, 447
- [86] Huang, S., Ho, L. C., Peng, C. Y., Li, Z.-Y., & Barth, A. J. 2013, ApJ, 766, 47
- [87] Hyde J. B., Bernardi M., Fritz A., Sheth R. K., Nichol R. C., 2008, MNRAS, 391, 1559
- [88] Jedrzejewski R. I., 1987, MNRAS, 226, 747
- [89] Ju et al., 2013, arXiv:1306.4987
- [90] Kauffmann G., White S. D. M., Guiderdoni B., 1993, MNRAS, 264, 201
- [91] Kelvin L. S. et al., 2012, MNRAS, 421, 1007
- [92] King, I. R. 1978, ApJ, 222, 1
- [93] King, I. R., & Minkowski, R. 1966, ApJ, 143, 1002
- [94] Komossa, S., Burwitz, V., Hasinger, G., et al. 2003, ApJL, 582, L15
- [95] Kormendy, J. 1985, ApJ, 292, L9
- [96] Kormendy J., & Bender R. 2009, ApJ, 691, L142
- [97] Kormendy, J., Dressler, A., Byun, Y. I., et al. 1994, in ESO/OHP Workshop on Dwarf Galaxies, ed. G. Meylan & P. Prugniel (Garching: ESO), 147
- [98] Kormendy J., Fisher D.B., Cornell M.E., Bender R. 2009, ApJS, 182, 216
- [99] Kormendy, J., & Ho, L. C. 2013, ARA&A, 51, arXiv:1304.7762
- [100] Kulkarni, G., & Loeb, A. 2012, MNRAS, 422, 1306
- [101] Krajnović D., Cappellari M., de Zeeuw P. T., Copin Y., 2006, MNRAS, 366, 787
- [102] Krajnović, D., Karick, A. M., Davies, R. L., et al. 2013, MNRAS, 433, 2812
- [103] Kroupa P., 2001, MNRAS, 322, 231
- [104] Laine, S., van der Marel, R. P., Lauer, T. R., Postman, M., ODea, C. P., & Owen, F. N. 2003, AJ, 125, 478
- [105] Las̈ker R., Ferrarese L., van de Ven G., 2014, ApJ, 780, 69
- [106] Lauer, T. R. 1985, ApJ, 292, 104
- [107] Lauer T. R., 2012, ApJ, 759, 64
- [108] Lauer T. R., Ajhar, E. A., Byun, Y.-I., et al. 1995, AJ, 110, 2622
- [109] Lauer T. R., et al. 2005, AJ, 129, 2138
- [110] Lauer T. R., et al., 2007a, ApJ, 662, 808
- [111] Lauer T. R., et al., 2007b, ApJ, 664, 226
- [112] Lauer, T. R., Gebhardt, K., Richstone, D., et al. 2002, AJ, 124, 1975
- [113] Laurikainen E. et al. 2013, MNRAS, 430, 3489
- [114] Laurikainen E., Salo H., Buta R., 2005, MNRAS, 362, 1319
- [115] Laurikainen E., Salo H., Buta R., Knapen J. H., & Comerón S. 2010, MNRAS, 405, 1089
- [116] Laurikainen E., Salo H., Buta R., Knapen J. H., 2011, MNRAS, 418, 1452
- [117] Li Z.-Y., Ho L. C., Barth A. J., & Peng C. Y. 2011, ApJS, 197, 22
- [118] Liu, X., Shen, Y., Bian, F., Loeb, A., & Tremaine, S. ApJ, 789, 140
- [119] Liu F. S., Xia X. Y., Mao S., Wu H., Deng Z. G., 2008, MNRAS, 385, 23
- [120] Magorrian J., et al. 1998, AJ, 115, 2285
- [121] McGlynn T., 1984, ApJ, 281, 13
- [122] Machacek, M., Ashby, M. L. N., Jones, C.,& Bastian, N., 2009, ApJ, 691, 1921
- [123] Machacek, M., Nulsen, P. E. J., Stirbat, L., Jones, C.,&Forman, W. R. 2005, ApJ, 630, 280
- [124] Man, A. W. S., Toft, S., Zirm, A. W., Wuyts, S., & van der Wel, A. 2012, ApJ, 744, 85
- [125] Marconi, A., & Hunt, L. K. 2003, ApJ, 589, L21
- [126] Martizzi, D., Teyssier, R., & Moore, B. 2012, MNRAS, 420, 2859
- [127] Martizzi, D., Teyssier, R., & Moore, B. 2012, MNRAS, 432, 1947
- [128] Merritt D., 2006, ApJ, 648, 976
- [129] Michard, R., & Prugniel, P. 2004, A&A, 423, 833
- [130] Mihos J. C., & Hernquist L. 1994, ApJ, 437, L47
- [131] Milosavljević M., & Merritt D. 2001, ApJ, 563, 34
- [132] Milosavljević M., Merritt D., Rest A., & van den Bosch F. C. 2002, MNRAS, 331, L51
- [133] Naab T., Khochfar S., Burkert A., 2006, ApJ, 636, L81
- [134] Navarro J. F., Eke V. R., Frenk C. S., 1996, MNRAS, 283, L72
- [135] Ostriker J. P., Hausman M. A., 1977, ApJ, 217, L125
- [136] Paturel G., Petit C., Prugniel P., Theureau G., Rousseau J., Brouty M., Dubois P., Cambrésy L., 2003, A&A, 412, 45
- [137] Peirani S., Kay S., Silk J., 2008, A&A, 479, 123
- [138] Postman M., et al., 2012, ApJ, arXiv:1205.3839
- [139] Postman M., & Geller M. J. 1984, ApJ, 281, 95
- [140] Prugniel, P., Nieto, J. L., Bender, R., et al. 1988, A&A, 204, 61
- [141] Quilis V., Moore B., & Bower R. 2000, Science, 288, 1617
- [142] Ravindranath S., Ho L. C., & Filippenko A. V. 2002, ApJ, 566, 801
- [143] Ravindranath, S., Ho, L. C., Peng, C. Y., Filippenko, A. V., & Sargent, W. L. W. 2001, AJ, 122, 653
- [144] Read J. I., Gilmore G., 2005, MNRAS, 356, 107
- [145] Reda F., Forbes D., Hau G., 2005, MNRAS, 360, 693 Davies J., & Schafer J. 2001, AJ, 121, 2431
- [146] Rest, A., van den Bosch, F. C., Jaffe, W., et al. 2001, AJ, 121, 2431
- [147] Richings A. J., Uttley P., Krding E., 2011, MNRAS, 415, 2158
- [148] Richstone D., et al. 1998, Nature, 395, 14
- [149] Rodriguez, C., Taylor, G. B., Zavala, R. T., et al. 2006, ApJ, 646, 49
- [150] Rusli, S. P., Thomas, J., Saglia, R. P., et al. 2013, AJ, 146, 45
- [151] Salpeter E. E., 1955, ApJ, 121, 161
- [152] Saglia R. P., Bertschinger E., Baggley G., Burstein D., Colless M., Davies R. L., McMahan R. K., Jr, Wegner G., 1997, ApJS, 109, 79
- [153] Sandage A., Tammann G. A., 1981, Revised Shapley-Ames Catalogue of Bright Galaxies. Carnegie Institution, Washington
- [154] Schombert J., Smith A., 2012, PASA, 29, 174
- [155] Scott N., et al., 2014, MNRAS, 441, 274
- [156] Seigar, M. S., Graham, A. W., & Jerjen, H. 2007, MNRAS, 378, 1575
- [157] Sérsic J. L. 1968, Atlas de Galaxias Australes (Cordoba: Observatorio Astronomico)
- [158] Smith R. J., Lucey J. R., Hudson M. J., Schlegel D. J., Davies R. L., 2000, MNRAS, 313, 469
- [159] Spiniello C., Trager S. C., Koopmans L. V. E., Chen Y. P., 2012, ApJ, 753, L32
- [160] Statler T. S., McNamara B. R. ApJ 2002;581:1032
- [161] Statler, T. S., Smecker-Hane, T., & Cecil, G. 1996, AJ, 111, 1512
- [162] Steinmetz, M., & Navarro, J. F. 2002, NewA, 7, 155
- [163] Tal, T., van Dokkum, P. G., Nelan, J., & Bezanson, R. 2009, AJ, 138, 1417
- [164] Tonry J. L., et al., 2001, ApJ, 546, 681
- [165] Trager S. C., Faber S. M., Worthey G., González J. J., 2000, AJ, 119, 1645 3
- [166] Trujillo I., Erwin P., Asensio Ramos A., & Graham A. W. 2004, AJ, 127, 1917
- [167] van Albada T., 1982, MNRAS, 201, 939
- [168] Volonteri M., Haardt F., Madau P., 2003, ApJ, 582, 559
- [169] Wegner, G. A., Corsini, E. M., Thomas, J., et al. 2012, AJ, 144, 78
- [170] Whitmore, B. C., Miller, B. W., Schweizer, F., & Fall, S. M. 1997, AJ, 114, 1797
- [171] Xu, C. K., Zhao, Y., Scoville, N., et al. 2012, ApJ, 747, 85
- [172] Young C. K., & Currie M. J. 1994, MNRAS, 268, L11
- [173] Zaritsky D., Gil de Paz A., Bouquin A. Y. K., 2014, ApJ, 780, L1