Importance of non-parabolic band effects in the thermoelectric properties of semiconductors
Abstract
We present an analysis of the thermoelectric properties of of -type GeTe and SnTe in relation to the lead chalcogenides PbTe and PbSe. We find that the singly degenerate conduction bands of semiconducting GeTe and SnTe are highly non-ellipsoidal, even very close to the band edges. This leads to isoenergy surfaces with a strongly corrugated shape that is clearly evident at carrier concentrations well below 0.005 per formula unit (7 - 9 1019cm-3 depending on material) Analysis within Boltzmann theory suggests that this corrugation may be favorable for the thermoelectric transport. Our calculations also indicate that values of the power factor for these two materials may well exceed those of PbTe and PbSe. As a result these materials may exhibit -type performance exceeding that of the lead chalcogenides.
Electronic properties of semiconductors, and thermoelectrics in particular, are typically understood using parabolic band models. Within these models the electronic structure and transport is governed by an effective mass, and anisotropy is quantified by the use of anisotropic effective mass tensors. Non-parabolicity in finite gap semiconductors is normally characterized by an energy and/or temperature dependent mass, and is taken as a weak effect as it must be sufficiently close to the band edge with a finite gap. Transport is then understood in terms of parabolic band expressions with a varying effective mass. In the context of thermoelectrics these expressions imply limitations to performance. Specifically, thermoelectric materials, which are heavily doped semiconductors, require both high thermopower and high conductivity. However, for a given carrier concentration and temperature the thermopower increases with effective mass, while the mobility (and conductivity) decreases.
Here we elucidate a different effect of non-parabolicity that can overcome this difficulty. Within a parabolic band picture, the isoenergy surfaces in the band structure, which govern transport take the shape of ellipsoids. In large Fermi surface metals and in cases where the bands are degenerate at the band edge (e.g. the derived conduction band minimum of some transition metal oxides) more complex shapes are possible, and this can be beneficial in overcoming the above conundrum. usui ; shirai2013mechanism Here we show that there can be large deviations from the ellipsoidal shapes that are usually described by an effective mass tensor even for relatively low carrier concentrations of relevance to thermoelectrics. This is the case even without band degeneracy. Furthermore, this electronic feature may be beneficial for thermoelectric properties. Specifically, we discuss two narrow gap semiconductors, GeTe and SnTe, which have conduction band structures that are not only anisotropic (i.e. with different effective masses in different directions) and non-parabolic, but in fact also have a novel corrugated structure in the doping range near the band edges that appears to affect thermoelectric performance. This cannot be captured within parabolic band models, even with an anisotropic effective mass tensor.
We show by first principles calculations that the performance of these -type materials may potentially outstrip that of the -type lead chalcogenides PbTe and PbSe. This is of considerable importance given that the best -type for these chalcogenides has significantly lagged the best reported -type values of (see for example Ref. zhang, ). We contrast these two materials with PbTe and PbSe, which do not show this corrugated structure.
We begin with the observation that many of the high-ZT materials, such as PbTe, Bi2Te3 and PbSe have highly anisotropic band structures. chung2000csbi4te6 ; mishra1997electronic ; wang2007enhanced ; takeuchi2004contribution ; pei2011convergence Typically, they have Fermi surfaces with rather different masses along different directions. When the symmetry of the material is taken into account, Fermi surface pocket degeneracy ensures that all directions (in the case of the cubic rock-salt structure compounds given above) or all planar directions (for rhombohedral Bi2Te3) average transport from both heavy and light bands. This leads to both high thermopower and high electrical conductivity. This thus represents one means of solving the conundrum of attaining both these properties in the same bulk material. The chalcogenides considered here have conduction band minima at the -point of the Brillouin zone.
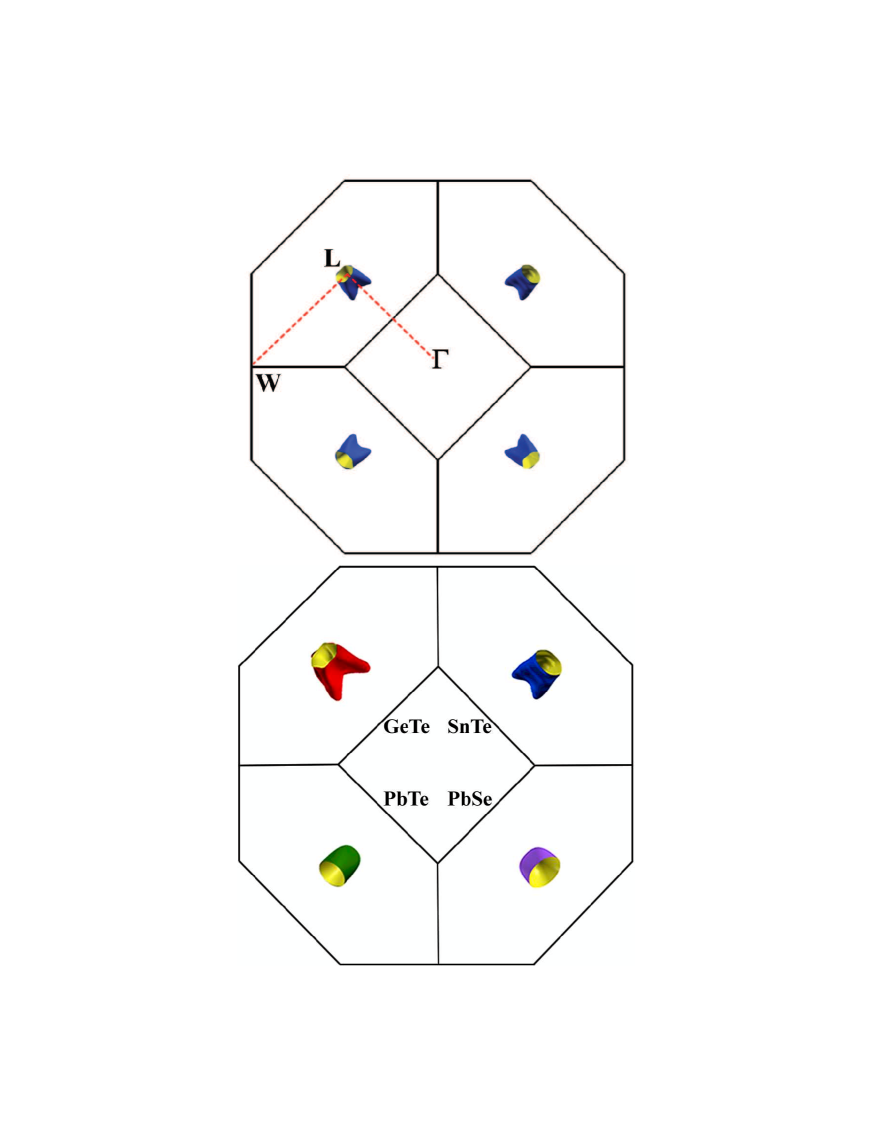
The top panel of Fig. 1 shows isoenergy surfaces for SnTe near the conduction band minimum, while the bottom panel of Fig. 1 shows a comparison of the four compounds, GeTe, SnTe, PbTe and PbSe. These are based on calculations with augmented plane-wave plus local orbital (APW+lo) method, sjostedt2000alternative as implemented in the WIEN2K code.wien2k We included spin-orbit coupling in our calculations and employed the modified Becke-Johnson potential of Tran and Blaha (TB-mBJ), tran2009accurate which can generally yield accurate electronic band structures and gaps for simple semiconductors and insulators. tran2009accurate ; singh2010electronic ; koller2011merits Within a parabolic band model, these constant energy surfaces must take the shape of an ellipsoid of revolution about the - line, which the actual surfaces do for very low carrier concentrations. It is clear from Fig. 1 that the electron pockets in SnTe have a corrugated shape, obviously different from that in PbTe and PbSe, where the pockets are relatively close to ellipsoids. This is even more noticeable in GeTe. Note that there is still substantial Kane-band (i.e. quasilinear dispersion) non-parabolicity in all four materials (as is evident in the band structure plots in Figure 2), but the corrugated character is absent in PbTe and PbSe.
We note also from the Table that the difference in heavy and light masses ( a form of anisotropy) is greatest for SnTe and GeTe and significantly smaller for PbTe and PbSe. This is also a contributor to improved transport in these materials, as the lighter band leads to good conductivity and the heavier band to good thermopower, a scenario explored in Ref. kuroki2007pudding, .
A simple argument (supported by calculations, below) explains the benefits to thermoelectric transport of the corrugated Fermi surfaces. Briefly, the effect of the corrugation is to increase the area of the Fermi surface for a given carrier concentration (the volume contained within the Fermi surface). A larger area implies the presence of more electronic states, or equivalently a larger electronic density of states, which as is well known leads to larger thermopower for a given carrier concentration. Note, however, that this larger density-of-states is achieved without a corresponding reduction in the electronic conductivity, as occurs in the simple case of an decrease in band dispersion, or equivalently an increase in dispersive mass. Instead the density of states effective mass is increased by the corrugated structure, but the dispersive mass (i.e. ) is not. This is similar to, but distinct from, the “heavy-band” effect in the -type lead chalcogenides, which also increases the density-of-states without an increase in dispersive mass.
We note that in a microscopic model, the scattering rate is sometimes taken as proportional to the electronic density-of-states (DOS), so that in this scenario the increased DOS associated with the corrugation could lead to increased scattering rates, hampering transport. We have not attempted to quantify or assess such an effect, but note that the aforementioned “heavy-band” effect in the lead chalcogenides would in this scenario also lead to reduced transport, which does not occur - in fact, the -type lead chalcogenides show the highest values of any bulk material. One additional piece of information comes from computed values cohen of the electron-phonon coupling constant in -type GeTe and SnTe, which are comparable and do not exceed 0.24 at any doping less than 2 cm-3, a doping far heavier than optimal for these two materials (in fact, at optimal doping the computed values fall between 0.1 and 0.18). These relatively low values of the electron-phonon coupling for GeTe and SnTe are strong evidence that good electronic conduction will in fact occur in these materials.
Results
For an isotropic parabolic band, the conductivity can be expressed in terms
of the effective mass and the carrier concentration
, .
Since the electrical conductivity intrinsically
involves a scattering time , where is the scattering
parameter, here we adopt two different approximations on .
One is CSTA (= 0),
as widely used in ab-initio calculations, including those in this paper.
In the other approximation, is
considered to be affected by the acoustic-mode lattice scattering ( = -1/2),
as considered in
Refs. kim2009influence, ; cornett2012effect, ; neophytou2011effects, ; ParkerDavid2013-prl, ,
which we here note as ASTA. Then, considering
the band degeneracy of 8 for our cases here (2 for spin and 4 coming from
the number of electron pockets), we can derive the following expressions for
thermopower within CSTA and ASTA according to the Mott formula snyder2008 ,
,
where is the Fermi energy,
| (1) |
| (2) |
| GeTe | SnTe | PbTe | PbSe | |
|---|---|---|---|---|
| 0.022 | 0.021 | 0.040 | 0.081 | |
| 0.49 | 0.18 | 0.32 | 0.18 |
It is clear that with parabolic bands the thermopower is proportional to for both approximations. Note that the main effect of the ASTA is a reduction in thermopower relative to the CSTA. For the comparison of SnTe and GeTe with PbTe and PbSe we adopt the CSTA for all materials for consistency and note that the likely effect of using ASTA would simply be a reduction in calculated thermopower for all four materials. As will be seen, the likely advantages of SnTe and GeTe may well dwarf any potential effects of neglecting the relaxation time energy dependence.
Note also that the Mott relation is inherently a single band formula and neglects the effects of bipolar conduction. However, as is the case here, the region of likely optimal doping (i.e., likely largest ) is generally at concentrations heavier than that where bipolar conduction becomes significant (i.e. to the right of the thermopower maxima in Figure 4), where the single band Mott formula generally applies. To ensure a fair comparison with the specific compounds examined here, we also calculate the effective masses for the lowest conduction bands of GeTe, SnTe, PbTe and PbSe, as shown in Table 1. These masses were calculated from a parabolic fitting of the dispersion very near the conduction band minima, with axes chosen as the principal axes of the ellipsoids (which run perpendicular to the Brillouin zone face around the L point).
We note that the effective mass of GeTe is the most different along transverse (–) and longitudinal directions (–), as reflected in the large anisotropy seen in its electron pockets (see Fig. 1). SnTe also shows very anisotropic, non-ellipsoidal pockets although the difference is not as large as in GeTe. Therefore, we chose the heavy effective mass of SnTe (0.18 , with the free electron mass) in the parabolic model calculations.
These differences can be seen more directly in Figure 2, which plots the band structures and densities-of-states of the four compounds. The conduction band DOS rises from the band edge much more rapidly for SnTe and GeTe than the other two compounds, indicative of the larger effective DOS mass of these two compounds. This is responsible for the larger and comparable thermopower in these materials, irrespective of the large mass of GeTe relative to SnTe (at 700 K the thermopower samples electronic structures larger than the energy window within which effective masses were determined). Correspondingly, the conduction band for these two compounds shows only a moderate dispersion of 0.9 eV from the L to W points, while the value is roughly double this for the other two compounds. In addition, SnTe and GeTe show near-degeneracies at the band edge, with at least one additional band minima only 0.15 eV above the CBM in GeTe and 0.4 eV above in SnTe. These degeneracy differences, combined with the fact that the light-mass (as shown in the Table) for these two compounds is lower than for PbSe and PbTe, suggest that the conductivity of SnTe and GeTe is likely to be substantial. Indeed this is the case, as Figure 3 depicts the calculated values of for all compounds, showing in fact a slight advantage for SnTe and GeTe.
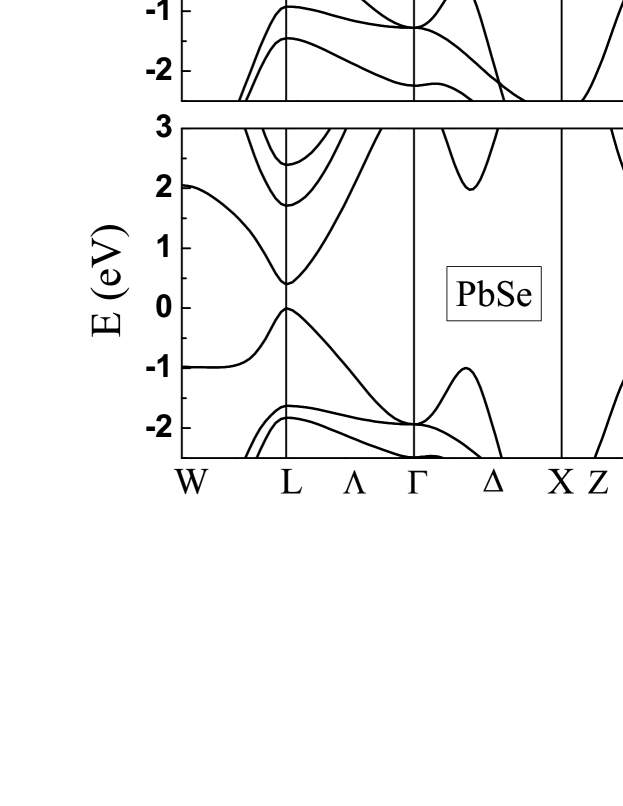
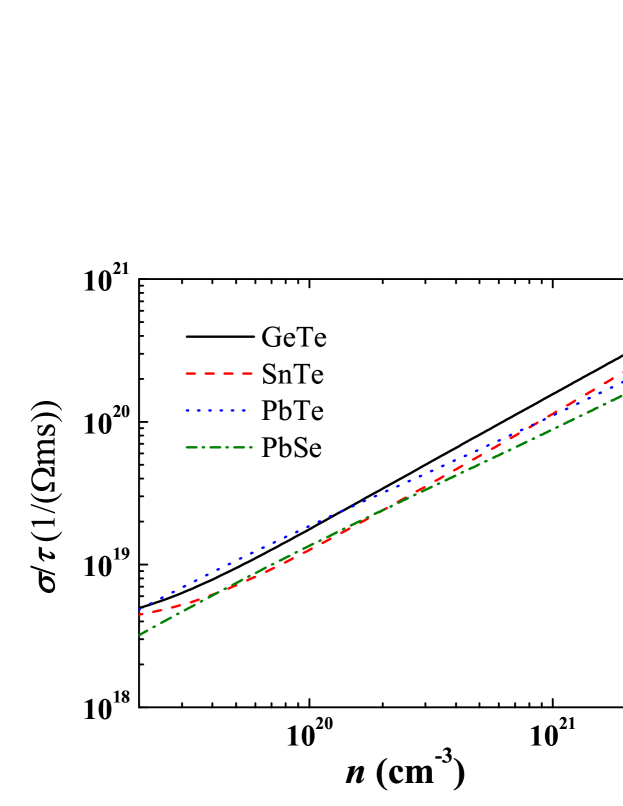
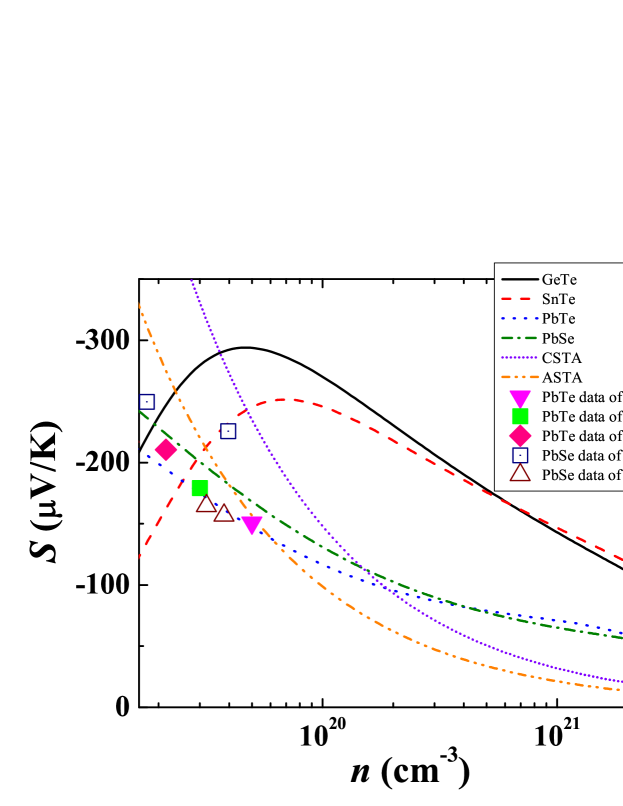
Figure 4 shows the thermopower, calculated within semiclassical Boltzmann transport theory and the CSTA (see the Methods section) at = 700 K. We have chosen this temperature as it is above the rhombohedral to cubic phase transition temperature of 670 K for GeTe, and is also a typical temperature for high temperature thermoelectric work. While for applications such phase transitions can be a negative, in this work we are studying thermoelectric performance irrespective of any application. Note that our first principles calculations follow fairly closely the existing experimental data on PbTe and PbSe, indicating the validity of our approach.
It is clear that the behavior of for -type GeTe and SnTe is significantly superior to that of PbTe and PbSe consistent with previous numerical results. xu2011thermoelectric ; singh2010thermopower The enhanced thermopower in -type GeTe and SnTe comes from the corrugated Fermi surface character that increases the Fermi surface area so that more electronic states contribute to transport. Furthermore, the thermopower of GeTe and SnTe obviously exceeds the parabolic band model values obtained within CSTA at doping levels larger than 3.61019 and 4.81019 cm-3, for the two compounds, respectively. This is the range where the properties are consistent with good thermoelectric performance. The beneficial effect of the non-parabolic band structure is increased in the ASTA. ( is one and a half times larger than according to the Eqs. (1) and (2)). The lead salts PbTe and PbSe also have a larger thermopower than the parabolic case within ASTA at doping levels of 5.91019 and 3.91019 cm-3, respectively.
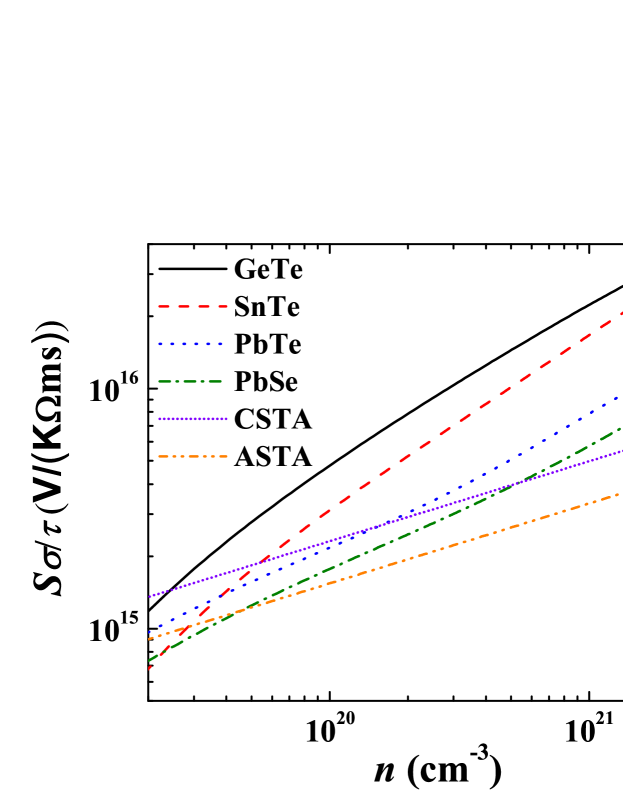
It is instructive, in order to isolate the effect of the corrugation, to consider the transport quantity (Fig. 5), as the effective mass in the expressions of and cancel in this product. It is clearly seen from Fig. 5 GeTe and SnTe have values that substantially exceed those of the general parabolic case over a wide range of carrier concentration. This appears to be due to the corrugation. PbTe and PbSe show higher than the parabolic case at a doping level of the order 1020 cm-3. Remembering the larger in the specific anisotropic non-parabolic compounds, they have a much enhanced thermoelectric performance (proportional to power factor ) than those of the parabolic case although actual values clearly depend on the details of the scattering.
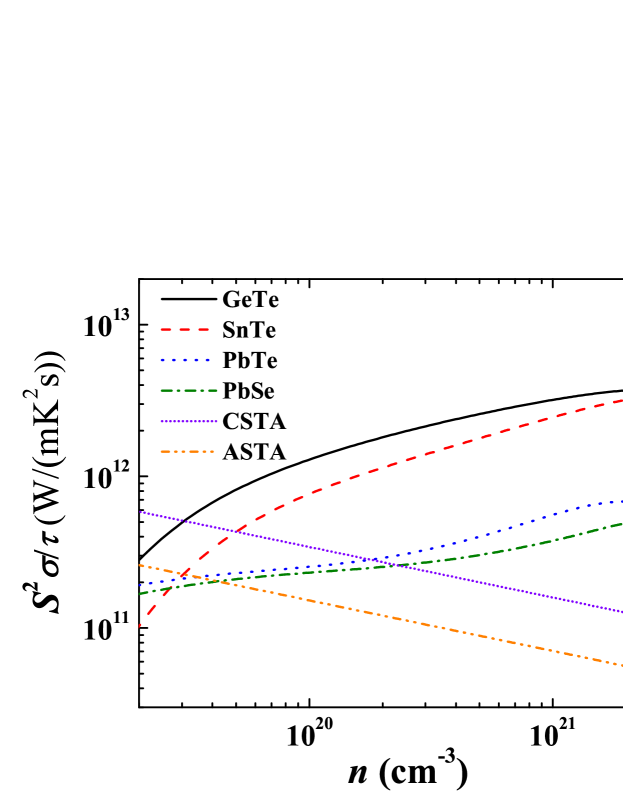
Since for the actual quantiitative performance what is most critical is the power factor , rather than , in Figure 6 we present a plot of the power factor (with respect to scattering time ) S for each of the four materials for a range of carrier concentration. While mean scattering times can and do vary from material to material, such a difference is likely overshadowed by the band structure effects depicted in Figure 4, which shows the substantial advantage of SnTe and GeTe relative to PbTe and PbSe. At the heavy dopings around cm-3, where thermoelectric performance is likely optimal for SnTe and GeTe, the power factor is approximately seven times as large as for the other two materials. While it is true that the relaxation times may differ, we take this plot as strong evidence for good thermoelectric performance in SnTe and GeTe.
Discussion
In evaluating the transport coefficients for an isotropic parabolic band as
above, the effective mass has a direct relationship with the carrier
concentration , which is dependent on the volume
of the Fermi surface
, .
For the anisotropic case,
the effective mass is a second-rank tensor. in the
light mass direction at a given increases relative
to the isotropic case because the carrier
concentration will be larger than that of the isotropic system with light
mass in all directions. Accordingly, the conductivity of the anisotropic
case will be higher if the scattering rate is not proportionately enhanced.
On the other hand, , which is proportional to
at low temperature,
the anisotropic system will have the same value as the isotropic light band
case with the same Fermi energy. Conversely, for the given carrier
concentration , the anisotropic system will have a lower than the
isotropic light band case, and therefore an increased .
Based on the above
discussion, the anisotropic case will have a better
thermoelectric performance than the isotropic light band system, supposing
the scattering is not changed a lot.
Now we turn to the isotropic system with a heavy band, just as the case we discussed in this work. The isotropic heavy band system could have an enhanced thermopower compared to the corrugated anisotropic case because of a lower for the same carrier concentration. But this is only true at the lower carrier densities as shown in Fig. 4. The dependence of on the carrier concentration is much weaker than the -(2/3) power law for the parabolic case. This means that with increasing carrier concentration, the thermopower in the corrugated case decreases much slower than for the isotropic case. Therefore, anisotropic corrugated case will have an enhanced at high doping levels. Taking GeTe as an example, at carrier concentrations larger than 2.61020cm-3, the thermopower of GeTe exceeds that of the general isotropic case with the heavy band mass of 0.49 using CSTA (not shown). On the other hand, it is obvious that anisotropic case will have a larger electronic velocity, and thus a higher conductivity than the isotropic system with heavy mass in all directions. As illustrated in Fig. 5, GeTe has a superior over the isotropic system at almost the entire carrier density ranges, which implies the higher conductivity in GeTe. Specifically, the logarithmic increase rate in GeTe over the range shown is 0.7, i.e. roughly double the parabolic value of 1/3. Thus, in anisotropic systems of this type the linkage of thermopower and electrical conductivity is broken so that one may have effectively heavy carriers that contribute to large , and at the same time light carriers that provide high in a single band system. Related arguments have been made in the context of oxides NaxCoO2, SrTiO3, and KTaO3,kuroki2007pudding ; usui ; shirai2013mechanism ; fan with complex multiband conduction band minima from degenerate bands or a highly two dimensional metallic band structure as in NaxCoO2. xiang-nac Here we find that such effects are important even with a singly degenerate band near the conduction band minimum of SnTe and GeTe.
In conclusion, we find that anisotropy beyond the level possible in parabolic, ellipsoidal band models may strongly influence transport properties even for moderately doped semiconductors with finite gaps, and that this appears to be favorable for thermoelectric performance. This is illustrated by detailed calculations for GeTe and SnTe. Based on our Boltzmann transport calculations, the -type performance of these materials may exceed that of the lead chalcogenides PbTe and PbSe. We hope that our current findings will stimulate future experimental exploration of the thermoelectric properties of these materials, particularly -type SnTe and alloys.
Methods
Transport properties of a crystalline solid, including the thermopower and
conductivity (here is an average scattering time) are calculated within
Boltzmann transport theory,
based on the electronic structure.madsen2006boltztrap
We performed electronic structure calculations using
full-potential APW+lo method, using WIEN2K wien2k including spin-orbit coupling.
To obtain reliable transport properties, a dense
484848 -point mesh
in the Brillouin zone was used.
The expressions for the electrical conductivity and the
thermopower are:
| (3) |
| (4) |
where is the Fermi function, is the chemical potential, and (E) is the transport function given by . The transport coefficients are tensors, but we omit the subscripts in the present work because of the cubic symmetry. Calculations based on these formulas with actual band structures have proven useful in rationalizing and predicting transport properties of known compounds. scheidemantel ; bertini ; lykke ; hamada ; parker ; wang2007enhanced ; chen-cu2o ; parker2010high ; madsen2003electronic Here we used the BoltzTraP code. madsen2006boltztrap The conductivity can only be calculated with respect to the relaxation time using the preceding expressions. However, within the constant scattering time approximation (CSTA) the thermopower can be obtained directly from the band structure information without adjustable parameters. This approximation consists of assuming that the energy dependence of the relaxation time at a given doping level and temperature is negligible on the scale of , and has shown considerable success in describing the thermopower of a large number of materials.
References
- (1) Usui, H., Shibata, S. & Kuroki, K. Origin of coexisting large Seebeck coefficient and metallic conductivity in the electron doped SrTiO3 and KTaO3. Phys. Rev. B 81, 205121 (2010).
- (2) Shirai, K. & Yamanaka, K. Mechanism behind the high thermoelectric power factor of SrTiO3 by calculating the transport coefficients. J. Appl. Phys. 113, 053705–053705 (2013).
- (3) Zhang, Q. et al. Heavy doping and band engineering by potassium to improve the thermoelectric figure of merit in p-type PbTe, PbSe, and PbTe1ySey. J. Am. Chem. Soc. 134, 10031 (2012).
- (4) Chung, D.-Y. et al. CsBi4Te6: A high-performance thermoelectric material for low-temperature applications. Science 287, 1024–1027 (2000).
- (5) Mishra, S., Satpathy, S. & Jepsen, O. Electronic structure and thermoelectric properties of bismuth telluride and bismuth selenide. J. Phys.: Condens. Matter 9, 461 (1997).
- (6) Wang, Y. et al. Enhanced thermoelectric performance of PbTe within the orthorhombic Pnma phase. Phys. Rev. B 76, 155127 (2007).
- (7) Takeuchi, T. et al. Contribution of electronic structure to the large thermoelectric power in layered cobalt oxides. Phys. Rev. B 69, 125410 (2004).
- (8) Pei, Y. et al. Convergence of electronic bands for high performance bulk thermoelectrics. Nature 473, 66–69 (2011).
- (9) Sjöstedt, E., Nordström, L. & Singh, D. An alternative way of linearizing the augmented plane-wave method. Solid State Comm. 114, 15–20 (2000).
- (10) Blaha, P., Schwarz, K., Madsen, G., Kvasnicka, D. & Luitz, J. WIEN2k, An Augmented Plane Wave + Local Orbitals Program for Calculating Crystal Properties (K. Schwarz, Tech. Univ. Wien, Austria) (2001).
- (11) Tran, F. & Blaha, P. Accurate band gaps of semiconductors and insulators with a semilocal exchange-correlation potential. Phys. Rev. Lett. 102, 226401 (2009).
- (12) Singh, D. J. Electronic structure calculations with the Tran-Blaha modified Becke-Johnson density functional. Phys. Rev. B 82, 205102 (2010).
- (13) Koller, D., Tran, F. & Blaha, P. Merits and limits of the modified Becke-Johnson exchange potential. Phys. Rev. B 83, 195134 (2011).
- (14) Allen, P. B. & Cohen, M. L. Carrier-concentration-dependent superconductivity in SnTe and GeTe. Phys. Rev. 177, 704–706 (1969). URL http://dx.doi.org/10.1103/PhysRev.177.704.
- (15) Kim, R., Datta, S. & Lundstrom, M. S. Influence of dimensionality on thermoelectric device performance. J. Appl. Phys. 105, 034506–034506 (2009).
- (16) Cornett, J. E. & Rabin, O. Effect of the energy dependence of the carrier scattering time on the thermoelectric power factor of quantum wells and nanowires. Appl. Phys. Lett. 100, 242106–242106 (2012).
- (17) Neophytou, N. & Kosina, H. Effects of confinement and orientation on the thermoelectric power factor of silicon nanowires. Phys. Rev. B 83, 245305 (2011).
- (18) Parker, D., Chen, X. & Singh, D. J. High three-dimensional thermoelectric performance from low-dimensional bands. Phys. Rev. Lett. 110, 146601 (2013).
- (19) Snyder, G. J. & Toberer, E. S. Complex thermoelectric materials. Nature materials 7, 105–114 (2008).
- (20) Androulakis, J. et al. High-temperature charge and thermal transport properties of the -type thermoelectric material PbSe. Phys. Rev. B 84, 155207 (2011). URL http://dx.doi.org/10.1103/PhysRevB.84.155207.
- (21) Ravich, Y. I., Efimova, B. A. & Tamarchenko, V. I. Scattering of current carriers and transport phenomena in lead chalcogenides ii. experiment. physica status solidi (b) 43, 453–469 (1971). URL http://dx.doi.org/10.1002/pssb.2220430202.
- (22) Zhu, P. et al. Enhanced thermoelectric properties of PbTe alloyed with Sb2 Te3. Journal of Physics: Condensed Matter 17, 7319 (2005).
- (23) Pei, Y., LaLonde, A., Iwanaga, S. & Snyder, G. J. High thermoelectric figure of merit in heavy hole dominated PbTe. Energy Environ. Sci. 4, 2085–2089 (2011). URL http://dx.doi.org/10.1039/C0EE00456A.
- (24) Zhang, Q. et al. Enhancement of thermoelectric figure-of-merit by resonant states of aluminium doping in lead selenide. Energy Environ. Sci. 5, 5246–5251 (2012). URL http://dx.doi.org/10.1039/C1EE02465E.
- (25) Xu, L., Wang, H.-Q. & Zheng, J.-C. Thermoelectric properties of PbTe, SnTe, and GeTe at high pressure: an ab initio study. J. Electron. Mater. 40, 641–647 (2011).
- (26) Singh, D. J. Thermopower of SnTe from Boltzmann transport calculations. Func. Mater. Lett. 3, 223–226 (2010).
- (27) Kuroki, K. & Arita, R. ”Pudding mold” band drives large thermopower in NaxCoO 2. J. Phys. Soc. Jpn. 76, 083707 (2007).
- (28) Fan, X., Zheng, W., Chen, X. & Singh, D. J. 2degs at perovskite interfaces between KTaO3 or KNbO3 and stannates. arXiv:1307.1376 (2013).
- (29) Xiang, H. J. & Singh, D. J. Suppression of thermopower of NaxCoO2 by an external magnetic field: Boltzmann transport combined with spin-polarized density functional theory. Phys. Rev. B 76, 195111 (2007).
- (30) Madsen, G. K. & Singh, D. J. Boltztrap. a code for calculating band-structure dependent quantities. Comput. Phys. Commun. 175, 67–71 (2006).
- (31) Scheidemantel, T. J., Ambrosch-Draxl, C., Thonhauser, T., Badding, J. V. & Sofo, J. O. Transport coefficients from first-principles calculations. Phys. Rev. B 68, 125210 (2003).
- (32) Bertini, L. & Gatti, C. The impact of the actual geometrical structure of a thermoelectric material on its electronic transport properties: The case of doped skutterudite systems. J. Chem. Phys. 121, 8983 (2004).
- (33) Lykke, L., Iversen, B. B. & Madsen, G. K. H. Electronic structure and transport in the low-temperature thermoelectric CsBi4Te6: Semiclassical transport equations. Phys. Rev. B 73, 195121 (2006).
- (34) Hamada, N., Imai, T. & Funashima, H. Thermoelectric power calculation by the Boltzmann equation: NaxCoO2. J. Phys.: Condens. Matter 19, 365221 (2007).
- (35) Parker, D. & Singh, D. J. Potential thermoelectric performance from optimization of hole-doped Bi2Se3. Phys. Rev. X 1, 021005 (2011).
- (36) Chen, X., Parker, D., Du, M. H. & Singh, D. J. Potential thermoelectric performance of hole-doped Cu2O. New J. Phys. 15, 043029 (2013).
- (37) Parker, D. & Singh, D. J. High-temperature thermoelectric performance of heavily doped PbSe. Phys. Rev. B 82, 035204 (2010).
- (38) Madsen, G. K., Schwarz, K., Blaha, P. & Singh, D. J. Electronic structure and transport in type-I and type-VIII clathrates containing Strontium, Barium, and Europium. Phys. Rev. B 68, 125212 (2003).
Author Contribution Statement
X.C., D.P. and D.J.S. wrote the manuscript. X.C. prepared figures 1-6. All authors reviewed the manuscript.
Additional Information
The authors declare no competing financial interests.
Acknowledgments
This work was supported by the Department of Energy,
Basic Energy Sciences,
through the S3TEC Energy Frontier Research Center.