A Clue To Magnetic Activity Occurring
On Near-Contact Binary V1003 Her
Abstract
Taking into account results obtained from models and analyses, we determined the nature and structures of V1003 Her. We analysed the light curves obtained in this study together with the available radial velocity curve. The analysis revealed that the inclination () of the system was found to be 45∘.822∘.71, while the semi-major axis () was computed as 2.9250.143 . The mass of the primary component was found to be 1.2040.004 , while it was obtained as 0.4500.006 for the secondary component. The radius of the primary component was computed as 1.4240.001 , while it was computed as 0.9040.001 for the secondary component. The analysis indicates that there are two spotted areas close to each other on the surface of the secondary component. In addition, B-band light and colour curves reveal that there is a radiation excess toward the phase of 0.40. This should be caused due to some heating of the surface by the events like thermal flare, or the structures like plage. Finally, the analysis and model demonstrated that V1003 Her should be a near-contact binary with high level magnetic activity on its surface.
keywords:
techniques: photometric — (stars:) binaries: eclipsing — stars: late-type — stars: individual: (V1003 Her)1 Introduction
V1003 Her (=GSC 01596-01204) is classified as a variable star of Scuti type in the SIMBAD Database. The variability seen in the system was found by Hipparcos satellite for the first time. V1003 Her was classified as a contact binary with a period of 0d.4933 from the spectral type A7 by Duerbeck (1997). Then, Høg et al. (2000) listed the system in the TYCHO-2 Catalogue, in which the brightness and colour are given as and . However, citing Breger et al. (1994, 1995), Rodr´guez et al. (2000) listed V1003 Her as a Scuti star with a period of 0d.2467. The system was observed in both the ASAS-3 Survey (Pojmánski, 1997, 2002) and the Northern Sky Variability Survey (hereafter NSVS) (Woźniak et al., 2004). V1003 Her was listed as ASAS 185318+2113.5 in the ASAS-3 database, while as NSVS 11074663 in the NSVS database. The data obtained in the ASAS-3 indicated the most probable period is 21d.846. Rucinski et al. (2008) obtained the radial velocity curves of the system with , and . They gave the light elements of the system as , while they mentioned that the system is from the spectral type of A7, indicating that this spectral type is in agreement with the colours given in the 2MASS Catalogue (Cutri et al., 2003). Deb et al. (2011) tried to analysis the data given in the ASAS-3 database. They found 3 possible periods such as , and . Then, they tried to analysis the mono-colour light curve obtained from the ASAS-3 database, which was phased with the period of , and they classified the system as a B-type contact binary. However, appraising both ASAS-3 and NSVS data, Rucinski et al. (2008) commentated that a detailed photometric observations are needed.
In this study, we obtained more detailed multi-colour light curves of the system. We adjusted the light elements using available minima times. Then, analysed the multi-colour light curves together with the radial velocity obtained by Rucinski et al. (2008) simultaneously. Our more detailed observations indicated that V1003 Her is a near-contact binary with high level magnetic activity on its surface.
2 Observations
Observations of the system were acquired with a thermoelectrically cooled ALTA pixel CCD camera attached to a 40 cm - Schmidt - Cassegrains - type MEADE telescope at Ege University Observatory. The observations were continued in BVR bands during four nights in 04, 18, 21 and 29 July 2011. Some basic parameters of program stars are listed in Table 1. The names of the stars are listed in first column, while J2000 coordinates are listed in next two columns. The V magnitudes are in fourth column, and B-V colours are listed in the last column. In table, the coordinates, brightness and colours were taken from the SIMBAD database.
Although the program and comparison stars are very close on the sky, differential atmospheric extinction corrections were applied. The atmospheric extinction coefficients were obtained from observations of the comparison stars on each night. Heliocentric corrections were also applied to the times of the observations. The mean averages of the standard deviations are 0m.023, 0m.011, and 0m.010 for observations acquired in the BVR bands, respectively. To compute the standard deviations of observations, we used the standard deviations of the reduced differential magnitudes in the sense comparisons (HD 343345) minus check (HD 343344) stars for each night. There was no variation observed in the standard brightness comparison stars.
There are a few light curves, such as those obtained from the ASAS-3 and the NSVS database, and so there are two trustable minima times in the literature, which were given by Rucinski et al. (2008) and Deb et al. (2011). In this study, we obtained new four minima times.
| (1) |
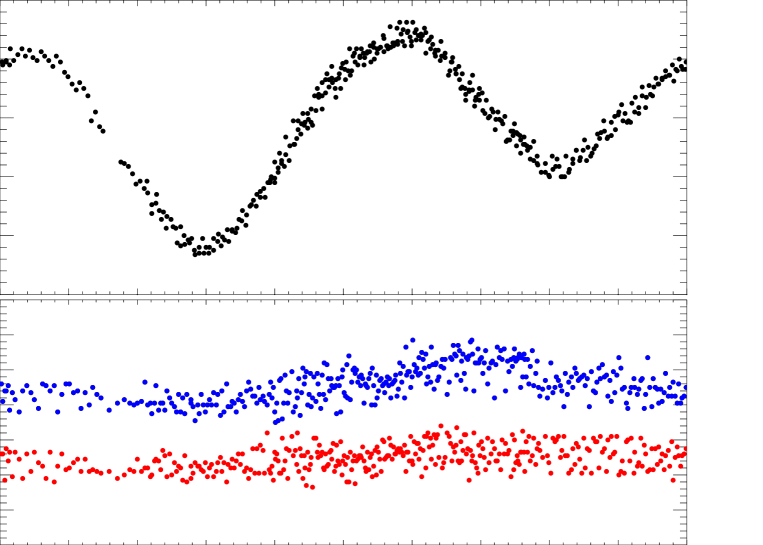
Using these six minima times listed in Table 2, we adjusted the light elements as given in Equation (1). Using these light elements, all observations were phased. The obtained light and colour curves are shown in Figure 1. In the figure, B light curve is seen in the upper panel, while the colour curves are shown in the bottom panel. In the bottom panel of the figure, curve is upper one, while the curve is bottom one.
3 Light Curve Analysis
The light curves obtained from both ASAS-3 data and NSVS data are rather noisy to reveal the general properties of the system. In fact, Deb et al. (2011) did not give any information about system apart from being a B-type contact binary. As seen from Figure 1, there is a noticeable distortion from the phase of 0.20 to 0.40. To understand the reason(s) of this distortion, we tried to model the light curves obtained in this study with the Wilson-Devinney Code (Wilson & Devinney, 1971; Wilson, 1990). For this aim, we analysed the light curves obtained in the BVR bands together with the available radial velocity curve simultaneously, using the PHOEBE V.0.31a software (Prša & Zwitter, 2005), which is used the version 2003 of Wilson-Devinney Code (Wilson & Devinney, 1971; Wilson, 1990). We tried to analyse the light curves in several different modes, such as the ”overcontact binary not in thermal contact” and ”double contact binary” modes. The initial analyses demonstrated that an astrophysical acceptable result can be obtained if the analysis is carried out in the ”overcontact binary not in thermal contact” mode, while no acceptable results could be obtained in the other mode.
Ammons et al. (2006) determined the temperature of the system as 6252 K. Thus, the temperature of the primary component was fixed to 6252 K in the analyses, and the temperature of the secondary was taken as a free parameter. Considering the spectral type corresponding to this temperature, the albedos ( and ) and the gravity darkening coefficients ( and ) of the components were adopted for the stars with the convective envelopes (Lucy, 1967; Rucinski, 1969). The non-linear limb-darkening coefficients ( and ) of the components were taken from van Hamme (1993). In the analyses, the fractional luminosity () of the primary component, the inclination (), mass ratio (), semi-major axis () were also taken as the adjustable free parameters.
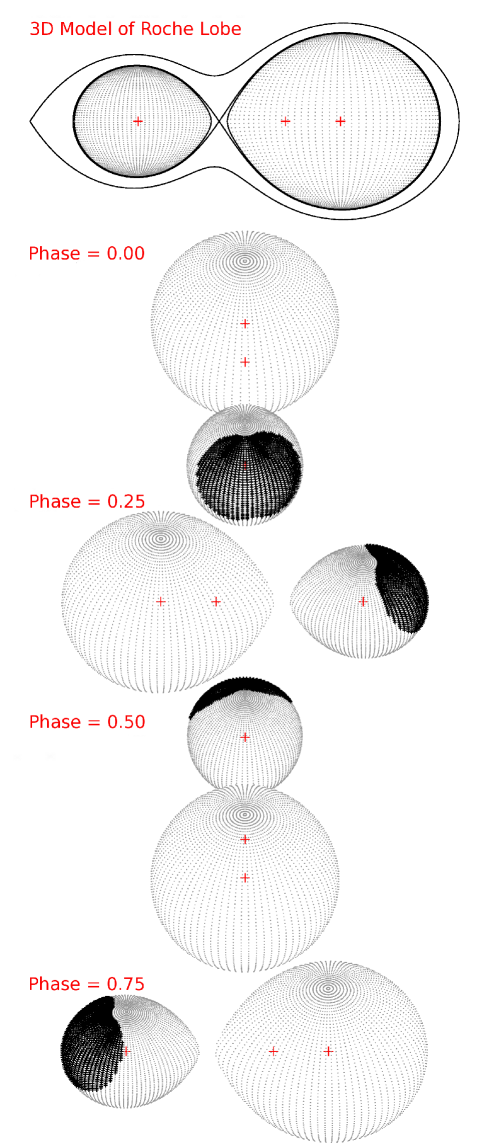
The inclination () of the system was found to be , while the mass ratio of the system was found to be 0.3740.008, and the semi-major axis () was computed as 2.9250.143 . In Table 3, all the parameters derived from the analyses are listed in detail, while the synthetic light curves are shown in Figures 2 and 3. In addition, we also derived the 3D model of Roche geometry, using the parameters obtained from the light curve analysis. The derived 3D model of Roche geometry is shown in Figure 4.
Depending on its surface temperature, the mass of the primary component was found to be 1.2040.004 , while the mass of the secondary component was found to be 0.4500.006 . Considering the semi-major axis, the radius of the primary component was computed as 1.4240.001 , while it was computed as 0.9040.001 for the secondary component. In addition, the luminosity of the primary component was computed as 2.7830.007 , and it was computed as 1.0780.004 for the secondary component.
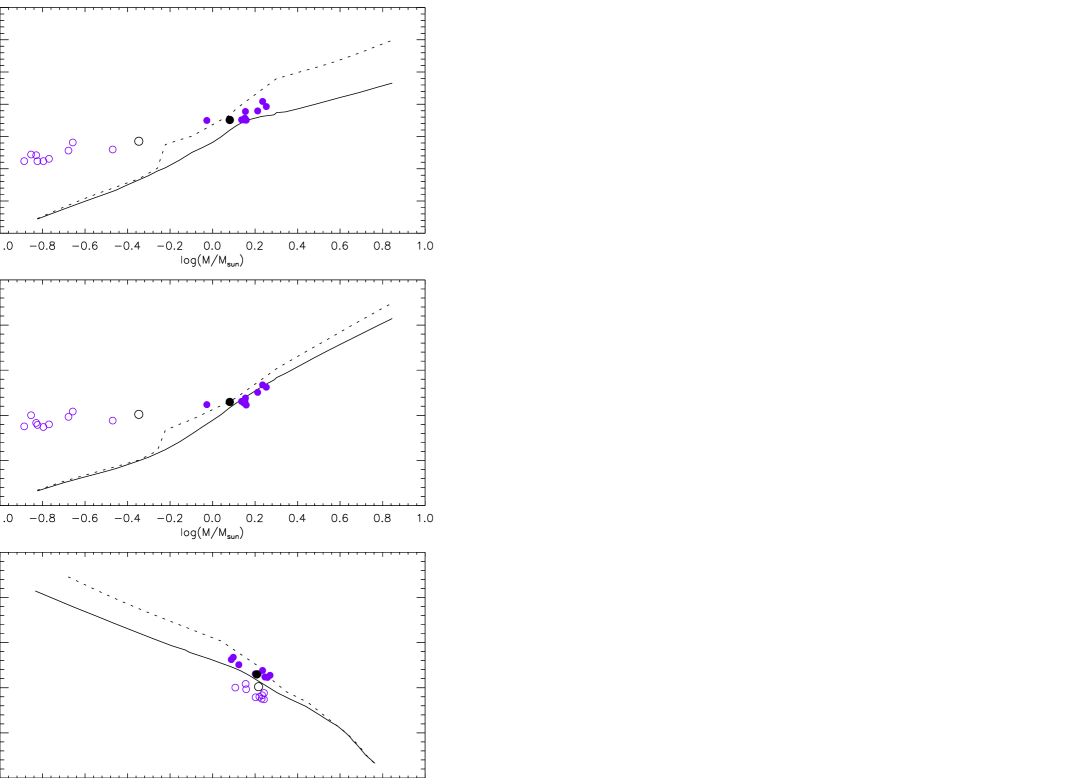
We compared the absolute properties of the system with the others in some planes, such as the mass-radius (), mass-luminosity (), and luminosity-effective temperature () planes. All the comparisons are shown in Figure 5. In the figures, the lines represent the ZAMS theoretical model developed for the stars with by Girardi et al. (2000), while dashed lines represent the TAMS theoretical model. The filled circles represent the primary components, while the open circles represents the secondary ones. The components of V1003 Her are located together with some samples of its analogues, such as YY CrB, DN Boo, CK Boo, CrA, FG Hya, TV Mus, AW UMa, GR Vir, V776 Cas. The sample systems were taken from Essam et al. (2010), and they are shown in purple colour, while V1003 Her is shown in black colour in Figure 5.
4 Discussion
The analyses of the detailed observations indicated that V1003 Her is very close to the edge of eclipse due to its the inclination () of in these radii. According to the results, the system is a chromospherically active binary system, though the components are the evolved stars.
Using all available minima times, the orbital period was adjusted as , and all the data obtained in this study were phased. We analysed the multi-band light curve simultaneously with available radial velocity curve obtained by Rucinski et al. (2008). The initial attempt of the analysis revealed that an acceptable results could be obtained in the case of analysis carrying out in the overcontact binary not in thermal contact mode. The mass ratio was found to be 0.3740.008 and the semi-major axis () was found to be 2.9250.143 . Assuming that the temperature of the primary component is 6252 K as determined by Ammons et al. (2006), the temperature of the secondary component was found to be 6192144 K. In this case, the fractional radii were found to be for the primary component and for the secondary one. Here, the sum of fractional radii is found to be so close to . In this point, according to Kopal (1956)’s criteria for the overcontact systems, V1003 Her seems to be a very strong candidate for the W UMa type binaries. Computing the absolute parameters of V1003 Her, we compared the system with its analogues in some planes, such as the mass-radius (), mass-luminosity (), and luminosity-effective temperature (). As it is seen from Figure 5, the components of the system are in agreement with their analogues. In all panels, V1003 Her seems to be a bit an evolved system.
However, as it is clearly seen from Figures 1, there is a dramatic asymmetry in the light curves. Because of this, we assumed that the secondary component has two cool spots on its surface to remove this asymmetry. The surface temperatures of the components are so close to each other, and so both of them can be a magnetically active star. However, it is well known that the spot solution suffers from non-uniqueness, we just assumed that the active one is the secondary star. In addition, assuming spotted star is the primary one, a similar solution can possibly be obtained.
On the other hand, as it is seen from Figure 3, the synthetic light curves do not absolutely fitted the observations between the phases of 0.20 and 0.40 for the B and V-bands. The synthetic curves located below the observations in the phase range. The case indicated that there is a radiation excess between this phase range. In fact, as it is seen from both and colour curves shown in Figure 1, the colours are also getting bluer towards this phase range. In addition, the colour is getting much bluer than the colour. Both the radiation excess in the light curves and the blue excess in the colours indicate any hot area on the surface of one of the component. Considering the existence of cool spots, this heating area should be related and caused by the magnetically activity. The case is a general phenomenon for the stars like this system. Chromospherically active stars, whose ages are close to solar age or over, exhibit some hot spots, such as faculae on the photosphere and plages in the chromosphere, as well as cool spots on the photosphere. Some of them also exhibit even the large flares (Wilson, 1994; Berdyugina, 2005). There are several analogues of these stars, such as X Tri (Strassmeier, 2009), And, II Peg (Frasca et al., 2008), V471 Tau (İbanoǧlu et al., 2005).
Although we tried to modelled the blue excess seen in the light curves with some hot spots as some structures like faculae, the synthetic curves obtained from these models do not simultaneously fit all the BVR observations in one model. In the analyses, although some attempts could give a solution for the V or R-bands, we could not obtained any acceptable solution for B-band in one model derived in the PHOEBE V.0.31a software. The opposite cases were also seen in some attempts. The case indicates that the blue excess is not caused by any hot spot as some structures like faculae. These distortions in the light curves should be caused by any slow flare (Dal & Evren, 2010) rather than any structures like faculae. At the moment, there is no enough data to be sure that V1003 Her exhibits any flare like activity. However, a similar case was obtained in the case of the totally-eclipsing binary, GSC 4589-2999, by Sipahi et al. (2013). The same colour and light variations have been detected in the observations of GSC 4589-2999, though geometrical configurations of two systems are remarkable different from each other. Considering the results obtained from the PHOEBE analyses, it is most likely that the variation seen in the case of V1003 Her is caused by a flare like event occurring on the surface of the active component. According to Dal & Evren (2010), the slow flares can cause some effects on both light and colour variations. However, it needs to much more photometric observations to be sure.
Acknowledgments
The author acknowledges the generous observing time awarded to the Ege University Observatory. We also thank the referee for useful comments that have contributed to the improvement of the paper.
References
- Ammons et al. (2006) Ammons, S.M., Robinson, S.E., Strader, J., Laughlin, G., Fischer, D., Wolf, A., 2006, ApJ, 638, 1004
- Berdyugina (2005) Berdyugina, S.V., 2005, LRSP, 2, 8
- Breger et al. (1995) Breger, M., Handler, G., Nather, R.E., Winget, D.E., Kleinman, S.J., Sullivan, D.J., Li, Z.-P., Solheim, J.E., Jiang, S.-Y., Liu, Z.-L., Wood, M.A., Watson, T.K., Dziembowski, W.A., Serkowitsch, E., Mendelson, H., Clemens, J.C., Krzesinski, J., Pajdosz, G., 1995, A&A, 297, 473
- Breger et al. (1994) Breger, M., Martin, B., Garrido, R., Jiang, Shi-Yang, Li, Zhi-Ping, Hube, D.P., Stich, J., Ostermann, W., Paparo, M., 1994, A&A, 281, 90
- Cutri et al. (2003) Cutri, R. M., Skrutskie, M.F., van Dyk, S., Beichman, C.A., Carpenter, J.M., Chester, T., Cambresy, L., Evans, T., Fowler, J., Gizis, J., and 15 coauthors, 2003, The IRSA 2MASS All Sky Point Source Catalog, NASA/IPAC Infrared Scienc Archive http://irsa.ipac.caltech.edu/applications/Gator
- Dal & Evren (2010) Dal, H.A., Evren, S., 2010, AJ, 140, 483
- Deb et al. (2011) Deb, S., Singh, H.P., 2011, MNRAS, 412, 1787
- Duerbeck (1997) Duerbeck, H.W., 1997, IBVS, 4513, 1
- Essam et al. (2010) Essam, A., Saad, S.M., Nouh, M.I., Dumitrescu, A., El-Khateeb, M.M., Haroon, A., 2010, NewA, 15, 227
- Frasca et al. (2008) Frasca, A., Biazzo, K., Taş, G., Evren, S., Lanzafame, A.C., 2008, A&A, 479, 557
- Girardi et al. (2000) Girardi, L., Bressan, A., Bertelli, G., Chiosi, C., 2000, A&AS 141, 371
- Høg et al. (2000) Høg, E., Fabricius, C., Makarov, V.V., Urban, S., Corbin, T., Wycoff, G., Bastian, U., Schwekendiek, P., Wicenec, A., 2000, A&A, 355L, 27
- İbanoǧlu et al. (2005) İbanoǧlu, C., Evren, S., Taş, G., Çak rl , Ö., 2005, MNRAS, 360, 1077
- Kopal (1956) Kopal, Z., 1956. AnAp, 19, 298
- Lucy (1967) Lucy, L.B., 1967, Z. Astrophys, 65, 89
- Pojmánski (1997) Pojmánski, G., 1997, AcA, 47, 467
- Pojmánski (2002) Pojmánski, G., 2002, AcA, 52, 397
- Prša & Zwitter (2005) Prša, A., Zwitter, T., 2005, ApJ, 628, 426
- Rodr´guez et al. (2000) Rodr´guez, E., López-González, M.J., López de Coca, P., 2000, A&AS, 144, 469
- Rucinski (1969) Rucinski, S.M., 1969, AcA, 19, 245
- Rucinski et al. (2008) Rucinski, S.M., Pribulla, T., Mochnacki, S.W., Liokumovich, E., Lu, W., DeBond, H., De Ridder, A., Karmo, T., Rock, M., Thomson, J.R., and 3 coauthors, 2008, AJ, 136, 586
- Strassmeier (2009) Strassmeier, K.G., 2009, A&ARv, 17, 251
- Sipahi et al. (2013) Sipahi, E., Dal, H.A., Özdarcan, O., 2013, NewA, 21, 17
- van Hamme (1993) van Hamme, W., 1993, AJ, 106, 2096
- Wilson (1990) Wilson, R.E., 1990, ApJ, 356, 613
- Wilson & Devinney (1971) Wilson, R.E., Devinney, E.J., 1971, ApJ, 166, 605
- Wilson (1994) Wilson, P.R., 1994, ”Solar and stellar activity cycles”, First Edition, ed. R.F. Carswell, D.N.C. Lin and J.E. Pringle, United States of America by Cambridge University Press, New York, p.118
- Woźniak et al. (2004) Woźniak, P.R., Vestrand, W.T., Akerlof, C.W., Balsano, R., Bloch, J., Casperson, D., Fletcher, S., Gisler, G., Kehoe, R., Kinemuchi, K., Lee, B.C., Marshall, S., McGowan, K.E., McKay, T.A., Rykoff, E.S., Smith, D.A., Szymanski, J., Wren, J., 2004, AJ, 127, 2436


| Star | Alpha (J2000) | Delta (J2000) | V | |
|---|---|---|---|---|
| Name | (h m s) | (∘ ′ ′′) | (mag) | (mag) |
| V1003 Her | 18 53 17.543 | +21 13 32.74 | 9.79 | 0.41 |
| HD 343345 | 18 54 08.901 | +21 12 38.14 | 10.61 | 0.57 |
| HD 343344 | 18 54 12.639 | +21 16 12.48 | 10.09 | 0.63 |
| O | E | Type | Method | REF | |
|---|---|---|---|---|---|
| 48500.4300 (-) | -14718.47 | 0.0163 | II | - | Rucinski et al. (2008) |
| 53099.9063 (-) | -5394.99 | 0.0049 | I | - | Deb and Singh (2011) |
| 55747.3143 (2) | -28.50 | 0.0004 | II | BVR | This Study |
| 55761.3736 (1) | 0.00 | 0.0000 | I | BVR | This Study |
| 55764.3325 (1) | 6.00 | -0.0010 | I | BVR | This Study |
| 55772.4711 (1) | 22.50 | -0.0022 | II | BVR | This Study |
| Parameter | Value |
|---|---|
| 0.3740.008 | |
| () | 2.9250.143 |
| (∘) | 45.8192.712 |
| (K) | 6252 (Fixed) |
| (K) | 6192144 |
| 2.6420.041 | |
| 2.642 (Fixed) | |
| (B) | 0.7260.006 |
| (V) | 0.7230.004 |
| (R) | 0.7220.005 |
| , | 0.32, 0.32 (Fixed) |
| , | 0.50, 0.50 (Fixed) |
| , | 0.644, 0.644 (Fixed) |
| , | 0.816, 0.816 (Fixed) |
| , | 0.726, 0.726 (Fixed) |
| , | 0.633, 0.633 (Fixed) |
| 0.4870.001 | |
| 0.3090.001 | |
| (∘) = | 60 (Fixed) |
| (∘) = | 210 (Fixed) |
| (∘) = | 45 (Fixed) |
| = | 0.96 (Fixed) |
| (∘) = | 60 (Fixed) |
| (∘) = | 170 (Fixed) |
| (∘) = | 45 (Fixed) |
| = | 0.96 (Fixed) |