The Very Young Type Ia Supernova 2013dy: Discovery, and Strong Carbon Absorption in Early-Time Spectra
Abstract
The Type Ia supernova (SN Ia) 2013dy in NGC 7250 ( 13.7 Mpc) was discovered by the Lick Observatory Supernova Search. Combined with a prediscovery detection by the Italian Supernova Search Project, we are able to constrain the first-light time of SN 2013dy to be only d ( hr) before the first detection. This makes SN 2013dy the earliest known detection of an SN Ia. We infer an upper limit on the radius of the progenitor star of , consistent with that of a white dwarf. The light curve exhibits a broken power law with exponents of 0.88 and then 1.80. A spectrum taken 1.63 d after first light reveals a C II absorption line comparable in strength to Si II. This is the strongest C II feature ever detected in a normal SN Ia, suggesting that the progenitor star had significant unburned material. The C II line in SN 2013dy weakens rapidly and is undetected in a spectrum 7 days later, indicating that C II is detectable for only a very short time in some SNe Ia. SN 2013dy reached a -band maximum of mag 17.7 d after first light.
Subject headings:
supernovae: general — supernovae: individual (SN 2013dy)1. Introduction
Type Ia supernovae (SNe Ia) are used as calibratable candles with many important applications, including measurements of the expansion rate of the Universe (Riess et al. 1998; Perlmutter et al. 1999). However, the understanding of their progenitor systems and explosion mechanisms remains substantially incomplete. It is thought that SNe Ia are the product of the thermonuclear explosions of C/O white dwarfs (Hoyle & Fowler 1960; Colgate & McKee 1969; see Hillebrandt & Niemeyer 2000 for a review), but very early discovery and detailed follow-up observations are essential for learning about the nature of the progenitor evolution and the nature of the explosion process. Recent examples of well-studied SNe Ia include SN 2009ig (Foley et al. 2012), SN 2011fe (Nugent et al. 2011; Li et al. 2011), and SN 2012cg (Silverman et al. 2012a); like SN 2013dy, they were discovered shortly after exploding.
Early discovery and identification give us the opportunity to obtain spectra when the SNe are still very young, yielding more insight into the composition of the SN blastwave (especially the outer layers) and its progenitor star. For example, while O is often seen (can be from both unburned material and a product of C burning), spectroscopic C is much more rare. In particular, strong C features have been seen only in a few “super-Chandrasekhar mass” SNe Ia: SNLS-03D3bb (SN 2003fg; Howell et al. 2006), SN 2006gz (Hicken et al. 2007), SN 2007if (Scalzo et al. 2010), and SN 2009dc (Yamanaka et al. 2009; Silverman et al. 2011; Taubenberger et al. 2011). Though often detectable in normal SNe Ia, C lines are usually not strong (e.g., Patat et al. 1996; Garavini et al. 2005; Nugent et al. 2011; Silverman et al. 2012b).
Here we present our observations and analysis of SN 2013dy, detected merely 0.10 d after first light. An early spectrum (1.63 d) exhibits an unusually strong absorption feature Å redder than Si II 6355, very likely produced by C II.
2. Discovery and Observations
The field of NGC 7250 has been observed by the 0.76 m Katzman Automatic Imaging Telescope (KAIT) more than 600 times over the past 15 yr as part of the Lick Observatory Supernova Search (LOSS; Filippenko et al. 2001). In early 2011, the LOSS search strategy was modified to monitor fewer galaxies at a more rapid cadence with the objective of promptly identifying very young SNe (hours to days after explosion). The new software autonomously prompts KAIT to obtain a sequence of , , , and unfiltered (roughly ) images when a new transient is discovered, usually only minutes after the discovery images were taken. One of the first successful discoveries using this technique was SN 2012cg (Silverman et al. 2012a), followed by several others (e.g., SN 2013ab, Blanchard et al. 2013; SN 2013dh, Kumar et al. 2013). Although multi-band follow-up photometry was not autonomously triggered for SN 2013dy on the night of discovery, it was triggered two days later. The trigger was not activated the first night because the SN was quite faint and multiple other (spurious) candidates were found in the discovery image. However, the autonomous trigger activated by the second KAIT image demonstrates that the software triggering capability functions well.
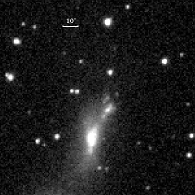
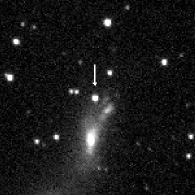
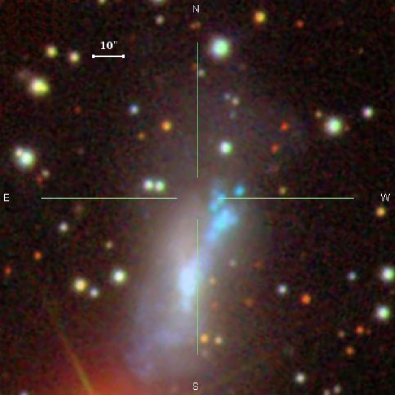
SN 2013dy was discovered (Casper et al. 2013) in an 18 s unfiltered KAIT image taken at 10:55:30 on 2013 July 10 (UT dates are used throughout) at mag. We measure its J2000.0 coordinates to be , , with an uncertainty of in each coordinate. Figure 1 shows KAIT and the Sloan Digital Sky Survey (SDSS) finding chart near the SN location. SN 2013dy is west and north of the nucleus of the host galaxy NGC 7250, at a distance of Mpc (calculated from the Tully-Fisher relation; Tully et al. 2009), which gives the SN a projected distance of 1.76 kpc from the nucleus. We note that there is a bright, blue region about west and south of the SN (projected distance kpc), which may be a star-forming region or merger (LEDA 214816; Paturel et al. 2000). It has been recently reported that the observed differences among SNe Ia may be tied to their birthplace environments (e.g., Kelly et al. 2010; Wang et al. 2013). However, it is unclear whether SN 2013dy has any connection with this star-forming region.
We obtained KAIT multi-band images almost every night for the following weeks, and they were reduced using our image-reduction pipeline (Ganeshalingam et al. 2010). Point-spread function photometry was then obtained using DAOPHOT (Stetson 1987) from the IDL Astronomy User’s Library111http://idlastro.gsfc.nasa.gov/.. The SN instrumental magnitudes are calibrated to local SDSS standards transformed into the Landolt system 222http://www.sdss.org/dr7/algorithms/ sdssUBVRITransform.html#Lupton2005.. We applied an image-subtraction procedure to remove host-galaxy light from only the unfiltered images, because multi-band images without the SN are not yet available. However, KAIT has a relatively small pixel scale ( pixel-1), and the host background is quite uniform and faint in the KAIT images, so we believe that the contribution from the host galaxy is minor in all bands, especially considering the brightness of the SN. Comparisons of the subtracted and not subtracted unfiltered images yield nearly identical results (differences of mag or less).
Interestingly, an unfiltered prediscovery detection of SN 2013dy was obtained at 02:04:11 July 10 (Casper et al. 2013) with the 0.5 m reflector at Monte Agliale Observatory as part of the Italian Supernova Search Project (ISSP). Additional confirmation images were taken on July 11 and 26. We have reprocessed the original images as part of this study. Owing to the relatively large pixel scale ( pixel-1), the SN is blended with host-galaxy light. Using a template image taken on 2011 August 4, we performed the same subtraction method as for the KAIT unfiltered images. We then obtained photometry with an aperture of radius 1.5 pixels, a reasonable size given the seeing and large pixel scale.
Additional multi-band photometry in Johnson-Cousins BVRI was obtained with the Las Cumbres Observatory Global Telescope (LCOGT) network of robotic 1.0 m telescopes (Brown et al. 2013). The LCOGT instrumental magnitudes are calibrated to local SDSS standards, transformed to BVRI333http://www.sdss.org/dr7/algorithms/ sdssUBVRITransform.html#Jester2005..
Optical spectra of SN 2013dy were obtained on 8 different nights with DEIMOS (Faber et al. 2003) on the Keck II telescope (1.63 d), the 1.82 m Plaskett Telescope of the National Research Council of Canada (3.30 d), YFOSC on the 2.4 m telescope at LiJiang Gaomeigu Station of YNAO (4.76 d), the Kast double spectrograph (Miller & Stone 1993) on the Shane 3 m telescope at Lick Observatory (5.43 d), the FLOYDS robotic spectrograph (Sand et al., in prep.) on the LCOGT 2.0 m Faulkes Telescope North on Haleakala, Hawaii (7.50, 8.57, 10.57 d), and the Marcario Low-Resolution Spectrograph (LRS; Hill et al. 1998) on the 9.2 m Hobby-Eberly Telescope (HET) at McDonald Observatory (11.27 d). Data were reduced following standard techniques for CCD processing and spectrum extraction using IRAF. The spectra were flux calibrated through observations of appropriate spectrophotometric standard stars.
3. Analysis and Results
3.1. Light Curves
Figure 2 shows our BVRI and unfiltered light curves of SN 2013dy. Applying a low-order polynomial fit, we find that SN 2013dy reached a -band peak magnitude of on 2013 July , 17.7 d after first light. Assuming mag (Schlegel et al. 1998), mag (see below), and Mpc (Tully et al. 2009), this implies (statistical only) mag, which is 0.5 mag dimmer than the typical SN Ia, but still within the range of a “normal” SN Ia. The unfiltered band reached a peak of mag, which means our first detection of the SN from the ISSP image (18.71 mag, with a limiting magnitude of ) was taken when the SN was at only % of its peak brightness.
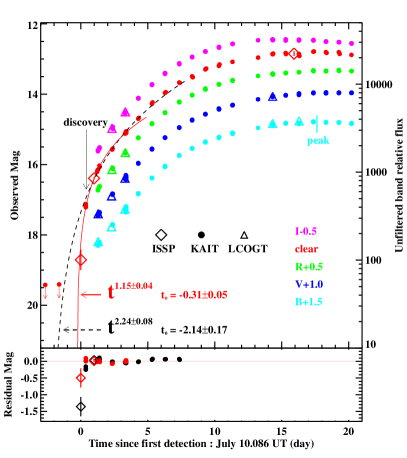
In order to determine the time of first light444Throughout this paper, we refer to the time of first light instead of explosion time, since the SN may exhibit a “dark phase” which can last for a few hours to days, between the moment of explosion and the first observed light (e.g., Rabinak, Livne, & Waxman 2012; Piro & Nakar 2012, 2013)., one can assume that the SN luminosity scales as the surface area of the expanding fireball, and therefore increases quadratically with time (, commonly known as the model; Arnett 1982; Riess et al. 1999; Nugent et al. 2011). We restrict our model fit to the unfiltered data, which have the best phase coverage. Although ISSP images are also unfiltered, there might be possible differences between the KAIT and ISSP effective bandpasses. Fortunately, the second and third ISSP observations are between KAIT observations, and the ISSP magnitudes are consistent with the KAIT light curve, suggesting that the ISSP unfiltered band is very close to that of KAIT. Moreover, we measured isolated reference stars in the ISSP images and compared their magnitudes with the same stars in the KAIT images, finding consistent results between the two telescopes with differences mag. Thus, it is reasonable to combine the ISSP and KAIT unfiltered results.
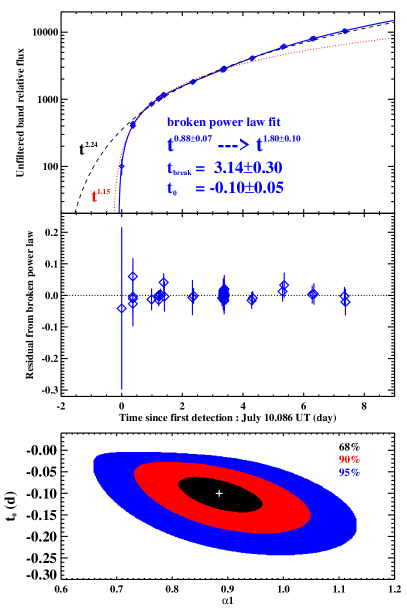
Regardless, we first apply the fit only to KAIT fluxes in the first few days (before July 18). We find that a model cannot fit the data very well. We therefore free the exponent of the power law and obtain a best-fit value of , with a corresponding first-light time of d (relative to the first detection time, July 10.086). The exponent is about 3 away from the model (marginally consistent). However, as can be seen from the residual plot in Figure 2, the first night of KAIT data is below the fit, indicating an even faster light curve. This becomes more drastic if we include the first ISSP detection, which is far below the extrapolation of the fit. Thus, we refit the fluxes including both ISSP and KAIT data, but restricted to data taken before July 14. We find the best-fit power law exponent for these early data to be , with a corresponding first-light time of d. Note that the nondetection from KAIT on July 8.47 (limiting magnitude ) is consistent with both the fit and the fit.
The apparent change of the power law indices indicates a varying power law of the early rising light curve. Hence, we adopt a broken power law function, also widely used for fitting GRB afterglows (e.g., Zheng et al. 2012):
| (1) |
where is the flux, is the first-light time, is the break time, and are the two power law indices before and after the break, and is a smoothing parameter. The final fit result gives d, namely July 9.99, and d, , , and , as shown in Figure 3.
With an estimated first-light time of d (2.4 hr), this is the earliest detection of any SNe Ia, even earlier than for SN 2011fe (detected only 11.0 hr after first light; Nugent et al. 2011) and SN 2009ig (detected 17 hr after first light; Foley et al. 2012). It also makes SN 2013dy a rare case with more than one detection within the initial day after first light: there are 3 epochs of detection within 1 d and 5 epochs within 1.5 d.
Our best-fit broken power law model of the early light curve yields the following conclusions. (1) The model is not sufficient for every SN Ia; some SNe may have different power law exponents describing their rise (see also Piro & Nakar 2012). (2) The rising exponent may vary with time. Perhaps the usual model works well for previous SNe Ia because those examples did not have more than one observation to constrain the power law exponent within the first day. The varying exponent indicates that the very early fireball may exhibit significant changes in either the photospheric temperature, the velocity, or the fireball input energy during expansion. These changes may happen on a time scale of 2–4 d after first light. The very early light curve before the break time may be the contribution from the shock-heated cooling emission after shock breakout, which has a predicted rising index of 1.5 (; see Eq. 3 in Piro & Nakar 2013). However, our observed power law index is 0.88, smaller than predicted. The rising index also depends on underlying physical parameters; detailed analysis will be presented elsewhere.
Alternatively, the early-time observations constrain the emission from the ejecta, which can be used to limit the radius of the progenitor star as well as interaction with the circumstellar medium or a companion star (Kasen 2010). For SN 2013dy, the early ISSP unfiltered observation of mag (corrected for extinction) at 0.10 d limits any emission from this process to be erg s-1 at optical wavelengths. Comparing these parameters with those of SN 2011fe, which has a constraint on its progenitor star (see Fig. 4 of Nugent et al. 2011), our constraint for SN 2013dy is slightly weaker (factor of ), and so we infer the radius of the progenitor star to be . Even if we conservatively assume the first-light time to be earlier, the same time as the KAIT upper limit (July 8.47), we can still find that , consistent with a white dwarf progenitor.
3.2. Spectra
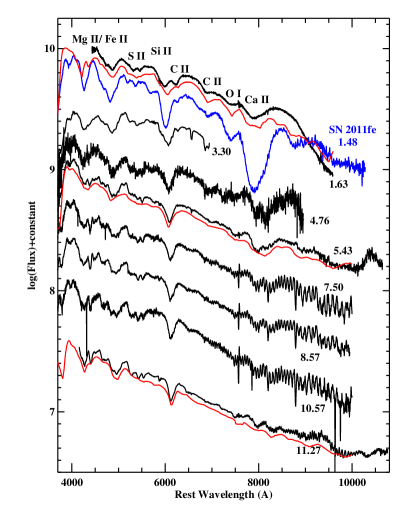
Figure 4 shows our spectra of SN 2013dy from the first 2 weeks. Most exhibit narrow Na I D absorption from both the host galaxy and the Milky Way. The median redshift determined from these features is , consistent with the redshift given in SIMBAD (0.00389).
The equivalent width (EW) of Na I D absorption is often converted into reddening, but with large scatter over the empirical relationship (Poznanski et al. 2011). The median EW of Na I D from the host galaxy is measured to be 0.53 Å, which yields a range of possible reddening values around mag (Poznanski et al. 2011). For Milky Way extinction, the measured median EW of Na I D is 0.50 Å, corresponding to mag, consistent with the value of mag given by Schlegel et al. (1998); here we adopt the latter.
3.2.1 Species and Individual Lines
To help identify the species present in our spectra of SN 2013dy, we used the spectrum-synthesis code SYNAPPS (Thomas et al. 2011). A few examples of our fits are shown in Figure 4. Our first spectrum of SN 2013dy (1.63 d after first light) consists of absorption features from ions usually seen in SNe Ia (Ca II, Si II, Fe II, S II, and O I, as well as strong C II). All of these species have expansion velocities 15,000 km s-1, similar to what was found in the earliest spectra of SN 2011fe (Parrent et al. 2012). Figure 5 shows our measurements of individual line velocities (see Silverman et al. 2012c for details).
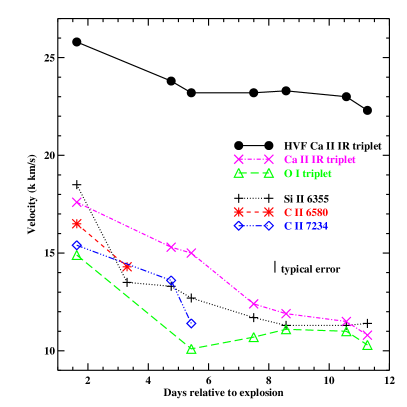
In addition to the usual photospheric absorption component of the Ca II near-infrared triplet, SN 2013dy exhibits a high-velocity feature (HVF) in our early spectra having a velocity of 26,000 km s-1. Similar absorption is also seen in a few other well-observed SNe, including SN 2005cf (Wang et al. 2009) and SN 2012fr (e.g., Maund et al. 2013; Childress et al. 2013). This HVF appears to be detached from the rest of the photosphere, slowing down to 23,000 km s-1after three days (measured from the first spectrum) and maintaining that velocity through at least 11 d. As for Si II 6355, the velocity continuously slow down from 18,500 km s-1at 1.63 d to 11,400km s-1 at 11.27 d.
Interestingly, our first spectrum exhibits a strong line Å redward of the usual prominent Si II 6355. It is very likely to be the C II 6580 line; a weaker C II 7234 feature is also visible. Such strong C II lines are not usually seen in normal SNe Ia (Silverman et al. 2012b), but similar features have been observed in a few super-Chandrasekhar mass examples. Though C II is distinguishably detected in over 1/4 of all normal SNe Ia (e.g., Parrent et al. 2011; Silverman et al. 2012b), it is usually not very strong. However, spectra of other SNe Ia have generally not been obtained as early as our spectra of SN 2013dy. In fact, the C II 6580 line weakens rapidly in SN 2013dy; it became much weaker by 3.30 d, and it is undetectable after an age of week. Thus, the early discovery of SNe Ia and timely spectroscopic observations are crucial for detecting the C II features and studying their evolution.
The velocity of C II 7234 is slightly lower than that of C II 6580 in the 1.63 d spectrum, and both are also a bit below that of the photospheric component of Si II 6355, as seen in previous work (e.g., Silverman et al. 2012b). But after d, their velocities are similar to each other. The presence of C II with velocity comparable to that of Si II gives direct evidence that there exists some amount of unburned material. Moreover, the presence of both O I (often seen in normal SNe Ia) and C II suggests that the progenitor is probably a C+O white dwarf, consistent with the analysis of our early-time light curve.
3.2.2 Classification
Using the SuperNova IDentification code (SNID; Blondin & Tonry 2007), we find that SN 2013dy is spectroscopically similar to several normal SNe Ia, though some of our early spectra (7.50, 8.57, 10.57 d) also resemble those of the peculiar SN 1999aa and similar events (e.g., Li et al. 2001). Since the peak -band brightness lies in the range of typical SN Ia luminosities, SN 2013dy is probably a normal SN Ia.
4. Conclusions
In this Letter we present optical photometry and spectroscopy of the Type Ia SN 2013dy, the earliest detection of an SN Ia thus far. The rising light curve shows a variable power-law exponent and its early-time spectrum exhibits a strong C II feature, both of which are not seen in previous studies of normal SNe Ia. Such well-studied objects will help us understand the underlying nature of SNe Ia.
References
- (1) Arnett, W. D. 1982, ApJ, 253, 785
- (2) Blanchard, P., Zheng, W., Cenko, S. B., Li, W., et al. 2013, CBET, 3422
- Blondin & Tonry (2007) Blondin, S., & Tonry, J. L. 2007, ApJ, 666, 1024
- (4) Brown, T. M., et al. 2013, arXiv:1305.2437
- (5) Casper, C., Zheng, W., Li, W., Filippenko, A. V., & Cenko, S. B., 2013, CBET, 3588
- (6) Childress, M., et al. 2013, ApJ, 770, 29
- (7) Colgate, S. A., & McKee, C. 1969, ApJ, 157, 623
- Faber et al. (2003) Faber, S. M., et al. 2003, SPIE, 4841, 1657
- Filippenko et al. (2001) Filippenko, A. V., Li, W. D., Treffers, R. R., & Modjaz, M. 2001, in Small-Telescope Astronomy on Global Scales., ed. B. Paczyński, W. P. Chen, & C. Lemme (San Francisco: ASP), 121
- Foley et al. (2012) Foley, R. J., et al. 2012, ApJ, 744, 38
- Ganeshalingam et al. (2010) Ganeshalingam, M., et al. 2010, ApJS, 190, 418
- (12) Garavini, G., et al. 2005, AJ, 130, 2278
- (13) Hicken, M., et al. 2007, ApJ, 669, L17
- Hill et al. (1998) Hill, G. J., et al. 1998, SPIE, 3355, 375
- (15) Hillebrandt, W., & Niemeyer, J. C. 2000, ARA&A, 38, 191
- (16) Howell, D. A., et al. 2006, Nature, 443, 308
- (17) Hoyle, F., & Fowler, W. A. 1960, ApJ, 132, 565
- Kasen (2010) Kasen, D. 2010, ApJ, 708, 1025
- (19) Kelly, P. L., et al. 2010, ApJ, 715, 743
- (20) Kumar, S., Fuller, K., Zheng, W., et al. 2013, CBET, 3561
- Li et al. (2001) Li, W., Filippenko, A. V., Treffers, R. R., Riess, A. G., Hu, J., & Qiu, Y. 2001, ApJ, 546, 734
- (22) Li, W., et al. 2011, Nature, 480, 348
- (23) Maund, J. R., et al. 2013, MNRAS, 433, L20
- Miller & Stone (1993) Miller, J. S., & Stone, R. P. S. 1993, Lick Obs. Tech. Rep. 66 (Santa Cruz: Lick Obs.)
- Nugent et al. (2011) Nugent, P. E., et al. 2011, Nature, 480, 344
- (26) Parrent, J. T., et al. 2011, ApJ, 732, 30
- Parrent et al. (2012) Parrent, J. T., et al. 2012, ApJ, 752, 26
- (28) Patat, F., Benetti, S., Cappellaro, E., et al. 1996, MNRAS, 278, 111
- (29) Paturel, G., et al. 2000, A&AS, 144, 475
- Perlmutter et al. (1999) Perlmutter, S., et al. 1999, ApJ, 517, 565
- (31) Piro, A., & Nakar, E. 2012, arXiv:1211.6438
- (32) Piro, A., & Nakar, E. 2013, ApJ, 769, 67
- Poznanski et al. (2011) Poznanski, D., Ganeshalingam, M., Silverman, J. M., & Filippenko, A. V. 2011, MNRAS, 415, L81
- (34) Rabinak, I., Livne, E. & Waxman, E. 2012, ApJ, 757
- Riess et al. (1998) Riess, A. G., et al. 1998, AJ, 116, 1009
- Riess et al. (1999) Riess, A. G., Filippenko, A. V., Li, W., & Schmidt, B. P. 1999, AJ, 118, 2668
- (37) Scalzo, R. A., et al. 2010, ApJ, 713, 1073
- Schlegel et al. (1998) Schlegel, D. J., Finkbeiner, D. P., & Davis, M. 1998, ApJ, 500, 525
- (39) Silverman, J. M., et al. 2011, MNRAS, 410, 585
- Silverman et al. (2012a) Silverman, J. M., et al. 2012a, ApJ, 756, L7
- Silverman et al. (2012b) Silverman, J. M., et al. 2012b, MNRAS, 425, 1917
- Silverman et al. (2012c) Silverman, J. M., et al. 2012c, MNRAS, 425, 1819
- (43) Stetson, P. B. 1987, PASP, 99, 191
- (44) Taubenberger, S., et al. 2011, MNRAS, 412, 2735
- Thomas et al. (2011) Thomas, R. C., Nugent, P. E., & Meza, J. C. 2011, PASP, 123, 237
- (46) Tully, R., et al., 2009, AJ, 138, 323
- (47) Wang, X., et al. 2009, ApJ, 697, 380
- (48) Wang, X., et al. 2013, Science, 340, 170
- (49) Yamanaka, M., et al. 2009, ApJ, 707, L118
- (50) Zheng, W., et al. 2012, ApJ, 751, 90