The Innermost Regions of Relativistic Jets and Their Magnetic Fields
Observations of low- and intermediate-frequency-peaked BL Lacs above 100 GeV with VERITAS
Abstract
Most of the blazars detected to date at TeV energies ( TeV) are high-frequency-peaked BL Lacs (HBLs). Only a handful episodic TeV detections of low- and intermediate-frequency-peaked BL Lacs (LBL/IBLs, with synchrotron peak frequencies in the infrared and optical regime) have been reported, typically during high-flux states. The VERITAS array, a ground-based TeV observatory located in southern Arizona has observed five known TeV LBL/IBLs since 2009: 3C 66A, W Comae, PKS 1424+240, S5 0716+714 and BL Lacertae, with at least 5-10 hours/year, which so far resulted in the detection of a bright, sub-hour timescale gamma-ray flare of BL Lacertae in June 2011. We also report the detection and characterization of two new IBLs: VER J0521+211 and B2 1215+30.
1 Introduction
The population of TeV blazars222Detected at TeV, which is the typical energy range of current imaging atmpospheric Cherenkov telescopes. is dominated by high-frequency-peaked BL Lacs (HBLs), comprising 75% of the total TeV blazar count (41 out of 55, tevcat, ). HBLs show a maximum of their synchrotron emission in the X-ray regime, and display a low Compton dominance , defined as the ratio between the luminosity of the high-energy component of the spectral energy distribution and that of the synchrotron emission. At parsec scales, radio imaging of TeV HBLs shows relatively weak jets with only stationary or sub-luminal components piner .
| RA | Dec | ref. | ||
|---|---|---|---|---|
| 3C 66A | 02 22 41 | +43 02 35 | 0.41? | 66a ; magic-66a |
| VER J0521+211 | 05 21 55 | +21 11 24 | 0.108 | 0521 |
| S5 0716+714 | 07 21 53 | +71 20 36 | 0.31? | magic-s5 |
| B2 1215+30 | 12 17 52 | +30 07 01 | 0.13? | magic-1215 ; 1215 |
| W Comae | 12 21 31 | +28 13 59 | 0.102 | wcom ; wcom-flare |
| PKS 1424+240 | 14 27 00 | +23 47 40 | 1424 | |
| AP Librae | 15 17 41 | -24 22 19 | 0.049 | hess-aplib |
| MAGIC J2001+435 | 20 01 13 | +43 53 02 | ? | magic-2001 |
| BL Lacertae | 22 02 43 | +42 16 40 | 0.069 | magic-bllac ; bllac-flare |
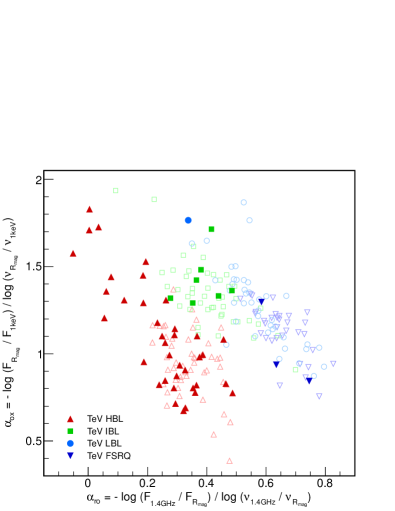
In recent years, the improved sensitivity of the current generation of ground-based Cherenkov telescopes (VERITAS, MAGIC, and H.E.S.S.) revealed TeV emission from a handful of low- and intermediate-frequency-peaked BL Lacs (LBLs/IBLs), listed in Table. 1 magic-bllac ; wcom ; 66a ; magic-s5 ; hess-aplib ; 1424 ; magic-2001 ; magic-1215 ; 0521 . LBLs and IBLs show different spectral properties than HBLs, with synchrotron emission peaking in the infrared/optical regime and falling towards the X-ray band (Fig. 1). In general, LBLs and IBLs are more powerful, more luminous, and have a richer jet environment compared to HBLs. The accretion rate is thought to be the main driver of these differences meyer ; giommi . In this scheme, LBLs accrete close to the Eddington rate, producing powerful and luminous jets, and an optically thick accretion disk whose radiation ionizes the broad line region (BLR) and is reflected by the dust torus, generating sources of external low-energy photons for Compton scattering. On the other hand, HBLs accrete at highly sub-Eddington rates, in a radiatively inefficient regime, producing weaker jets that propagate in a “cleaner” environment. IBLs may represent an intermediate case in terms of their accretion properties, although jet alignment has also been suggested as an explanation for their lower peak frequencies meyer . In the lowest frequency band, a recent compilation of 15 GHz radio images lister found superluminal components in 3C 66A, S5 0716+714, W Comae, AP Librae, and BL Lacertae. For comparison, only one TeV HBL showed superluminal motion in the same study.
These proceedings report on observations of LBLs and IBLs with VERITAS in the gamma ray band ( TeV), focusing on the recent detections of two new intermediate BL Lacs (VER J0521+211 and B2 1215+30) and a bright TeV flare from BL Lacertae. More details on these results have been provided in references 0521 ; 1215 ; bllac-flare . The gamma-ray flux of the Crab Nebula is often referred as a reference unit throughout the text, being above 0.2 TeV hillas .
2 Discovery of TeV emission from VER J0521+211
VER J0521+211 was suggested as a TeV candidate during a search for clusters of GeV photons in the Fermi-LAT data. Observations with VERITAS in October 2009 resulted in a significant detection at energies above 0.2 TeV in less than four hours of observation 0521 , implying a relatively bright TeV flux at a level of Crab. Follow-up observations revealed a bright flare reaching Crab with a flux doubling time of day. Incidentally, VER J0521+211 lies only away from the Crab Nebula, the first-detected TeV emitter and the brightest and best-studied gamma-ray source in the sky. The Whipple 10m telescope, and later the VERITAS array, had been observing the Crab Nebula and the region around it for more than two decades, just missing VER J0521+211 outside the edge of their field of view.
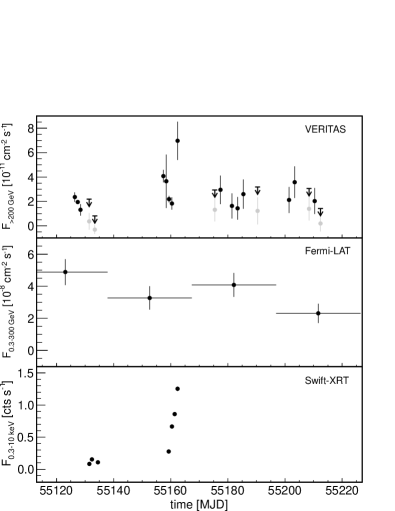
The TeV emission detected with VERITAS was spatially associated with RGB J0521.8+2112, an unidentified radio and X-ray source. A complete multiwavelength campaign triggered after the VERITAS detection unambiguously classified VER J0521+211 as a BL Lac-type blazar. The evidence included a one-sided jet resolved in 15 GHz VLBA images, polarized optical emission; point-like, variable X-ray and gamma-ray emission (Fig. 2), and a featureless optical spectrum. Later observations revealed optical absorption lines, indicating a redshift of shaw . Radio imaging also shows electric polarization vectors perpendicular to the jet ridgeline, indicative of optically thin synchrotron emission associated with a well-ordered magnetic field aligned in the direction of the jet axis.
The broadband synchrotron emission spectrum from VER J0521+211 shows a peak in the optical band, suggesting a classification as an IBL. However, during the X-ray and TeV flare in MJD 55162 (Fig. 2) its synchrotron properties resembled those of TeV HBLs, mainly due to a hardening of the X-ray spectrum during the high-flux state. Even if it did not figure in TeV-candidate catalogs before the launch of Fermi due to its low Galactic latitude, VER J0521+211 ranks among the brightest blazars known at TeV energies. At a distance of , the gamma-ray luminosity of VER J0521+211 exceeds , significantly brighter than classical northern blazars such as Mrk 421, Mrk 501 and 1ES 1959+650. Future multiwavelength observations of VER J0521+211 will help to extend the detailed spectral modeling available for nearby HBLs to a more luminous non-HBL blazar.
3 TeV detection and characterization of B2 1215+30
B2 1215+30 is one of the five sources that were used to define the class of BL Lac-type objects, together with OJ 287, W Comae, AP Librae, and BL Lacertae strittmatter . Its distance is uncertain, although spectroscopic redshifts of and can be found in the literature.
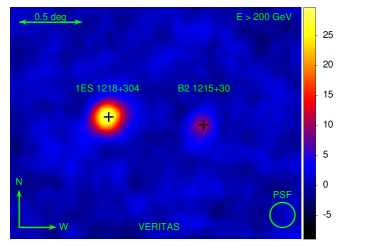
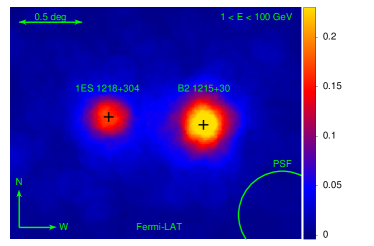
TeV emission from B2 1215+30 was reported by MAGIC after observations triggered during an optical high state magic-1215 . The source is only away from 1ES 1218+304, a well-studied TeV HBL that has been extensively monitored with VERITAS since 2009. VERITAS collected a gamma-ray signal from B2 1215+30 at level after 82 hr of exposure-corrected observations (most of them targeting 1ES 1218+304) spanning over three yearly observing seasons. 1ES 1218+304 is a bright HBL ( Crab) showing a power-law spectrum in the TeV band with 1218 , while the measured spectral index for B2 1215+30 is significantly softer (). The spectral differences can be visualized in Figure 3, showing how Fermi-LAT and ground-based gamma-ray telescopes have different sensitivities to distinct source classes. B2 1215+30, with Crab, is significantly weaker than 1ES 1218+304 in the TeV band, but the picture reverses at lower energies, where Fermi-LAT measures a much brighter photon flux from B2 1215+30.
The gamma-ray signal from B2 1215+30 recorded by VERITAS shows clear flux variability on time scales of several months, with a prolonged high state in 2011, in agreement with magic-1215 . Significant variability on shorter time scales could not be resolved. Observations in the optical band (Super-LOTIS, MDM, Swift-UVOT), X-ray (Swift-XRT), and gamma rays (Fermi-LAT) quasi-simultaneous with the 2011 VERITAS detection were used to construct a complete spectral energy distribution, displaying a synchrotron peak in the ultraviolet regime and therefore confirming B2 1215+30 as an IBL. The multiwavelength data were successfully described with a synchrotron self-Compton model with parameters similar to those of other TeV-detected blazars.
4 TeV flare of BL Lacertae
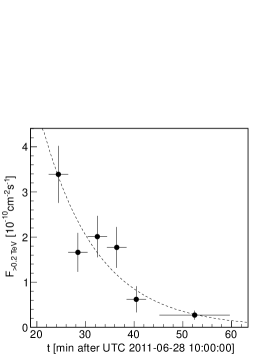
The eponymous blazar BL Lacertae was detected by VERITAS during a short-lived TeV flare on 2011 June 28 bllac-flare . The gamma-ray flux over the 35 min of observations was Crab, ten times brighter than in the original TeV discovery magic-bllac . Figure 4 shows the measured light curve resolved down to 4-min time bins, where intra-night variability is first observed for this object in the gamma-ray band. The measured flux has a decay time min, and the peak flux reaches Crab.
Causality implies that the observed variability timescale is related to the size of the gamma-ray emission region by pc, where is the Doppler factor of the emitting plasma. Correlation of the gamma-ray flaring event with the emergence of a superluminal knot in radio images (also reported in the discovery TeV emission from BL Lacertae in 2005-6 marscher ) has been interpreted as indication of the gamma-ray dissipation region to be at parsec scales from the central black hole. Under that scenario, the compact size of the emitting region of pc would represent only a small fraction of the jet cross section at parsec scales, which would be pc assuming a conical collimated jet. That would suggest that a small emitting region downstream of the jet can be responsible for most of its radiative output.
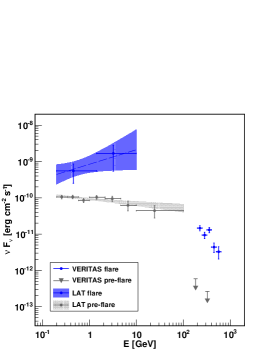
The broadband gamma-ray spectrum during the flare shows a sharp break between measured by Fermi-LAT and seen by VERITAS (Fig. 4). A spectral break at GeV would be expected due to Klein-Nishina suppression of the electron-photon cross section if the dominant component of the gamma-ray emission is inverse-Compton scattering of external photons from the BLR hpblazars , as indicated in previous multiwavelength studies of the source both in quiescent and flaring states madejski ; fermi-bllac . Additional steepening of the gamma-ray spectrum could be due to pair production by gamma-rays on a dense photon field with frequencies similar to those of BLR photons poutanen .
A coherent picture is therefore difficult to put forth, as BLR photons are not expected to be dominant at parsec scales but closer to the central black hole. Further observations of BL Lacertae, and of TeV LBLs and IBLs in general are needed to elucidate the location of the gamma-ray emitting region and the role of external photons in the gamma-ray production and absorption, as well as how the energy dissipation processes change between quiescent states and bright flaring events.
VERITAS is supported by grants from the U.S. Department of Energy Office of Science, the U.S. National Science Foundation and the Smithsonian Institution, by NSERC in Canada, by Science Foundation Ireland (SFI 10/RFP/AST2748) and by STFC in the U.K. We acknowledge the excellent work of the technical support staff at the Fred Lawrence Whipple Observatory and at the collaborating institutions in the construction and operation of the instrument.
References
- (1) Wakely, S. P., & Horan, D. 2008, in Proc. ICRC, 3, 1341, http://tevcat.uchicago.edu
- (2) Piner, B. G., Pant, N., & Edwards, P. G. 2010, ApJ, 723, 1150
- (3) Albert, J., Aliu, E., Anderhub, H., et al. 2007, ApJL, 666, L17
- (4) Acciari, V. A., Aliu, E., Beilicke, M., et al. 2008, ApJL, 684, L73
- (5) Acciari, V. A., Aliu, E., Arlen, T., et al. 2009, ApJL, 693, L104
- (6) Anderhub, H., Antonelli, L. A., Antoranz, P., et al. 2009, ApJL, 704, L129
- (7) Fortin, P., Fegan, S., Horan, D., et al. 2010, in Proc. 25th Texas Symp. Rel. Astrophys., PoS, 123, 199
- (8) Acciari, V. A., Aliu, E., Arlen, T., et al. 2010, ApJL, 708, L100
- (9) Berger, K., Giavitto, G., Lindfors, E., et al. 2011, in Proc. 2011 Fermi Symp. - eConf C110509, arXiv:1110.6368
- (10) Aleksić, J., Alvarez, E. A., Antonelli, L. A., et al. 2012, A&A, 544, A142
- (11) Archambault, S., Arlen, T., Aune, T., et al. 2013, ApJ, 776, 69
- (12) Aleksić, J., Antonelli, L. A., Antoranz, P., et al. 2011, ApJ, 726, 58
- (13) Aliu, E., Archambault, S., Arlen, T., et al. 2013, ApJ submitted
- (14) Acciari, V. A., Aliu, E., Aune, T., et al. 2009, ApJ, 707, 612
- (15) Arlen, T., Aune, T., Beilicke, M., et al. 2013, ApJ, 762, 92
- (16) Meyer, E. T., Fossati, G., Georganopoulos, M., & Lister, M. L. 2011, ApJ, 740, 98
- (17) Giommi, P., Padovani, P., Polenta, G., et al. 2012, MNRAS, 420, 2899
- (18) Lister, M. L., Aller, M. F., Aller, H. D., et al. 2013, AJ in press, arXiv:1308.2713
- (19) Hillas, A. M. 1985, in Proc. 19th Int. Cosmic Ray Conf. (La Jolla), NASA Conf. Publ. 3, 445
- (20) Shaw, M. S., Romani, R. W., Cotter, G., et al. 2013, ApJ, 764, 135
- (21) Strittmatter, P. A., Serkowski, K., Carswell, R., et al. 1972, ApJL, 175, L7
- (22) Acciari, V. A., Aliu, E., Arlen, T., et al. 2009, ApJ, 695, 1370
- (23) Marscher, A. P., Jorstad, S. G., D’Arcangelo, F. D., et al. 2008, Nature, 452, 966
- (24) Ghisellini, G., & Tavecchio, F. 2009, MNRAS, 397, 985
- (25) Madejski, G. M., Sikora, M., Jaffe, T., et al. 1999, ApJ, 521, 145
- (26) Abdo, A. A., Ackermann, M., Ajello, M., et al. 2011, ApJ, 730, 101
- (27) Poutanen, J., & Stern, B. 2010, ApJL, 717, L118