VLA and CARMA Observations of Protostars in the Cepheus Clouds: Sub-arcsecond Proto-Binaries Formed via Disk Fragmentation
Abstract
We present observations of three Class 0/I protostars (L1157-mm, CB230 IRS1, and L1165-SMM1) using the Karl G. Jansky Very Large Array (VLA) and observations of two (L1165-SMM1 and CB230 IRS1) with the Combined Array for Research in Millimeter-wave Astronomy (CARMA). The VLA observations were taken at wavelengths of mm, 1.4 cm, 3.3 cm, 4.0 cm, and 6.5 cm with a best resolution of 006 (18 AU) at 7.3 mm. The L1165-SMM1 CARMA observations were taken at mm with a best resolution of (100 AU), and the CB230 IRS1 observations were taken at mm with a best resolution of 3″ (900 AU). We find that L1165-SMM1 and CB230 IRS1 have probable binary companions at separations of 03 (100 AU) from detections of secondary peaks at multiple wavelengths. The position angles of these companions are nearly orthogonal to the direction of the observed bipolar outflows, consistent with the expected protostellar disk orientations. We suggest that these companions may have formed from disk fragmentation; turbulent fragmentation would not preferentially arrange the binary companions to be orthogonal to the outflow direction. For L1165-SMM1, both the 7.3 mm and 1.3 mm emission show evidence of a large (R 100 AU) disk. For the L1165-SMM1 primary protostar and the CB230 IRS1 secondary protostar, the 7.3 mm emission is resolved into structures consistent with AU radius disks. For the other protostars, including L1157-mm, the emission is unresolved, suggesting disks with radii AU.
1 Introduction
Binary or multiple systems comprise at least half of all solar-type stars and the physical separation of companions ranges from 10000 AU to 0.01 AU. The formation mechanism for multiple systems is still debated (e.g. Tohline, 2002), but seems to occur during the protostellar phase when there is still a significant mass reservoir available. Thus, in order to test binary formation mechanisms, observations of very young sources that have not undergone significant evolution are the most ideal. The earliest recognized phase of protostellar evolution is the Class 0 phase (Andre et al., 1993); Class 0 sources are characterized by a large, dense envelope surrounding the protostar(s). The Class I phase follows the Class 0 phase, where the protostar is still embedded in its envelope, but the envelope has become less massive due to a combination of infall and/or outflow dissipation (e.g. Arce & Sargent, 2006).
Rotationally-supported disks111Note that the term “disk” used in the text implicitly refers to a rotationally-supported or Keplerian disk, whether or not it has been kinematically verified. were once thought to form as a simple consequence of angular momentum conservation during the collapse of the protostellar envelope (e.g. Ulrich, 1976; Cassen & Moosman, 1981; Terebey et al., 1984). The angular momentum causes the infalling material to subsequently fall onto the disk and the disk can grow as higher angular momentum material falls in and becomes rotationally supported at progressively larger radii (Yorke & Bodenheimer, 1999). The accretion to the protostar is then mediated by the circumstellar disk. Angular momentum is also thought to contribute to the formation of multiple systems by causing infalling material to form a rotationally flattened region in the inner envelope, significantly larger than a disk, where density perturbations would cause multiple collapse centers (Burkert & Bodenheimer, 1993; Boss, 1995; Tohline, 2002).
This simple picture of disk and binary formation breaks down in collapse models that consider magnetic braking (Mouschovias, 1979; Basu & Mouschovias, 1994). Ideal magneto-hydrodynamic (MHD) simulations and analytic models showed that even when gravity is dominant over the magnetic field in the starless phase, the magnetic braking can slow the rotation during collapse phase and prevent the formation of rotationally supported disks (Allen et al., 2003; Galli et al., 2006; Mellon & Li, 2008, 2009). The slowed rotation on 1000 AU scales would also prevent binary formation from rotation-induced envelope fragmentation (i.e. Burkert & Bodenheimer, 1993; Boss, 1995). Moreover, given that disk formation is suppressed, the fragmentation of these disks to form close binaries is also more difficult (Hennebelle & Teyssier, 2008) than in the non-magnetic case (e.g. Vorobyov, 2010; Stamatellos & Whitworth, 2009). Later models considering dissipative, non-ideal MHD effects, do enable the formation of initially very small disks (Dapp & Basu, 2010) and misalignment of magnetic fields with respect to the rotation axis of a system may also enable disk formation in the absence of strong dissipative effects (Joos et al., 2012; Li et al., 2013).
Observationally, there had been little direct evidence for resolved disks toward Class 0 sources (Chiang et al., 2008; Maury et al., 2010; Chiang et al., 2012) until a rotationally-supported disk, 125 AU in radius was discovered around the Class 0 protostar L1527 (Tobin et al., 2012). 13CO () emission confirmed rotational support and enabled a measurement of protostellar mass (0.2 ). There is also the recent detection of a possible Keplerian disk around the prototype Class 0 system VLA1623 (Murillo & Lai, 2013). Only a few disks have been resolved at millimeter wavelengths around Class I sources (e.g. Rodríguez et al., 1998; Launhardt & Sargent, 2001; Brinch et al., 2007; Lommen et al., 2008; Jørgensen et al., 2009; Takakuwa et al., 2012; Hara et al., 2013), but the results do point to large disks being prevalent in the Class I phase (Eisner, 2012).
The multiplicity of protostars is better characterized than their disk properties thus far. Connelley et al. (2008) carried out a multiplicity survey of Class I protostars in the near-infrared (1.6 µm, 2.15 µm, and 3.7 µm) with spatial resolutions as fine as 70 AU (033). They found a rather flat separation distribution between 100 AU and 1000 AU, with increasing multiplicity on 3000 AU scales. At separations 500 AU, an expected scale for disk formation, that study found 35 multiple protostars. However, the infrared observations are biased against protostars that are deeply embedded in their natal envelopes, as most Class 0 and Class 0/I protostars are. Only interferometric observations in the millimeter and centimeter can characterize multiplicity in the early stages of protostellar evolution. Work by Looney et al. (2000) showed that multiple systems are prevalent on spatial scales of 1000 AU in the Class 0 and I phases. Chen et al. (2013) recently found that Class 0 protostars might have a higher multiplicity fraction than Class I protostars. There have only been a few studies with high enough resolution to probe multiplicity on scales 500 AU in the millimeter; Maury et al. (2010) had suggested a lack of Class 0 binary systems between 150 AU and 550 AU based on their data combined with Looney et al. (2000), arguing that fragmentation and disk formation were suppressed by magnetic fields. Another study by Enoch et al. (2011) in the Serpens star forming region only detected 1 source out of 9 with evidence of multiplicity on scales less than 415 AU. However, Chen et al. (2013) found evidence for 7 systems to be multiple with separations 500 AU and Reipurth et al. (2002, 2004) observed 21 systems and found 7 to be multiple systems with 4 separated by 500 AU.
The results on scales 150 AU are quite sparse; there are currently only 5 Class 0 or Class I systems known to be multiples or at least candidate multiples with such close separations from millimeter and centimeter observations: L1551 NE (Reipurth et al., 2002), L1551 IRS5 (Looney et al., 1997; Rodríguez et al., 1998), IRAS 16293-2422A (Pech et al., 2010), HH211 (Lee et al., 2009), VLA1623 (Murillo & Lai, 2013). Connelley et al. (2008) found 13 multiple Class I protostars with binary separations 150 AU in the infrared. Thus far, it is unclear if the small numbers at radio wavelengths reflect a true paucity or simply lack of observations with high enough resolution (or high resolution observations with low sensitivity). A paucity of binaries on scales 150 AU could indicate that binaries typically form with larger separations (few 1000 AU) and migrate to smaller radii. Offner et al. (2010) proposed such a scenario where turbulent fragmentation caused binary systems to form and they subsequently migrated.
The conflicting and sparse results on binaries and disks in the early phases of protostellar evolution can be attributed to small sample sizes and low spatial resolution. The maximum angular resolution of sub/millimeter interferometers, has been previously limited to 02, corresponding to a spatial resolution of 45 AU at the 230 pc distance of the Perseus molecular cloud; however, few protostars have been observed at these highest resolutions needed to characterize close binary protostars and disks. Spatial resolutions better than 50 AU are necessary in order to determine when (what evolutionary stage) and where binary protostars form, and by what mechanism; 50 AU is roughly the peak of the binary separation distribution for solar-type field stars (Raghavan et al., 2010). It is difficult to determine the fragmentation mechanism on an individual basis; however, the characteristics of the systems may indicate that one mechanism is more likely than another. Moreover, with the small sample of known proto-binaries separated by 150 AU, even small additions are important.
The NRAO Karl G. Jansky Very Large Array (VLA) opens a new window for the study of protostars with its order of magnitude increase in the sensitivity in the 7 mm band and currently unprecedented resolution of 006. We have observed three Class 0/I protostars (L1157-mm, CB230, and L1165-SMM1) in the Cepheus Flare region (d 300 pc) (e.g. Kirk et al., 2009), attempting to characterize their disk properties and multiplicity. Complementary data are taken with the Combined Array for Research in Millimeter-wave Astronomy (CARMA) for L1165-SMM1 and CB230 IRS1, with corresponding CARMA data taken from the literature for L1157-mm (Chiang et al., 2012). Since all these targets are at declinations 59°, they cannot be observed by the nearly complete Atacama Large Millimeter/submillimeter Array (ALMA) and these VLA observations provide the most detailed view of their small-scale structure for the foreseeable future. Despite the small sample of protostars, the high-fidelity dataset enables us to shed new light on the properties of disks and multiplicity in young protostellar objects.
The paper is organized as follows: the sample, observations, and data reduction are detailed in Section 2, the basic observational results are given in Section 3, the results are discussed in Section 4, and we present our conclusions in Section 5.
2 The Sample, Observations, Data Reduction, and Analysis
We observed the protostars CB230 IRS1, L1165-SMM1, and L1157-mm with the VLA in A, B, and C configurations at = 7.3 mm, 1.4 cm, 3.3 cm, 4.0 cm, and 6.5 cm; the source properties and coordinates are given in Table 1. We also obtained observations from CARMA for L1165-SMM1 at 1.3 mm in B and C configurations and CB230 IRS1 at 3.4 mm in C configuration.
2.1 Sources
The three selected protostars are all isolated and located in the Cepheus Flare region. L1157-mm is found within one of several denser regions within a larger ring-like molecular cloud (Kirk et al., 2009) and L1165-SMM1 and CB230 IRS1 reside within discrete dark clouds. Despite the small sample, the sources span a range of luminosities and bolometric temperatures. Class 0 and Class I protostars are typically distinguished using the ratio of submillimeter luminosity () to bolometric luminosity () and/or bolometric temperature (). The bolometric temperature is defined as the temperature of a blackbody with the same average frequency as the observed data. For a protostar to be a Class 0 source, it must have either Tbol 70 K or Lsubmm/Lbol 0.005 (Chen et al., 1995; Andre et al., 1993); however, protostars can fulfill the Lsubmm/Lbol criterion, but not necessarily the Tbol criterion and we refer to these sources as Class 0/I sources.
L1157-mm (IRAS 20386+6751) is a Class 0 source with = 40 K and Lsubmm/Lbol = 0.018 and it has the lowest luminosity of the sample with 4.3 . The envelope surrounding L1157-mm is also found to have a flattened/filamentary structure that is extended perpendicular to the outflow direction (Looney et al., 2007). Observations of the outflow indicate that the protostar is viewed with a near edge-on orientation (Gueth et al., 1996). L1157-mm was studied extensively with CARMA, aiming to detect emission from its disk (Chiang et al., 2012); however, the source remained unresolved at a resolution of 03 (90 AU) at 1.3 mm and 3.4 mm. Models of the dust emission without an unresolved disk component are a modestly better fit to the data than those with a disk, suggesting that any disk around L1157-mm has very little overall mass; model-dependent estimates range from 0.004 to 0.024 .
The protostar L1165-SMM1 (IRAS 22051+5848, HH 354 IRS) was first examined in the submillimeter by Visser et al. (2002) with 850 µm dust continuum maps and outflow maps; Reipurth et al. (1997) had previously noted the Herbig-Haro object near this source. There is also a bright infrared source (IRAS 22051+5849) 89″ (0.13 pc) away from L1165-SMM1, but it is not detected in the submillimeter maps by Visser et al. (2002). The Spitzer c2d survey identified this source as a candidate young stellar object and it has a spectral index consistent with a Class II source (Evans et al., 2009). We classify L1165-SMM1 as a Class 0/I source given that / = 0.012 and Tbol 78 K; this classification makes use of new Herschel photometry that sample the protostellar SED between 100 µm and 500 µm (see Appendix).
The difference between the new and previous determinations for L1165-SMM1 is due to the inclusion of near-infrared fluxes in the calculation of and a well-sampled SED out to the millimeter from Herschel. We note that inclination effects can lead to elevated values of , causing Class 0 sources to be classified as Class I sources. This is due to near to mid-infrared scattered light emission escaping through the outflow cavities (Jørgensen et al., 2009; Launhardt et al., 2013) and the frequency-weighted nature of makes it very sensitive to the level of short-wavelength flux. / is also affected by inclination, but less than since it is the integral of the flux density rather than a frequency-weighted average wavelength.
The protostar CB230 IRS1 (L1177, IRAS 21169+6804) resides within an isolated globule identified by Clemens & Barvainis (1988). Near-infrared imaging previously detected a companion separated from IRS1 by 10″ (3000 AU) to the east (Yun, 1996); we refer to this companion as IRS2. IRS2 has been detected at wavelengths between 1.2 µm and 24 µm (Massi et al., 2008), but is undetected in Herschel data at 100 µm (Launhardt et al., 2013), SCUBA at 450 µm (Launhardt et al., 2010), and OVRO 1.3 mm and 3.4 mm data (Launhardt et al., 2001; Launhardt, 2001). CB230 IRS1 is also classified as a Class 0/I source with / = 0.037 and = 189 K (Launhardt et al., 2013).
Both L1165-SMM1 and CB230 IRS1 are found to be FU Ori-like objects from CO and water absorption in their near-infrared spectra (Reipurth & Aspin, 1997; Greene et al., 2008; Massi et al., 2008). The distances to all the sources are uncertain given their association with the Cepheus Flare, but are estimated to be between 250 pc and 440 pc (Viotti, 1969; Straizys et al., 1992; Kun, 1998; Kun et al., 2008); we have adopted a distance of 300 pc as we have in previous studies (Tobin et al., 2010b, 2011). The selected protostars all have rather filamentary envelopes in dust extinction at 8 µm (Tobin et al., 2010b) and have strong emission in the dense gas tracers NH3 and N2H+. All the protostars have velocity gradients normal to the outflow direction that may be indicative of rotation or infalling flows along the envelope; L1165 and CB230 IRS1 have gradients that are 2 larger than the gradient in L1157-mm (Tobin et al., 2011).
2.2 VLA Observations
The observations were taken in the standard continuum mode with 2 GHz of total bandwidth covered by 16, 128 MHz wide sub-bands that are further divided into 64, 2 MHz channels with four polarization products. Details of the observations are listed in Table 2. The observations in C configuration were taken between 2012 February and March. Each track was shared between the three target sources, with alternating observations on a target source for 4 minutes and then observing the gain calibrator J2022+6136 for 1 minute. An additional C-array observation was taken in Jul 2013 at 4.0/6.5 cm for L1165 and CB230 to complement the shorter wavelength data. The observations at 4.0/6.5 cm observed the calibrator J2148+6107 for 1 minute and then each source for 12 minutes. In the 4.0/6.5 cm observations, the two 1 GHz basebands were separated by 1.8 GHz with central wavelengths of 6.5 cm and 4.0 cm in order to measure a spectral index from the 4.0/6.5 data alone. The observations in B configuration were carried out in 3 hour scheduling blocks for each source in 2012 June. The protostars were observed at = 7.3 mm, 1.4 cm, and 3.3 cm during the same track. The observations were taken in a fast switching mode to compensate for rapid atmospheric phase fluctuations, observing the source for 1 minute and the gain calibrator for 30 seconds. The lack of a strong calibrator less than 10° away from any of the protostars reduced the observing efficiency to 25% due to slew times. The A configuration observations were taken in 1 hour blocks over many dates between October 2012 and December 2012 (Table 2). The observations at 7.3 mm, 1.4 cm, and 3.3 cm were taken in separate observing blocks to maximize probability of scheduling; 1.4 cm and 3.3 cm data can be observed during more marginal weather than 7.3 mm. The same gain calibrators were used for both A and B configurations and either 3C48 or 3C286 was used for flux density calibration. For all configurations, we did an interferometric pointing scan at 3.3 cm on the primary calibrator every hour for the 7.3 mm and 1.4 cm observations, as pointing errors become apparent on this timescale; pointing is not necessary at 3.3 cm or 4.0/6.5 cm.
Each dataset was reduced using the Common Astronomy Software Application (CASA)222http://casa.nrao.edu. The raw visibility data were downloaded from the VLA archive as CASA measurement sets. We first inspected the amplitudes and phases in each dataset and flagged uncalibrateable data, characterized by low amplitudes, amplitude jumps, phase jumps, and/or periods of high phase decorrelation. The amplitudes across all spectral windows were also inspected for issues such as radio frequency interference. Following the data editing, we used the setjy task with the appropriate clean component model to set the absolute flux density scale of the flux density calibrators identified in Table 2. We then checked for updated antenna positions and generated a gain table to correct the phases using the gencal task. The atmospheric opacity was determined from the weather station data via the plotWeather task and the opacity in each spectral window was used as input in all subsequent amplitude calibration tasks. We then performed first-pass gain calibration for amplitude and phase on the flux calibrator and primary gain calibrators using the gaincal task. When 3C48 was used as the flux calibrator, we only considered baselines with uv-distances less than 1000 k since the source is resolved-out on longer baselines. We then used the fluxscale task to determine the flux of the primary gain calibrators at each observed wavelength. The setjy task was then used to set the measured fluxes of the gain calibrators. The absolute calibration uncertainty is expected to be 10% and we only quote statistical uncertainties hereafter.
We next calibrated the bandpass solution using the bandpass task and we used the primary gain calibrator to determine the bandpass solution. Therefore, it was necessary to calculate a gain solution on 10 second timescales to compensate for the rapid phase variations over the course of the track, prior to calculating the bandpass solution. After bandpass calibration, we performed a final gain calibration for amplitude and phase using the gaincal task, over the entire length of each calibrator scan. The calibration tables from the bandpass and gain calibrations were then applied to the data using the applycal task. Following the application of the calibration data, we verified that the calibrations were properly applied by examining the phase and amplitudes of the calibrated data. The B and C configuration data were reduced using CASA 3.3, the A configuration data were reduced using CASA 3.4 and 4.0, and the 4.0/6.5 C configuration data were reduced using CASA 4.1. No significant differences were noticed between reductions with different CASA versions.
Following the gain calibration, the data at each wavelength were imaged using the clean task. The measurement sets for each configuration and track were combined using the concat task and we deconvolved each dataset as a whole. We used the Hogbom clean algorithm because this method tends to work better than the standard Clark algorithm for snapshot observations with a sparsely sampled uv-plane333CASA Cookbook. We used a clean threshold of 1.5 the noise measured from the dirty map and a clean mask drawn closely around the areas of source emission. We also imaged the sources with uv-tapering at 500 k, 1000 k, 1500 k, and 2000 k to bring out more large-scale structures.
The resulting images from the VLA at 7.3 mm in A configuration have an angular resolution up to 006 (18AU; natural-weighting) and are the highest resolution images obtained toward these particular protostars. The 1.4 cm and 3.3 cm data have corresponding angular resolutions of 02 (60AU) and 03 (90AU); the exact resolutions depend on the value of the robust parameter and any applied tapering. The 4.0 cm and 6.5 cm data had resolutions of 4″ and 7″ respectively. In the case of the 7.3 mm and 1.4 cm data, we generally applied tapering and use a robust parameter of 2 which is equivalent to natural weighting. For the 3.3 cm data, we used robust values of 0.5 and 1 for L1165-SMM1 and CB230 IRS1 respectively to achieve higher resolution.
2.3 CARMA Observations
L1165-SMM1 was observed by CARMA in C and B configurations at 1.3 mm in December 2012 and January 2013, details are given in Table 3. The B-array data were taken during exceptionally good weather as indicated by the low opacity at 225 GHz. The local oscillator frequency was 225.05 GHz and 6 correlator windows were configured to have 500 MHz bandwidth for continuum observation, yielding a total continuum bandwidth of 6 GHz (dual-side band) and the remaining two windows were configured to have 31 MHz bandwidth and 0.13 km s-1 channels. These two windows were set to observe 12CO, 13CO, and C18O (), with 12CO and C18O being observed in the same spectral window in opposite side-bands. The data were taken in a standard observing loop, science target observations bracketed by gain calibrator observations. The C configuration data observed the calibrator 3C418 for 3 minutes and then the source for 9 minutes; the first B configuration track observed 3C418 for 2 minutes and then L1165-SMM1 for 9 minutes. The second B configuration track observed 3C418 for 2 minutes, L1165-SMM1 for 8 minutes and then a test point source 2148+611 for 1 minute.
CB230 IRS1 was observed by CARMA in C configuration at 3.4 mm in January 2013 and May 2013. The local oscillator frequency was 90.9 GHz and one 500 MHz window was configured for continuum observation yielding 1 GHz of continuum bandwidth (dual-side band). Spectral lines were observed in the remaining windows, but these data will not be considered here. The data were taken in a standard observing loop, science target observations bracketed by gain calibrator observations. The calibrator (1927+734) was observed for 3 minutes and then the CB230 IRS1 for 15 minutes.
The data were reduced with the MIRIAD software package (Sault et al., 1995). We first split out the noise source observations and then applied corrected baseline solutions when needed using the uvedit task. Following this, we applied calibrations for transmission line length changes due to thermal expansion using the linecal task. After these initial calibrations, we inspected the phase and amplitudes of the data versus time and flagged obvious bad data, consisting of but not limited to phase jumps, high phase variance, and low amplitudes. We then applied bandpass corrections determined with the mfcal task, using the noise source to correct the 31 MHz bands and a bright quasar for the 500 MHz bands. Following these calibrations, we determined the flux density of the primary gain calibrator using the absolute flux calibrators listed in Table 3 with the bootflux task. The flux calibration uncertainty is estimated to be 10 - 20% and we only quote statistical uncertainties hereafter. We then calibrated the complex gain and phases on the wide-band continuum data using the mfcal task and transferred these solutions to the 31 MHz bands. We then ran mfcal on the 31 MHz windows to correct for phase offsets between the 500 MHz and 31 MHz bands.
The data were imaged by first inverting the visibility data to construct the dirty map with the invert task. The dirty map was CLEANed with the mossdi task and the clean components are then convolved with the clean beam and added back to the residuals using the restor task to output the final clean map.
The image fidelity in B-array was verified by imaging the faint secondary calibrator taken in the second B-array track, finding an unresolved point-source. While we did not observe a secondary calibrator in the first track, the science target structure was consistent between the first and second track, indicating that the conditions were similarly good.
2.4 Ancillary Infrared Data
Near and mid-infrared data are also included in this paper for CB230 to illustrate the larger-scale structure of CB230 IRS1. The Ks-band near-infrared imaging of CB230 IRS1 was taken with the 2.4 m Hiltner telescope of the MDM Observatory at Kitt Peak on 2008 June 12. The data were taken in a 5-point dither pattern and off-source sky frames were observed every 6 minutes. The data were reduced using standard methods for near-infrared data reduction in IRAF444IRAF is distributed by the National Optical Astronomy Observatories, which are operated by the Association of Universities for Research in Astronomy, Inc., under cooperative agreement with the National Science Foundation.. See Tobin et al. (2008) for more details of the observations and reduction procedure.
The Spitzer IRAC and MIPS photometry were published in Massi et al. (2008), but they did not show any Spitzer images in their work. We previously published the 3.6 µm image in Tobin et al. (2010b) and the reduction procedure can be found there; the MIPS 24 µm image is taken directly from the Spitzer archive.
3 Results
The VLA imaging toward the protostars L1165-SMM1, L1157-mm, and CB230 IRS1 has enabled us to examine their circumstellar structure in detail previously unattainable with the old VLA system and at resolutions currently unmatched by a millimeter interferometer. The emission at 7.3 mm is expected to be dominated by thermal dust emission with a contribution of optically thin free-free emission from the protostellar jets (Anglada, 1995; Anglada et al., 1998; Shirley et al., 2007); the 1.4 cm emission is expected to have roughly equal contributions from dust emission and free-free, and the 3.3 cm, 4.0 cm, and 6.5 cm data are expected to be dominated by free-free emission.
3.1 L1165-SMM1
The 7.3 mm data for L1165-SMM1 are shown in Figure 1; the left panel shows the larger-scale (150 AU) emission with the visibilities tapered at 500 k yielding 03 resolution. The emission on 03 scales is clearly asymmetric with extension toward the southeast. The 2000 k tapered image, having a resolution of 01, is shown in the middle panel of Figure 1, and the source is resolved into an apparent binary system at the higher resolution, with a separation of 03 (100 AU). Both sources are clear detections, but the secondary is about 3 fainter than the primary at 7.3 mm. The primary also appears marginally resolved in the central panel of Figure 1 and the companion is unresolved. Finally, the highest resolution image with A-array data only, is shown in the right panel of Figure 1. This image shows that the primary source is resolved, appearing disk-like (60 AU diameter) and extended perpendicular to the outflow; both sources appear fainter due to more emission being resolved-out in the A-array only data.
The centimeter-wave emission (1.4 cm and 3.3 cm) is shown in Figure 2. The 1.4 cm image shows that both sources are point-like and distinct from each other at this wavelength. At 3.3 cm, the primary source is well-detected, but the secondary is only a 3.5 detection and blended with the primary. The detection of the secondary source at both 1.4 cm and 3.3 cm wavelengths is evidence that it is a bonafide protostar, given the large contribution from free-free emission at these wavelengths requires some source of ionization. Moreover, since the secondary is located normal to the outflow direction of the primary, it is unlikely that an outflow shock could be causing a false secondary in dust continuum and/or free-free emission. We examined the position of the young stellar object (IRAS 22051+5849) located 89″ north at 3.3 cm, 4.0 cm, and 6.5 cm image and did not find evidence of emission. We do not show the 4.0 cm or 6.5 cm data for the sake of brevity, but list the flux densities in Table 4.
Follow-up observations of dust continuum emission at 1.3 mm were obtained with CARMA, having 03 resolution. The 1.3 mm data are shown in Figure 3 and trace an extended, flattened structure oriented perpendicular to the outflow, possibly a circumbinary disk. The disk structure appears to be surrounding the two protostars and it appears to be more extended southeast in the 1.3 mm data than at 7.3 mm. There is also an extension toward the northwest in the 1.3 mm data not seen at 7.3 mm. We also found that when the 1.3 mm data were imaged with the robust parameter set to -2, increasing the resolution of our deconvolved image (with increased noise), the two sources are still blended and there is extended structure associated with the primary (Figure 3, top right panel). Gaussian fitting enabled the sources to be separated; the flux density of the secondary is a factor of 5 less than the primary, a larger ratio than at 7.3 mm. The integrated flux densities measured with CARMA and the VLA are given in Table 4 as well as Gaussian fits to the image data.
In order to better determine the properties of the circumbinary structure around L1165-SMM1, it is necessary to decompose its emission from that which is more closely associated with the two protostars. We used the positions of the two sources from the VLA 7.3 mm map as a prior to fit the flux densities of the sources in the 1.3 mm robust = -2 map. Point sources rather than Gaussians were used in this case because our goal is to separate the extended structure from the compact structure. We performed this step on the robust = -2 map because it has less extended structure and better isolates the emission from the individual sources. Next, we used the positions and fitted flux densities (48.1 mJy and 13.7 mJy) to construct a model image of the two blended point sources at the resolution of the robust = 1 map (Figure 3, bottom left). We then subtracted the model from the data and the residual image is shown in the bottom right panel of Figure 3; the flux density in the residual image is 20.53 mJy. The residual image shows that the robust = 1 map cannot be reproduced by two blended point sources, having what appears to be a more extended circumbinary structure. We note that this structure is slightly offset to the northeast from the primary source; however, this could be due to projection effects because L1165-SMM1 is not viewed edge-on. While this analysis was done in the image plane, we also performed the same analysis in the uv-plane by subtracting point sources with the uvmodel task and obtained a similar result.
We do find evidence for rotation on the scale of the circumbinary disk structure in 13CO () emission. Figure 4 shows the 13CO channel maps and the emission is consistent with rotation on the scale of the disk. However, the signal-to-noise of the data are not good enough to attempt a mass measurement or verify a Keplerian velocity profile. The 12CO () line was also detected in our CARMA observations, the integrated red and blueshifted CO emission is shown in Figure 5. The blue and red-shifted sides of these outflows are consistent with the outflow observations by Visser et al. (2002). While not well-resolved, the blue-shifted emission is centered toward the primary source and the redshifted emission is centered near the secondary source. The centroid shift between the blue and red-shifted 12CO emission could have a number of causes: rotation of the disk, rotation of the outflow, or two outflows originating from either source. The offset in the blue and red-shifted 12CO emission appears similar to that of CB26. The characteristics of CB26 could be explained as outflow rotation via the outflow being coupled to the rotating disk; however, a misaligned outflow from a binary companion was also suggested as a possibility (Launhardt et al., 2009).
3.2 CB230 IRS1
The 7.3 mm data for CB230 IRS1 are shown in Figure 6 with the combined A, B, and C configuration images shown with tapering at 500 k and 2000 k in the left and middle panels; A-array only data are shown in the right panel. A second source, separated from the main protostar by 03 (100 AU) is detected in the two highest resolution images. The sources are marginally resolved at 027 resolution (500k tapering) and resolved into two sources in the higher resolution data. The primary source appears unresolved in the high-resolution images; Gaussian fits to the images, listed in Table 5, indicate that the source is only marginally more extended than the beam. The secondary, however, appears to be resolved in both the A-array only and 2000 k tapered images and it has a diameter of 60 AU and may be indicative of a compact circumstellar disk around the source.
Both sources are also detected at 1.4 cm and 3.3 cm as shown in Figure 7. The 3.3 cm detection toward the secondary is marginal (3.5); however, the 3.3 cm emission appears extended toward the secondary, possibly related to the outflow activity in the source. Moreover, at 1.4 cm the primary appears resolved in the direction of the outflow axis. The presence of 3.3 cm emission located at the secondary source is an indication that there is an outflow driving source, energetic enough to produce the ionization required to have detectable free-free emission. The flux densities measured from the VLA data are given in Table 5 along with Gaussian fitting of the sources. The CARMA data had lower resolution than the other datasets, 2″, but they provided a shorter wavelength data point. We do not show the 3.4 mm, 4.0 cm, and 6.5 cm data data for the sake of brevity, but the flux densities are given in Table 5.
We noted in Section 2 that CB230 IRS1 has an infrared companion (CB230 IRS2) separated from the main protostar by 10″ (3000 AU), making CB230 IRS1 a triple system. Near and mid-infrared images of CB230 IRS1 and IRS2 are shown in Figure 8. We examined the location of the wide tertiary source for emission at all observed wavelengths and did not detect it; this source is well within the VLA and CARMA primary beams at 7.3 mm and 3.4 mm (65″ and 72″ respectively). Therefore, the tertiary source does not appear to have substantial dust emission or free-free emission, consistent with non-detections at 1.3 mm and 3 mm (Launhardt et al., 2001; Launhardt, 2001; Launhardt et al., 2010); the 3 upper limits are given in Table 5.
3.3 L1157-mm
Unlike L1165-SMM1 and CB230 IRS1, L1157-mm appears to be a single source; only one continuum peak is observed in the 7.3 mm image shown in Figure 9, as well as the 1.4 cm and 3.3 cm data in Figure 10. There is a hint of the source being marginally resolved perpendicular to the outflow in the A-array-only image shown in Figure 9. Gaussian fitting to the image data (Table 6) indicates that the source is marginally resolved in the highest resolution 7.3 mm data and the deconvolved position angle is perpendicular to the outflow. The marginally extended emission is suggestive of a small disk (R 15 AU), but by no means definitive. The lack of significant resolved structure on small-scales is consistent with the source having point-like structure at 03 resolution at 1.3 mm and 3.4 mm (Chiang et al., 2012). The 1.4 cm data appear to be resolved, as evidenced by the peak flux differing from the integrated flux, while the 3.3 cm data are consistent with a point source. This could be indicative of the 1.4 cm data having a marginally extended free-free component as often found by Reipurth et al. (2002, 2004).
3.4 Millimeter-Centimeter Spectra
Between 1.3 mm and 3.3 cm, the broad-band spectra of many protostellar objects transition from one dominated by thermal dust emission to being dominated by free-free emission from the thermal jets driven by the protostars and disks (Anglada, 1995; Anglada et al., 1998; Shirley et al., 2007). Emission at 7.3 mm lies in the part of the spectrum where there may be significant contributions from both dust and free-free emission. In order to interpret the 7.3 mm emission in terms of dust emission alone, we must subtract the potential contribution from free-free emission.
The spectra of the three sources are plotted in Figure 11 from 1.3 mm to 6.5 cm. The individual flux measurements for the companion sources to L1165-SMM1 and CB230 IRS1 are shown as well as the total flux density. We have attempted to reasonably match the resolutions of the data from different wavelengths such that we are measuring dust emission from the same spatial scales; however, the highest resolution data at wavelengths shortward of 7.3 mm is between 03 (at best) and 2″ (at worst) for these sources. Wavelengths longer than 1.4 cm are dominated by unresolved free-free emission, therefore resolution does not matter as much, except that the multiple sources are not as well-resolved.
We fit the full spectra simultaneously, assuming that the data can be described with two spectral slopes, one representing the thermal dust emission and the other representing the free-free emission. The fits are made using the least-squares fitting routine mpfit (Markwardt, 2009); the total fluxes at all the wavelengths plotted in Figure 11. In the fitting procedure, the free-free slope is constrained to be between and , while the thermal slope is assumed to be between and . Note that this fit is for the total flux density of a source, given that the shorter wavelength data do not resolve the proto-binaries. The sources have a range of thermal and free-free spectral slopes that are given in Table 7. CB230 has a steep spectral slope, while L1165 has a shallow spectral slope; the spectral slopes in the centimeter are consistent with previous measurements toward protostars (Shirley et al., 2007). We note that there is significant uncertainty in the spectral slopes given the degeneracies between the thermal and free-free components; moreover, there may be variability in the free-free emission (e.g. Shirley et al., 2007) and that would further add to the uncertainty.
The spectral slope of the free-free emission enables us to subtract its contribution from the 7.3 mm data to determine the flux density only due to dust emission. This enables us to estimate the mass of the emitting material with some assumptions. Free-free emission at 7.3 mm comprises 10% of the total in L1165-SMM1, 19% in CB230 IRS1, and 18% in L1157-mm, the values are relative to the flux densities measured in the 500 k tapered images. A lingering issue is that we do not know free-free spectral slope of the companion sources since we can only measure the spectral index of the total flux. Therefore, we have assumed that the spectral slope of the total flux is applicable to the primary and secondary sources.
3.5 Mass Estimates
The masses of the material surrounding each protostar can be estimated by assuming that the dust emission is isothermal and optically thin, using the formula
| (1) |
is the Planck function. We have assumed that = 30 K, = 0.035 cm2 g-1 (dust+gas opacity, assuming a dust-to-gas ratio of 100), and D = 300 pc, basing our assumptions on previous works (Beckwith et al., 1990; Andrews & Williams, 2005; Tobin et al., 2012). The dust opacity spectral index () parameter is estimated from the fit to the spectrum thermal slope (Table 7), under the assumption that Fλ . Note that the dust opacity we have assumed is larger than typically assumed for protostars (e.g. Ossenkopf & Henning, 1994) and more typical of the Class II sources (e.g. Andrews & Williams, 2005; Andrews et al., 2009); however, a larger opacity may be correct given the indications of grain growth in the protostellar phase (Kwon et al., 2009; Tobin et al., 2013). With this opacity we can more directly compare our results to those of more evolved disks, but we may be systematically underestimating the dust masses if the dust opacities are indeed lower.
The derived masses are in the range 0.01 to 0.2 , comparable to the masses found for Class II disks (e.g. Andrews et al., 2010). The mass estimates for each source and their components are listed in Table 8, along with the assumed . The mass estimates agree reasonably well at the different wavelengths for all sources; differences likely reflect a combination of uncertainties in absolute flux calibration, variations in dust opacities, sensitivity to different spatial scales, etc. Note that these mass estimates are temperature dependent and larger characteristic temperatures would yield lower mass estimates. Moreover, these sources certainly have temperatures gradients that cannot be accounted for in this simple analysis.
4 Discussion
Two protostars out of our sample of three are found to have a previously unknown companion source separated by 03 (100 AU). The presence of these companions raises the questions: how did these companions form and did they form in situ, or have their separations evolved significantly via dynamic evolution.
4.1 Constraining the Probable Binary Formation Mechanism
There are three likely mechanisms for the formation of binary/multiple protostellar systems. The first is fragmentation induced by the rotating collapse of the infalling envelope (e.g. Burkert & Bodenheimer, 1993; Boss, 1995; Tohline, 2002; Sterzik et al., 2003). In this scenario, a rotating, spherical envelope has a mild azimuthal density perturbation and simulations show that the density perturbation becomes enhanced during collapse. The rotation causes the formation of a large, flattened, and asymmetric density structure from which two density peaks form with 1000 AU separations. While these simulations are simplistic and have rather high initial rotation rates, envelopes have been observed to be even more asymmetric than assumed in these simulations (Tobin et al., 2010b; Launhardt et al., 2013). Therefore, this mechanism could form both wide (1000 AU) and close ( 500 AU) binary systems, depending on the angular momentum of the infalling gas. The wide binary systems could then further evolve to smaller separations via dynamical friction, or if the infalling matter had high angular momentum, the binary separations might widen rather than shrink (Zhao & Li, 2013).
The second mechanism is turbulent fragmentation. Offner et al. (2010) found that protostars forming in global molecular cloud simulations typically had initial separations of a few thousand AU and fragmentation on the scale of the disk could be suppressed by radiative heating. These protostars could then migrate toward smaller separations via dynamical friction and the accretion of low angular momentum gas. The dynamical evolution could shrink the separations of systems from 2000 AU to 200 AU on timescales as short as 10 kyr. Thus, even on the short timescale of protostellar collapse, binaries could migrate to small separations rapidly enough that it would be unclear if they formed in-place or if they had migrated.
The third formation mechanism is direct fragmentation of the rotationally-supported circumstellar disk via gravitational instability (e.g. Kratter et al., 2010; Vorobyov, 2010; Zhu et al., 2012). This is similar to the fragmentation of the rotating, asymmetric envelope, but is happening within the rotationally-supported circumstellar disks, whereas the flattened envelope was not supported by its rotation. In this scenario, a large, massive disk ( few 0.1 ) forms due to the angular momentum of the infalling envelope. The self-gravity of the disk enables fragmentation to happen at large radii, forming the binary components in-place and migration of the fragments could take place within the disk. The fragments would also all be in the equatorial plane of the system and would share a common angular momentum vector. This is also the case for rotational fragmentation of a common infalling envelope. However, there is no expectation for protostars formed via turbulent fragmentation to share the same orbital plane/angular momentum vector as their companions.
We suggest that the likely fragmentation mechanism for CB230 IRS1 and L1165-SMM1 is direct fragmentation of their circumstellar disks. The principle evidence for this is the apparent circumbinary disk around the two protostars in L1165-SMM1 and that the secondary sources in both CB230 IRS1 and L1165-SMM1 being located nearly orthogonal to the outflow direction. This is expected if they formed in a disk and the outflow is launched perpendicular to the equatorial plane of the disk. While we did not detect evidence of a circumbinary disk around CB230 IRS1, its presence or lack thereof cannot be ruled out with the data in hand. The case for a circumbinary disk around L1165-SMM1 is reasonably strong given that the emission is not simply comprised of two blended point sources as shown by our image decomposition in Figure 3. Moreover, the total flux is 10 mJy lower in the robust = -2 image than in the robust = 1 image, indicative of extended structure being filtered-out at higher resolution. Lastly, there is an indication of rotation on the scale of the circumbinary disk from the 13CO () channel maps in Figure 4. We note that rotationally-supported circumbinary disks have been observed toward GG Tau ((Guilloteau et al., 1999) and L1551 NE (Takakuwa et al., 2012); therefore, it is conceivable that the disk around L1165-SMM1 is rotationally supported. While the masses of material surrounding L1165-SMM1 and CB230 IRS1 inferred from dust emission are not large, it is important to remember that much of the mass that was present prior to fragmentation has likely already been Incorporated into the protostellar objects and we are simply observing the leftovers.
We concede that even with the evidence presented we cannot concretely rule-out envelope rotational fragmentation or turbulent fragmentation with subsequent migration, though these processes seem unlikely for the following reasons. Rotational fragmentation of the envelope is probably unlikely since the envelope would have high angular momentum, and this would keep the sources from migrating toward smaller separations until the envelope had dissipated (Zhao & Li, 2013). The extended emission observed in single-dish bolometer maps shows that the two binary sources are still embedded in their natal envelopes (Visser et al., 2002; Launhardt et al., 2010). Turbulent fragmentation is also probably not likely since migrating companions would not have preferential alignment with the expected disk plane; however, we cannot absolutely rule-out chance alignment with the disk plane for a sample of two.
We note that both CB230 IRS1 and L1165-SMM1 were observed to have large velocity gradients ( 11 km s-1 pc-1 ) perpendicular to the outflow directions in their respective envelopes, relative to the full samples presented in Tobin et al. (2011); Chen et al. (2007). L1157-mm has a smaller velocity gradient (3.5 - 6.2 km s-1 pc-1 ) and is found to be single. Under the assumption that the velocity gradients trace pure rotation and the central protostellar masses were 0.5 , the centrifugal radii of the material at 2000 AU, were 100 AU, 150 AU, and 50 AU for L1165-SMM1, CB230 IRS1, and L1157-mm respectively (Tobin et al., 2012). These values agree reasonably well with the scale of the binaries observed in L1165-SMM1 and CB230 IRS1 as well as the size of the circumbinary disk structure in L1165-SMM1. Moreover, another close binary candidate HH211 (Lee et al., 2009) was also found to have a large velocity gradient normal to the outflow (Tanner & Arce, 2011; Tobin et al., 2011). While we questioned the interpretation of velocity gradients as pure rotation in Tobin et al. (2011) and Tobin et al. (2012), the coincidence of binary/multiple systems where there are large velocity gradients is suggestive of a relationship between the two, but better statistics are needed.
Our results taken with previous studies increase the number of mm/cm-wave proto-binary systems with separations 150 AU to 7, the others being L1551 NE, L1551 IRS5, IRAS 16293-2422A, HH211, VLA1623; L1527 had been previously suggested to be a 25 AU binary (Loinard et al., 2002), but recent VLA follow-up has ruled this out (Melis et al. 2013 in prep.). Maury et al. (2010) had suggested that there was a lack of binary systems within the specific separation range of 150 AU R 550 AU. While this range is quite specific, there are definitely systems with separations smaller and our detections are near the lower end of this limit. Zhao & Li (2013) had suggested that a prevalence of binary systems at radii 100 AU might result from accreting material that has been magnetically braked and could explain the results of Maury et al. (2010). On the other hand, a large archival study by Chen et al. (2013) finds systems with a variety of separations, and within the region where Maury et al. (2010) suggested a deficit. Our results combined with the other studies indicate that the result from Maury et al. (2010) may have simply resulted from small number statistics.
We note that there is uncertainty in the distance to the sources in this work; however, all distance work thus far (Kun, 1998; Kun et al., 2009; Straizys et al., 1992) does not point to the sources being a factor of two closer, but the sources could be a factor of 1.75 more distant. This uncertainty does not strongly affect any conclusions in this work since the size of resolved structure increases linearly with distance and masses would increase with the square of the distance. Thus, the separation of the companions is at most 200 AU, still within an expected scale for circumstellar disks to form.
4.2 Disk Sizes
The VLA and CARMA observations of L1165-SMM1 have revealed a possible 200 AU diameter circumbinary disk with a total mass of 0.03 ; the mass of just the circumbinary component from image decomposition is 0.007 . The higher resolution VLA observations also show an apparent 40 AU diameter disk-like structure surrounding the primary source. These structures are strong, circumstantial evidence for the presence of a rotationally-supported disk around this Class 0/I protostar. There is evidence of rotation in the 13CO data shown in Figure 4, as well as HCO+ () observations that detect high-velocity (3 km s-1) blue and red-shifted emission located in the plane of the disk (Tobin et al., 2011, 2012). In CB230 IRS1, we observe the presence of a resolved structure 40 AU in diameter surrounding the secondary source, but the primary appears unresolved, indicating a circumprimary disk size of less than 30 AU in diameter. We lack complementary observations at shorter wavelengths that might detect a circumbinary disk, if present. L1157-mm does not have strong indications of a disk-like structure at 7.3 mm, consistent with its lack of resolved disk structure at 1.3 mm and 3.4 mm (Chiang et al., 2012); therefore, any disk in L1157 likely has R 15 AU.
A source of uncertainty in the lack of disk detections is whether or not the 7.3 mm data are simply ‘missing’ the larger disks due to insufficient sensitivity. Studies of Class II disks show that the 8 mm dust continuum emission from T-Tauri disks can be more spatially compact than the emission at shorter wavelengths, indicating that the longest wavelengths are only tracing the innermost regions of the disks where the grains have grown to larger sizes (Pérez et al., 2012). This has been interpreted to be consistent with radial drift of large dust grains toward small radii (Weidenschilling, 1977). Models including radial drift and grain growth during protostellar collapse and disk formation demonstrate that this process could be happening in the protostellar phase as well (Birnstiel et al., 2010). Moreover, evidence for grain growth is also seen in the envelopes before the material even reaches the disk (Kwon et al., 2009).
For L1165-SMM1, the 7.3 mm emission observed on similar spatial scales as the 1.3 mm emission is not as extended, but this may simply be due to our sensitivity limits. The Class 0 protostar L1527 harbors a 125 AU diameter rotationally supported disk (Tobin et al., 2012) and was found to have a 40 AU diameter disk-like structure detected at 7 mm with the old VLA system (Loinard et al., 2002). Follow-up VLA observations of L1527 at 7 mm detect the disk out to 60 AU (Melis et al. 2013 in prep.). Thus, observations at = 7 mm may systematically underestimate the sizes of protostellar disks. The resolved structures are best regarded as lower limits to the disk size and indicate that observations at shorter wavelengths may detect yet larger structures, as was the case for L1527 and L1165-SMM1. Given that L1157-mm lacks resolved structure at shorter wavelengths and in the VLA data we can confidently conclude that its disk is small. On the other hand, CB230 IRS1 may have a larger circumbinary disk that we do not detect at 7.3 mm, given its similarities to L1165-SMM1.
Since our sample was quite small and not all are bonafide Class 0 protostars, we cannot draw broad conclusions about the sizes of disks in Class 0 sources. However, given the youth of L1165-SMM1, it appears to have formed a large disk by the time it transitioned to the Class I phase. The compact circumprimary disk likely formed at the same time as the larger circumbinary disk. Moreover, if the companion source formed via disk fragmentation, the disk would have had to be more massive in the past given the currently low mass of the circumbinary structure.
Recently a few other Class 0 protostars have been found to harbor disks: L1527 in Taurus (Tobin et al., 2010a, 2012) having a confirmed Keplerian disk, HH211 having disk-like structure and possible rotation (Lee et al., 2009), VLA 1623 A having resolved structure and possible Keplerian rotation (Murillo & Lai, 2013), finally IRAS 16293-2422B appears to have a face-on, optically thick disk with R 25 AU (Zapata et al., 2013). Maury et al. (2010) had a sample of 5 sources that they concluded did not show evidence of disks or binaries, but we now know that L1527 does have a disk, so their disk-less sample is reduced to four. Combining the results from these studies, 4 systems have evidence of large (R 100 AU) disks having formed during the Class 0 phase and 6 systems do not have evidence of large disks. Therefore, the rather strong conclusion by Maury et al. (2010) that disk formation is suppressed by magnetic fields during the Class 0 phase does not seem to be supported by more recent results. Rather it appears that there may be a wide diversity in the sizes of Class 0 disks, likely reflecting a variety of initial formation conditions. Note that we have left CB230 IRS1 out of these numbers since we do not know if there is an undetected circumbinary disk present.
4.3 A Disrupted Triple System in CB230?
We noted in Section 3.2 that there is an infrared-detected tertiary component (CB230 IRS2) separated from the main protostar (CB230 IRS1) by 10″ (3000 AU). This source was not detected at millimeter or centimeter wavelengths indicating that the dust mass from this source must be 0.005 (3 upper limit using assumptions from Section 3.5) and that any free-free emission from this source must be very weak, indicating that the source is not driving a strong thermal jet. This leads us to examine its relationship with the protostellar system more closely. The tertiary is a highly-reddened source, not detected in the optical, with strong infrared excess emission at 24 µm (Massi et al., 2008); it is resolved in the near-infrared and there is some diffuse scattered light emission around the source (Figure 8). Moreover, Launhardt (2001) found indications of two outflows in 13CO observations, while not detecting the tertiary in continuum (Launhardt, 2001; Launhardt et al., 2010). Moreover, recent 12CO () also sees strong evidence for an outflow orthogonal to the outflow from the main source (Segura-Cox et al. in prep.).
The near to mid-infrared emission can be explained by a combination of direct stellar light, scattered light, and warm dust emission from an inner disk. Infrared excess emission from the inner disk can be produced with disk masses 0.001 (Robitaille et al., 2007; Espaillat et al., 2010). Thus, all evidence points to the tertiary being young and in close association with CB230 IRS1. Unlike other protobinaries at large separations (e.g. NGC 1333 IRAS 2, L1448 IRS3, BHR71) it does not show the typical signs of extreme youth like IRS1. There is little evidence of it accreting from the large infalling envelope; there is not increased linewidth or velocity structure related to the wide companion in N2H+ or ammonia (Chen et al., 2007; Tobin et al., 2011) and the far-infrared emission is not extended toward its location (Launhardt et al., 2013).
Given its close association with the CB230 IRS1 and its lack of Class 0/I protostellar properties, we suggest that the tertiary source may have formed in closer proximity to the compact binary system, perhaps in a disk and was ejected in a three-body interaction (Reipurth, 2000; Reipurth & Clarke, 2001). Simulations of disk fragmentation in protostellar systems have produced such ejections of low-mass members via interactions with the primary source and other disk fragments (Basu & Vorobyov, 2012). Such an interaction could leave the tertiary with very little circumstellar material (Reipurth, 2000), consistent with the lack of detectable millimeter-wave emission. If the tertiary source was kicked out with a velocity of 1 km s-1 (Basu & Vorobyov, 2012) it could have reached its present position in 15 kyr, well within the expected 500 kyr evolutionary timescales of the system as a whole (Evans et al., 2009). Furthermore, the location of the tertiary is approximately orthogonal to the outflow, in the same plane as the compact secondary and expected disk plane. However, the outflow indicates that the current angular momentum vector of the tertiary may be perpendicular to that of the primary. This hypothesis of the tertiary source being an ejected member could be tested with high-resolution near-infrared spectra of the primary and secondary sources, enabling the relative radial velocities of the sources to be examined. However, it is uncertain if sufficiently accurate velocities could be measured toward these sources, given that the near-infrared emission is dominated scattered light and Covey et al. (2006) was only able to obtain precisions of 2 km s-1 for Class I protostars.
5 Conclusions
We have presented a VLA and CARMA study of three Class 0/I protostellar systems in the Cepheus clouds: L1157-mm, L1165-SMM1, and CB230 IRS1. The VLA observations were taken in A, B, and C configurations at 7.3 mm, 1.4 cm, 3.3 cm, 4.0 cm, and 6.5 cm providing the highest resolution view of these systems at any wavelength. The CARMA observations in B and C-arrays toward L1165-SMM1 have also provided the highest resolution view of the system at 1.3 mm. The results presented have enabled us to expand our knowledge of the disk and binary star formation process by probing scales 100 AU and a 3 mass sensitivity 0.005 , an order of magnitude more sensitive than the typical mass of a T-Tauri disk (Andrews et al., 2009). Moreover, the sizes of the resolved structures from the VLA and CARMA observations provide lower limits on disk sizes during the early stages of protostellar evolution.
We find that 2 (L1165-SMM1 and CB230 IRS1) out of 3 observed systems have an apparent companion separated by 03 (100 AU). The companions are well-detected and resolved from the primary at 7.3 mm and 1.4 cm; they are weakly detected at 3.3 cm and somewhat blended with the primary components. The 1.3 mm imaging of L1165-SMM1 find an extended disk structure surrounding the two components and possibly two outflows. Our results point to a disk fragmentation origin of L1165-SMM1 and CB230 IRS1, given their close proximity and alignment with the expected orbital plane of the disk in these systems; this interpretation is stronger for L1165-SMM1 given the extended disk centered on the primary protostar as observed at 1.3 mm. CB230 IRS1 does have a third member of its system, detected in the near and mid-infrared and its direction from the primary source is perpendicular to the outflow; we do not detect emission from this source between 3.4 mm and 6.5 cm. We suggest that it may have been ejected via a three-body interaction.
Despite the high sensitivity of our VLA observations, we did not detect direct evidence of large (100 AU) disk structures surrounding any of the sources at 7.3 mm. The extended 7.3 mm emission toward L1165-SMM1 is not obviously disk-like and the CARMA 1.3 mm data gave a more firm detection of a probable circumbinary disk. The primary source in L1165-SMM1 does have resolved structure, consistent with a small disk (40 AU in diameter); the secondary source in L1165-SMM1 appears unresolved. The primary source in CB230 IRS1 appears unresolved, and the secondary source appears to have a resolved structure 40 AU in diameter. Finally, L1157-mm does not show strong evidence for a resolved disk, indicating that the disk is at most 15 AU in radius.
We would like to thank the anonymous referee for constructive comments that improved the manuscript. We would also like to thank S. Offner for useful discussions regarding the results and C. Brogan for discussions regarding the data reduction. J. Tobin acknowledges support provided by NASA through Hubble Fellowship grant #HST-HF-51300.01-A awarded by the Space Telescope Science Institute, which is operated by the Association of Universities for Research in Astronomy, Inc., for NASA, under contract NAS 5-26555. H.-F. C. acknowledges support from the National Aeronautics and Space Administration through the NASA Astrobiology Institute under Cooperative Agreement No. NNA09DA77A issued through the Office of Space Science. L.W.L. and H.-F. C. acknowledge support from the Laboratory for Astronomical Imaging at the University of Illinois and the NSF under grant AST-07-09206. P. D. acknowledges a grant from PAPIIT-UNAM. L. L. acknowledges the support of DGAPA, UNAM, CONACyT (México). T. B. acknowledges support from NASA Origins grant NNX09AB89G. Support for CARMA construction was derived from the states of Illinois, California, and Maryland, the James S. McDonnell Foundation, the Gordon and Betty Moore Foundation, the Kenneth T. and Eileen L. Norris Foundation, the University of Chicago, the Associates of the California Institute of Technology, and the National Science Foundation. Ongoing CARMA development and operations are supported by the National Science Foundation under a cooperative agreement, and by the CARMA partner universities. The National Radio Astronomy Observatory is a facility of the National Science Foundation operated under cooperative agreement by Associated Universities, Inc.
Facilities: VLA, CARMA Hiltner, Spitzer
Appendix A L1165-SMM1 Photometry
We have collected relevant photometry for L1165-SMM1 and constructed the spectral energy distribution between 2.15 µm and 850 µm. Note that we do not include the interferometer data in this analysis since they may resolve-out emission from the envelope; moreover, the flux densities are low enough that they do not significantly contribute to the bolometric luminosity or temperature calculations. The 850 µm data for L1165-SMM1 are from Visser et al. (2002), the 25 µm 60 µm and 100 µm points are from IRAS (Neugebauer et al., 1984), and the 12 µm and 22 µm data are from the WISE survey (Wright et al., 2010); the additional data are described in the following subsections.
A.1 Near-infrared Data
A.2 Spitzer Data
The Spitzer observations and reduction for L1165-SMM1 were presented in Tobin et al. (2010b). The IRAC data cover 4 near/mid-infrared bands: 3.6 µm, 4.5 µm, 5.8 µm, and 8.0 µm. We performed photometry on the IRAC data in 10000 AU apertures (33.3″) and applied the extended source aperture corrections555http://irsa.ipac.caltech.edu/data/SPITZER/docs/irac/iracinstrumenthandbook/30/. The MIPS data at 24 µm and 70 µm are taken from the Cores-to-Disks Legacy program data delivery and photometry were taken in aperture radii outside the first airy ring and the requisite aperture corrections were applied666http://irsa.ipac.caltech.edu/data/SPITZER/docs/mips/mipsinstrumenthandbook/home/.
A.3 Herschel Data
The L1165 dark cloud was observed with the Herschel PACS and SPIRE photometers on 2011 May 05 and 2011 July 11; observation ids are 1342223967, 1342223968, and 1342219969. The PACS and SPIRE maps were generated using the Scanamorphos software version 20 with the galactic option. The SPIRE level 1 data were processed directly by Scanamorphos and the PACS data were converted to Scanamorphos format using the convertL1Scanam procedure in HIPE version 10. These reductions made use of PACS calibration version 45 and SPIRE calibration version 10.1. The maps of the five Herschel bands are shown in Figure 12. The PACS photometry were taken in 12″ apertures at 70 µm and 100 µm and a 22″ aperture at 160 µm as recommended by the PACS calibration documentation777http://herschel.esac.esa.int/twiki/bin/view/Public/PacsCalibrationWeb. SPIRE photometry were taken in 22″, 30″, and 42″ radii in the 250 µm, 350 µm, and 500 µm bands respectively with the requisite aperture corrections for extended sources and color corrections applied888’http://herschel.esac.esa.int/hcss-doc-9.0/load/spire_drg/html/ch05s07.html’. The uncertainty in the absolute flux scale for SPIRE and PACS is estimated to be 5%. The SED plot for L1165-SMM1 is shown in Figure 13.
Appendix B L1157 Photometry
We have also collected the relevant photometry to construct a full SED of L1157. The Spitzer IRAC and MIPS data are from Kirk et al. (2009) and the 450 µm and 850 µm data are from Young et al. (2006). We also include 60 µm, 100 µm, 160 µm and 200 µm data from the Infrared Space Observatory (Froebrich, 2005). The SED plots for L1157-mm is shown in Figure 13.
Appendix C Bolometric Temperature
The bolometric temperature is a standard observational diagnostic for young stellar objects to determine their observational class, complementing the spectral index and submillimeter luminosity diagnostics. The bolometric temperature is defined as the temperature of a blackbody having the same average frequency. Myers & Ladd (1993) calculate the average frequency
| (C1) |
where is the observed flux density at a given frequency and then the bolometric temperature
| (C2) |
Chen et al. (1995) then defined approximate Class boundaries at 70 K for Class 0 to Class I, 650 K for Class I to Class II, and 2800 K for Class II to Class III.
To calculate the integrals in equation C1, we use the trapezoidal integration routine tsum, found in the IDL Astronomy Library (Landsman, 1993). We calculate = 40 K, = 4.3 , and / = 0.018 for L1157; for L1165, = 78 K, =15.6 , and / = 0.012.
References
- Allen et al. (2003) Allen, A., Li, Z., & Shu, F. H. 2003, ApJ, 599, 363
- Andre et al. (1993) Andre, P., Ward-Thompson, D., & Barsony, M. 1993, ApJ, 406, 122
- Andrews & Williams (2005) Andrews, S. M., & Williams, J. P. 2005, ApJ, 631, 1134
- Andrews et al. (2009) Andrews, S. M., Wilner, D. J., Hughes, A. M., Qi, C., & Dullemond, C. P. 2009, ApJ, 700, 1502
- Andrews et al. (2010) —. 2010, ApJ, 723, 1241
- Anglada (1995) Anglada, G. 1995, in Revista Mexicana de Astronomia y Astrofisica, vol. 27, Vol. 1, Revista Mexicana de Astronomia y Astrofisica Conference Series, ed. S. Lizano & J. M. Torrelles, 67
- Anglada et al. (1998) Anglada, G., Villuendas, E., Estalella, R., et al. 1998, AJ, 116, 2953
- Arce & Sargent (2006) Arce, H. G., & Sargent, A. I. 2006, ApJ, 646, 1070
- Basu & Mouschovias (1994) Basu, S., & Mouschovias, T. C. 1994, ApJ, 432, 720
- Basu & Vorobyov (2012) Basu, S., & Vorobyov, E. I. 2012, ApJ, 750, 30
- Beckwith et al. (1990) Beckwith, S. V. W., Sargent, A. I., Chini, R. S., & Guesten, R. 1990, AJ, 99, 924
- Birnstiel et al. (2010) Birnstiel, T., Dullemond, C. P., & Brauer, F. 2010, A&A, 513, A79
- Boss (1995) Boss, A. P. 1995, in Revista Mexicana de Astronomia y Astrofisica Conference Series, Vol. 1, Revista Mexicana de Astronomia y Astrofisica Conference Series, ed. S. Lizano & J. M. Torrelles, 165–+
- Brinch et al. (2007) Brinch, C., Crapsi, A., Jørgensen, J. K., Hogerheijde, M. R., & Hill, T. 2007, A&A, 475, 915
- Burkert & Bodenheimer (1993) Burkert, A., & Bodenheimer, P. 1993, MNRAS, 264, 798
- Cassen & Moosman (1981) Cassen, P., & Moosman, A. 1981, Icarus, 48, 353
- Chen et al. (1995) Chen, H., Myers, P. C., Ladd, E. F., & Wood, D. O. S. 1995, ApJ, 445, 377
- Chen et al. (2007) Chen, X., Launhardt, R., & Henning, T. 2007, ApJ, 669, 1058
- Chen et al. (2013) Chen, X., Arce, H. G., Zhang, Q., et al. 2013, ApJ, 768, 110
- Chiang et al. (2008) Chiang, H., Looney, L. W., Tassis, K., Mundy, L. G., & Mouschovias, T. C. 2008, ApJ, 680, 474
- Chiang et al. (2012) Chiang, H., Looney, L. W., & Tobin, J. J. 2012, ApJ, 709, 470
- Clemens & Barvainis (1988) Clemens, D. P., & Barvainis, R. 1988, ApJS, 68, 257
- Connelley et al. (2008) Connelley, M. S., Reipurth, B., & Tokunaga, A. T. 2008, AJ, 135, 2526
- Covey et al. (2006) Covey, K. R., Greene, T. P., Doppmann, G. W., & Lada, C. J. 2006, AJ, 131, 512
- Dapp & Basu (2010) Dapp, W. B., & Basu, S. 2010, A&A, 521, L56+
- Eisner (2012) Eisner, J. A. 2012, ApJ, 755, 23
- Enoch et al. (2011) Enoch, M. L., Corder, S., Duchêne, G., et al. 2011, ApJS, 195, 21
- Espaillat et al. (2010) Espaillat, C., D’Alessio, P., Hernández, J., et al. 2010, ApJ, 717, 441
- Evans et al. (2009) Evans, N. J., Dunham, M. M., Jørgensen, J. K., et al. 2009, ApJS, 181, 321
- Froebrich (2005) Froebrich, D. 2005, ApJS, 156, 169
- Galli et al. (2006) Galli, D., Lizano, S., Shu, F. H., & Allen, A. 2006, ApJ, 647, 374
- Greene et al. (2008) Greene, T. P., Aspin, C., & Reipurth, B. 2008, AJ, 135, 1421
- Gueth et al. (1996) Gueth, F., Guilloteau, S., & Bachiller, R. 1996, A&A, 307, 891
- Guilloteau et al. (1999) Guilloteau, S., Dutrey, A., & Simon, M. 1999, A&A, 348, 570
- Hara et al. (2013) Hara, C., Shimajiri, Y., Tsukagoshi, T., et al. 2013, ApJ, 771, 128
- Hennebelle & Teyssier (2008) Hennebelle, P., & Teyssier, R. 2008, A&A, 477, 25
- Joos et al. (2012) Joos, M., Hennebelle, P., & Ciardi, A. 2012, A&A, 543, A128
- Jørgensen et al. (2009) Jørgensen, J. K., van Dishoeck, E. F., Visser, R., et al. 2009, A&A, 507, 861
- Kauffmann et al. (2008) Kauffmann, J., Bertoldi, F., Bourke, T. L., Evans, II, N. J., & Lee, C. W. 2008, A&A, 487, 993
- Kirk et al. (2009) Kirk, J. M., Ward-Thompson, D., Di Francesco, J., et al. 2009, ApJS, 185, 198
- Kratter et al. (2010) Kratter, K. M., Matzner, C. D., Krumholz, M. R., & Klein, R. I. 2010, ApJ, 708, 1585
- Kun (1998) Kun, M. 1998, ApJS, 115, 59
- Kun et al. (2009) Kun, M., Balog, Z., Kenyon, S. J., Mamajek, E. E., & Gutermuth, R. A. 2009, ApJS, 185, 451
- Kun et al. (2008) Kun, M., Kiss, Z. T., & Balog, Z. 2008, Star Forming Regions in Cepheus, ed. B. Reipurth, 136
- Kwon et al. (2009) Kwon, W., Looney, L. W., Mundy, L. G., Chiang, H.-F., & Kemball, A. J. 2009, ApJ, 696, 841
- Landsman (1993) Landsman, W. B. 1993, in Astronomical Society of the Pacific Conference Series, Vol. 52, Astronomical Data Analysis Software and Systems II, ed. R. J. Hanisch, R. J. V. Brissenden, & J. Barnes, 246
- Launhardt (2001) Launhardt, R. 2001, in IAU Symposium, Vol. 200, The Formation of Binary Stars, ed. H. Zinnecker & R. Mathieu, 117
- Launhardt et al. (2001) Launhardt, R., Sargent, A., & Zinnecker, H. 2001, in Astronomical Society of the Pacific Conference Series, Vol. 235, Science with the Atacama Large Millimeter Array, ed. A. Wootten, 134–+
- Launhardt & Sargent (2001) Launhardt, R., & Sargent, A. I. 2001, ApJ, 562, L173
- Launhardt et al. (2009) Launhardt, R., Pavlyuchenkov, Y., Gueth, F., et al. 2009, A&A, 494, 147
- Launhardt et al. (2010) Launhardt, R., Nutter, D., Ward-Thompson, D., et al. 2010, ApJS, 188, 139
- Launhardt et al. (2013) Launhardt, R., Stutz, A. M., Schmiedeke, A., et al. 2013, A&A, 551, A98
- Lee et al. (2009) Lee, C., Hirano, N., Palau, A., et al. 2009, ApJ, 699, 1584
- Li et al. (2013) Li, Z.-Y., Krasnopolsky, R., & Shang, H. 2013, ApJ, 774, 82
- Loinard et al. (2002) Loinard, L., Rodríguez, L. F., D’Alessio, P., Wilner, D. J., & Ho, P. T. P. 2002, ApJ, 581, L109
- Lommen et al. (2008) Lommen, D., Jørgensen, J. K., van Dishoeck, E. F., & Crapsi, A. 2008, A&A, 481, 141
- Looney et al. (1997) Looney, L. W., Mundy, L. G., & Welch, W. J. 1997, ApJ, 484, L157+
- Looney et al. (2000) —. 2000, ApJ, 529, 477
- Looney et al. (2007) Looney, L. W., Tobin, J. J., & Kwon, W. 2007, ApJ, 670, L131
- Markwardt (2009) Markwardt, C. B. 2009, in Astronomical Society of the Pacific Conference Series, Vol. 411, Astronomical Data Analysis Software and Systems XVIII, ed. D. A. Bohlender, D. Durand, & P. Dowler, 251–+
- Massi et al. (2008) Massi, F., Codella, C., Brand, J., di Fabrizio, L., & Wouterloot, J. G. A. 2008, A&A, 490, 1079
- Maury et al. (2010) Maury, A. J., André, P., Hennebelle, P., et al. 2010, A&A, 512, A40+
- Mellon & Li (2009) Mellon, R. R., & Li, Z. 2009, ApJ, 698, 922
- Mellon & Li (2008) Mellon, R. R., & Li, Z.-Y. 2008, ApJ, 681, 1356
- Mouschovias (1979) Mouschovias, T. C. 1979, ApJ, 228, 475
- Murillo & Lai (2013) Murillo, N. M., & Lai, S.-P. 2013, ApJ, 764, L15
- Myers & Ladd (1993) Myers, P. C., & Ladd, E. F. 1993, ApJ, 413, L47
- Neugebauer et al. (1984) Neugebauer, G., Habing, H. J., van Duinen, R., et al. 1984, ApJ, 278, L1
- Offner et al. (2010) Offner, S. S. R., Kratter, K. M., Matzner, C. D., Krumholz, M. R., & Klein, R. I. 2010, ApJ, 725, 1485
- Ossenkopf & Henning (1994) Ossenkopf, V., & Henning, T. 1994, A&A, 291, 943
- Pech et al. (2010) Pech, G., Loinard, L., Chandler, C. J., et al. 2010, ApJ, 712, 1403
- Pérez et al. (2012) Pérez, L. M., Carpenter, J. M., Chandler, C. J., et al. 2012, ApJ, arXiv:1210.5252
- Raghavan et al. (2010) Raghavan, D., McAlister, H. A., Henry, T. J., et al. 2010, ApJS, 190, 1
- Reipurth (2000) Reipurth, B. 2000, AJ, 120, 3177
- Reipurth & Aspin (1997) Reipurth, B., & Aspin, C. 1997, AJ, 114, 2700
- Reipurth et al. (1997) Reipurth, B., Bally, J., & Devine, D. 1997, AJ, 114, 2708
- Reipurth & Clarke (2001) Reipurth, B., & Clarke, C. 2001, AJ, 122, 432
- Reipurth et al. (2002) Reipurth, B., Rodríguez, L. F., Anglada, G., & Bally, J. 2002, AJ, 124, 1045
- Reipurth et al. (2004) —. 2004, AJ, 127, 1736
- Robitaille et al. (2007) Robitaille, T. P., Whitney, B. A., Indebetouw, R., & Wood, K. 2007, ApJS, 169, 328
- Rodríguez et al. (1998) Rodríguez, L. F., Reipurth, B., Raga, A. C., & Cantó, J. 1998, Rev. Mexicana Astron. Astrofis., 34, 69
- Sault et al. (1995) Sault, R. J., Teuben, P. J., & Wright, M. C. H. 1995, in Astronomical Society of the Pacific Conference Series, Vol. 77, Astronomical Data Analysis Software and Systems IV, ed. R. A. Shaw, H. E. Payne, & J. J. E. Hayes, 433–+
- Shirley et al. (2007) Shirley, Y. L., Claussen, M. J., Bourke, T. L., Young, C. H., & Blake, G. A. 2007, ApJ, 667, 329
- Shirley et al. (2000) Shirley, Y. L., Evans, II, N. J., Rawlings, J. M. C., & Gregersen, E. M. 2000, ApJS, 131, 249
- Stamatellos & Whitworth (2009) Stamatellos, D., & Whitworth, A. P. 2009, MNRAS, 392, 413
- Stephens et al. (2013) Stephens, I. W., Looney, L. W., Kwon, W., et al. 2013, ApJ, 769, L15
- Sterzik et al. (2003) Sterzik, M. F., Durisen, R. H., & Zinnecker, H. 2003, A&A, 411, 91
- Straizys et al. (1992) Straizys, V., Cernis, K., Kazlauskas, A., & Meistas, E. 1992, Baltic Astronomy, 1, 149
- Takakuwa et al. (2012) Takakuwa, S., Saito, M., Lim, J., et al. 2012, ApJ, 754, 52
- Tanner & Arce (2011) Tanner, J. D., & Arce, H. G. 2011, ApJ, 726, 40
- Terebey et al. (1984) Terebey, S., Shu, F. H., & Cassen, P. 1984, ApJ, 286, 529
- Tobin et al. (2008) Tobin, J. J., Hartmann, L., Calvet, N., & D’Alessio, P. 2008, ApJ, 679, 1364
- Tobin et al. (2012) Tobin, J. J., Hartmann, L., Chiang, H.-F., et al. 2012, Nature, 492, 83
- Tobin et al. (2010a) Tobin, J. J., Hartmann, L., & Loinard, L. 2010a, ApJ, 722, L12
- Tobin et al. (2010b) Tobin, J. J., Hartmann, L., Looney, L. W., & Chiang, H. 2010b, ApJ, 712, 1010
- Tobin et al. (2011) Tobin, J. J., Hartmann, L., Chiang, H.-F., et al. 2011, ApJ, 740, 45
- Tobin et al. (2013) Tobin, J. J., Bergin, E. A., Hartmann, L., et al. 2013, ApJ, 765, 18
- Tohline (2002) Tohline, J. E. 2002, ARA&A, 40, 349
- Ulrich (1976) Ulrich, R. K. 1976, ApJ, 210, 377
- Viotti (1969) Viotti, R. 1969, Mem. Soc. Astron. Italiana, 40, 75
- Visser et al. (2002) Visser, A. E., Richer, J. S., & Chandler, C. J. 2002, AJ, 124, 2756
- Vorobyov (2010) Vorobyov, E. I. 2010, ApJ, 723, 1294
- Weidenschilling (1977) Weidenschilling, S. J. 1977, MNRAS, 180, 57
- Wright et al. (2010) Wright, E. L., Eisenhardt, P. R. M., Mainzer, A. K., et al. 2010, AJ, 140, 1868
- Yorke & Bodenheimer (1999) Yorke, H. W., & Bodenheimer, P. 1999, ApJ, 525, 330
- Young et al. (2006) Young, K. E., Enoch, M. L., Evans, II, N. J., et al. 2006, ApJ, 644, 326
- Yun (1996) Yun, J. L. 1996, AJ, 111, 930
- Zapata et al. (2013) Zapata, L. A., Loinard, L., Rodríguez, L. F., et al. 2013, ApJ, 764, L14
- Zhao & Li (2013) Zhao, B., & Li, Z.-Y. 2013, ApJ, 763, 7
- Zhu et al. (2012) Zhu, Z., Hartmann, L., Nelson, R. P., & Gammie, C. F. 2012, ApJ, 746, 110
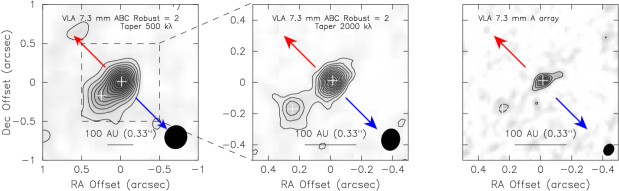
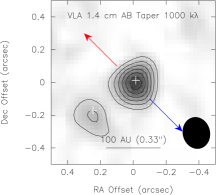
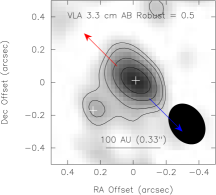
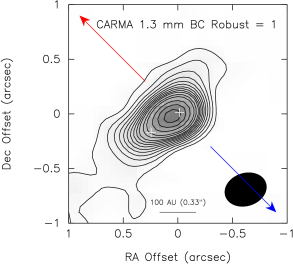
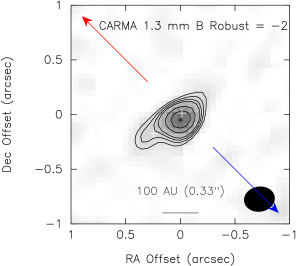
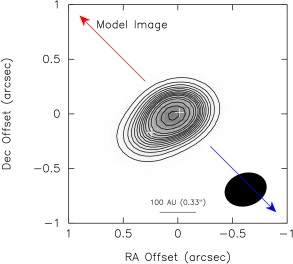
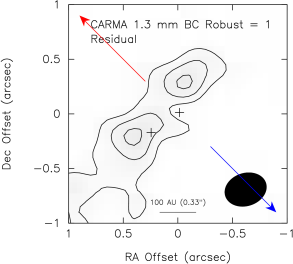
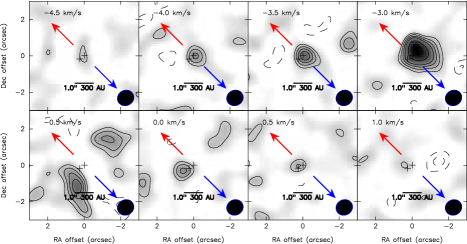
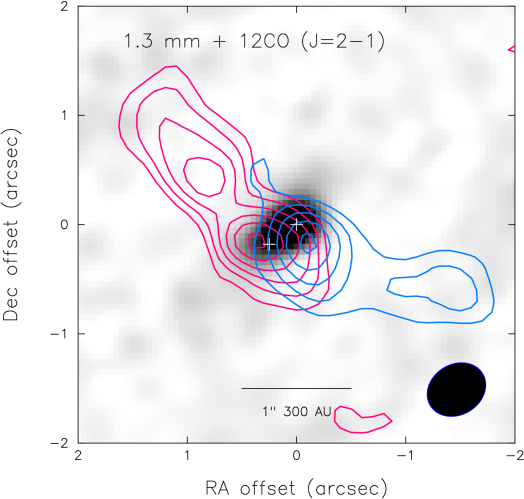
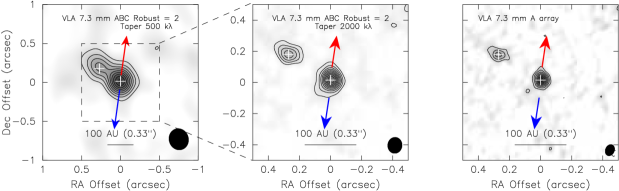
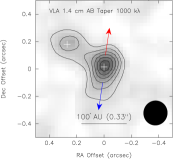
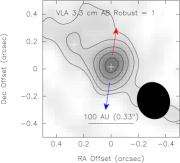
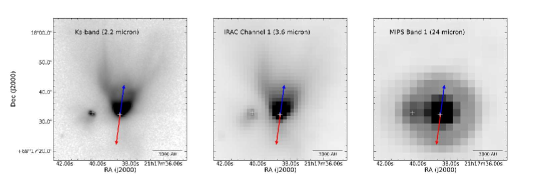
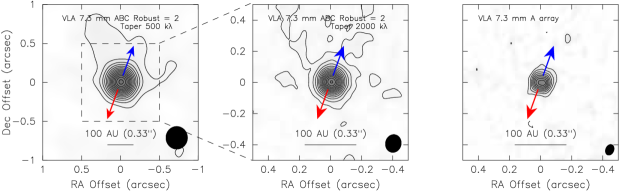
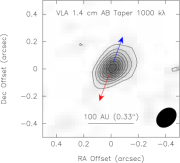
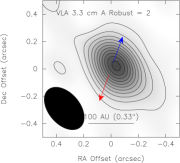


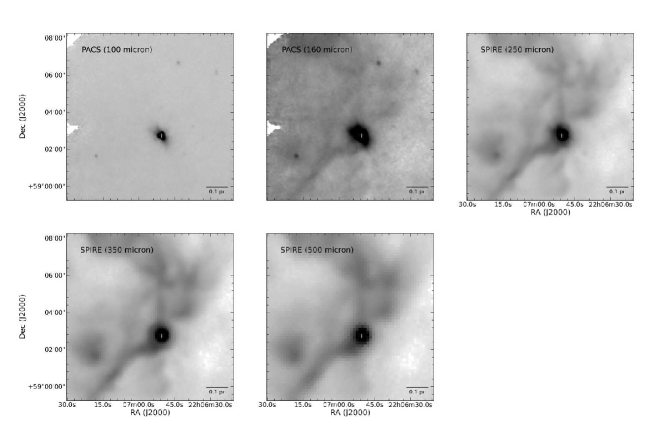


| Source | RA | Dec | Distance | Mass8μm††Mass measured using the envelope extinction of the 8 µm background emission in Tobin et al. (2010b). | Masssubmm**Mass was computed with sub/millimeter bolometer data assuming an isothermal temperature. | Lbol | Lsubmm/Lbol | Tbol | Outflow PA | References |
|---|---|---|---|---|---|---|---|---|---|---|
| (J2000) | (J2000) | (pc) | () | () | () | (K) | (°) | (Distance, Mref, | ||
| (r0.05pc) | Outflow PA) | |||||||||
| CB230 IRS1 | 21:17:38.56 | +68:17:33.3 | 300 | 1.1 | 1.1 | 5.85 | 0.037 | 230 | 350 | 5, 6, 8 |
| L1157-mm | 20:39:06.25 | +68:02:15.9 | 300 | 2.6 | 2.2 | 4.3 | 0.018 | 40 | 150 | 5, 4, 7 |
| L1165-SMM1 | 22:06:50.46 | +59:02:45.9 | 300 | 1.1 | 0.32 | 15.6 | 0.012 | 78 | 225 | 5, 2, 2 |
Note. — Positions reflect the coordinates of the brightest source in the 7.3 mm continuum continuum position for protostars observed with the VLA. Lbol, Tbol, and Lsubmm/Lbol for L1165 and L1157 were recalculated in our work based on compiled photometry from the literature and archival data. Lbol for CB230 is rescaled to a distance of 300 pc from the 400 pc used in Launhardt et al. (2013) where they give Lbol = 10.4 L☉. The Outflow position axes (PA) are not well constrained since the outflows are known to precess they can have fairly large angular width; a conservative estimate of uncertainty would be 10°. References: (1) Froebrich (2005), (2) Visser et al. (2002), (4) Shirley et al. (2000), (5) Kirk et al. (2009), (6) Kauffmann et al. (2008), (7) Gueth et al. (1996), (8) Launhardt et al. (2001).
| Sources | Config. | Date | Track Length | Central Frequency(s) | Gain Calibrator/Flux Density | Flux Calibrator |
|---|---|---|---|---|---|---|
| (UT) | (hrs) | (GHz) | (Name, Jy) | |||
| L1157 | C-array | 26 Feb 1996 | 1.25 | 4.86, 8.46 | 2021+614, 3.1, 2.9 | 3C48 |
| L1165, L1157, CB230††Incorrect coordinates were used for CB230 IRS1 and the source was at the edge of the primary beam, these data are not used in analysis. | C-array | 12 Feb 2012 | 4 | 41 | J2022+6136, 1.6 | 3C48**Scans for the flux calibrator were missing from this observation and the flux density from the 19 Feb track was assumed. |
| L1165, L1157, CB230aaThis track had very high phase variance; however, we were able to use the calibrator data to determine the flux density for application to the 12 Feb track. | C-array | 19 Feb 2012 | 1.5 | 41 | J2022+6136, 1.6 | 3C48 |
| L1165, L1157, CB230 | C-array | 12 Mar 2012 | 1.5 | 41 | J2022+6136, 1.35 | 3C48 |
| CB230bbProblems with pointing caused the first 2 hours of the data to be unusable. | B-array | 04 Jun 2012 | 3 | 9, 21, 41 | J2009+7229, 0.75, 0.65, 0.74 | 3C48 |
| L1157 | B-array | 07 Jun 2012 | 3 | 9, 21, 41 | J2006+6424, 0.7, 0.56, 0.51 | 3C48 |
| L1165 | B-array | 11 Jun 2012 | 3 | 9, 21, 41 | J2022+6136, 3.0, 1.9, 1.1 | 3C48 |
| L1157 | A-array | 07 Oct 2012 | 1 | 9 | J2006+6424, 0.47 | 3C286 |
| CB230 | A-array | 11 Oct 2012 | 1 | 9 | J2009+7229, 0.77 | 3C286 |
| L1165 | A-array | 11 Oct 2012 | 1 | 9 | J2022+6136, 3.0 | 3C48 |
| CB230 | A-array | 02 Nov 2012 | 1 | 9 | J2009+7229, 0.82 | 3C48 |
| L1165 | A-array | 03 Oct 2012 | 1 | 21 | J2022+6136, 1.96 | 3C48 |
| L1157 | A-array | 08 Oct 2012 | 1 | 21 | J2006+6424, 0.47 | 3C48 |
| CB230 | A-array | 09 Oct 2012 | 1 | 21 | J2009+7229, 0.74 | 3C48 |
| L1165 | A-array | 02 Nov 2012 | 1 | 21 | J2022+6136, 2.01 | 3C48 |
| CB230 | A-array | 07 Dec 2012 | 1 | 21 | J2009+7229, 0.81 | 3C48 |
| L1165 | A-array | 13 Oct 2012 | 1 | 41 | J2022+6136, 0.86 | 3C48 |
| L1165 | A-array | 15 Oct 2012 | 1 | 41 | J2022+6136, 0.91 | 3C48 |
| L1165 | A-array | 15 Oct 2012 | 1 | 41 | J2022+6136, 0.91 | 3C48 |
| L1157 | A-array | 03 Nov 2012 | 1 | 41 | J2006+6424, 0.51 | 3C48 |
| L1157 | A-array | 09 Nov 2012 | 1 | 41 | J2006+6424, 0.44 | 3C48 |
| L1157 | A-array | 14 Nov 2012 | 1 | 41 | J2006+6424, 0.42 | 3C48 |
| L1157 | A-array | 20 Nov 2012 | 1 | 41 | J2006+6424, 0.42 | 3C48 |
| L1157 | A-array | 20 Nov 2012 | 1 | 41 | J2006+6424, 0.42 | 3C48 |
| CB230 | A-array | 28 Nov 2012 | 1 | 41 | J2009+7229, 0.69 | 3C48 |
| CB230 | A-array | 30 Nov 2012 | 1 | 41 | J2009+7229, 0.7 | 3C286 |
| CB230 | A-array | 02 Dec 2012 | 1 | 41 | J2009+7229, 0.7 | 3C48 |
| CB230 | A-array | 05 Dec 2012 | 1 | 41 | J2009+7229, 0.74 | 3C48 |
| CB230 | A-array | 05 Dec 2012 | 1 | 41 | J2009+7229, 0.75 | 3C48 |
| CB230, L1165 | C-array | 07 Jul 2013 | 1.75 | 4.5, 7.4 | J2148+6107, 1.2 | 3C48 |
Note. — We observed in fast-switching mode for the B and A configuration data and due to non-optimal calibrator separations, our on-source efficiency was generally 20-25%; our efficiency was 50% in C configuration. The B and C configuration data were from the VLA project 12A-082 and the A configuration data were from 12B-211.
| Sources | Config. | Date | Track Length | Central Frequency(s) | Gain Calibrator/Flux Density | Flux Calibrator | |
|---|---|---|---|---|---|---|---|
| (UT) | (hrs) | (GHz) | (nepers) | (Name, Jy) | |||
| L1165 | C-array | 9 Dec 2012 | 4 | 225.0491 | 0.3 | 3C418, 1.0 | Neptune |
| L1165 | B-array | 18 Jan 2013 | 8 | 225.0491 | 0.07 | 3C418, 1.0 | MWC349 |
| L1165 | B-array | 19 Jan 2013 | 4.25 | 225.0491 | 0.06 | 3C418, 1.0 | Neptune |
| CB230 | C-array | 8 Jan 2013 | 4 | 90.9027 | 0.35 | 1927+739, 3.7 | MWC349 |
| CB230 | C-array | 27 May 2013 | 4.25 | 90.9027 | 0.25 | 1927+739, 4.4 | MWC349 |
| CB230 | C-array | 28 May 2013 | 4.5 | 90.9027 | 0.4 | 1927+739, 4.1 | Neptune |
| CB230 | C-array | 29 May 2013 | 6.0 | 90.9027 | 0.65 | 1927+739, 4.2 | MWC349 |
| Wavelength | Configuration(s) | Integrated Flux | Peak Flux | Aperture | Gaussian Size | Gaussian PA | Deconvolved Size | Deconvolved PA | Robust | Taper | Beam | Beam PA |
|---|---|---|---|---|---|---|---|---|---|---|---|---|
| (mm) | (mJy) | (mJy) | (″) | (″) | (°) | (″) | (°) | (k) | (″) | (°) | ||
| Total | ||||||||||||
| 1.3 | BC | 82.33 | 52.81 | 0.9 0.9 | 0.551 0.331 | -55.1 | 0.40 0.12 | -48.4 | 1 | none | 0.39 0.30 | -72.0 |
| 1.3 | B | 69.911 | 44.53 | 0.9 0.9 | 0.443 0.266 | -55.5 | 0.35 0.12 | -0.1 | -2 | none | 0.28 0.23 | -80.9 |
| 3.4 | CD | 13.30.8 | 10.30.3 | 10 10 | 3.89 2.93 | -85.6 | 1.81 0.990 | 85.6 | 2 | none | 3.45 2.74 | -81.0 |
| 7.3 | A | 0.90.1 | 0.340.03 | 0.4 0.25 | … | … | … | … | 2 | none | 0.072 0.057 | -32.2 |
| 7.3 | ABC | 1.40.1 | 0.450.02 | 0.4 0.25 | … | … | … | … | 2 | none | 0.089 0.074 | -30.2 |
| 7.3 | ABC | 1.70.2 | 0.510.02 | 0.4 0.25 | … | … | … | … | 2 | 2000 | 0.13 0.11 | -12.0 |
| 7.3 | ABC | 1.40.1 | 0.710.03 | 0.9 0.9 | 0.46 0.31 | 135.9 | 0.35 0.12 | 134.3 | 2 | 500 | 0.30 0.29 | -22.2 |
| 14 | AB | 0.350.02 | 0.210.01 | 0.9 0.9 | … | … | … | … | 2 | 1000 | 0.19 0.16 | 13.7 |
| 33 | AB | 0.250.01 | 0.090.01 | 0.9 0.9 | … | … | … | … | 0.5 | none | 0.28 0.20 | 30.3 |
| 40 | C | 0.170.02 | 0.140.01 | 6 6 | … | … | … | … | 1 | none | 3.7 2.7 | 1.2 |
| 65 | C | 0.130.03 | 0.110.01 | 10 10 | … | … | … | … | 1 | none | 6.0 4.5 | -178.6 |
| Primary | ||||||||||||
| 1.3 | BC | 59.83 | 44.62 | Gaussian fit | 0.342 0.245 | 135.03.5 | … | … | -2 | none | 0.28 0.23 | -81.0 |
| 7.3 | A | 0.450.2 | 0.340.03 | 0.25 0.25 | 0.13 0.063 | 120.0 | 0.11 0.018 | 116.0 | 2 | none | 0.072 0.057 | -32.2 |
| 7.3 | ABC | 1.00.05 | 0.450.02 | 0.25 0.25 | 0.15 0.096 | 125.5 | 0.12 0.056 | 120.7 | 2 | none | 0.089 0.074 | -30.2 |
| 7.3 | ABC | 0.760.05 | 0.510.02 | 0.25 0.25 | 0.18 0.13 | 140.0 | 0.13 0.048 | 130.1 | 2 | 2000 | 0.13 0.11 | -12.0 |
| 14 | AB | 0.230.03 | 0.180.01 | 0.25 0.25 | 0.21 0.19 | 156.2 | 0.12 0.050 | 130 | 2 | 1000 | 0.19 0.16 | 13.7 |
| 33 | AB | 0.100.01 | 0.090.01 | 0.3 0.3 | 0.33 0.22 | 41.5 | 0.19 0.070 | 56 | 0.5 | none | 0.28 0.20 | 30.3 |
| Secondary | ||||||||||||
| 1.3 | BC | 11.83 | 11.22 | Gaussian fit | 0.298 0.221 | 17315 | … | … | -2 | none | 0.28 0.23 | -81.0 |
| 7.3 | A | 0.170.06 | 0.120.03 | 0.25 0.25 | … | … | … | … | 2 | none | 0.072 0.057 | -32.2 |
| 7.3 | ABC | 0.340.04 | 0.170.02 | 0.25 0.25 | 0.17 0.14 | 127.5 | 0.15 0.11 | 123 | 2 | none | 0.089 0.074 | -30.2 |
| 7.3 | ABC | 0.340.05 | 0.190.02 | 0.25 0.25 | 0.22 0.184 | 151.1 | 0.17 0.14 | 141 | 2 | 2000 | 0.13 0.11 | -12.0 |
| 14 | AB | 0.010.02 | 0.0690.01 | 0.25 0.25 | 0.28 0.21 | 40.1 | 0.21 0.12 | 49.1 | 2 | 1000 | 0.19 0.16 | 13.7 |
| 33 | AB | 0.030.02 | 0.0360.01 | 0.25 0.25 | 0.32 0.235 | 38.5 | … | … | 0.5 | none | 0.28 0.20 | 30.3 |
Note. — Uncertainties on the integrated and peak flux densities are from the flux measurements in the specified apertures, unless ‘Gaussian fit’ is listed in the Aperture column. We do not give uncertainties on the Gaussian fit parameters for the sake of brevity.
| Wavelength | Configuration(s) | Integrated Flux | Peak Flux | Aperture | Gaussian Size | Gaussian PA | Deconvolved Size | Deconvolved PA | Robust | Taper | Beam | Beam PA |
|---|---|---|---|---|---|---|---|---|---|---|---|---|
| (mm) | (mJy) | (mJy) | (″) | (″) | (°) | (″) | (°) | (k) | (″) | (°) | ||
| CB230 IRS1 | ||||||||||||
| 3.4 | C | 13.30.8 | 10.30.3 | 10 10 | 3.89 2.93 | -85.6 | 1.81 0.990 | 85.6 | 2 | none | 3.45 2.74 | -81.0 |
| 7.3 | A | 1.50.2 | 0.420.02 | 0.4 0.25 | … | … | … | … | 2 | none | 0.068 0.051 | -23.9 |
| 7.3 | ABC | 1.80.1 | 0.460.02 | 0.4 0.25 | … | … | … | … | 2 | none | 0.073 0.055 | -21.0 |
| 7.3 | ABC | 1.50.1 | 0.580.03 | 0.4 0.25 | … | … | … | … | 2 | 2000 | 0.097 0.086 | -6.1 |
| 7.3 | ABC | 1.50.1 | 0.790.04 | 0.9 0.9 | 0.55 0.29 | 54.8 | 0.48 0.14 | 56.6 | 2 | 500 | 0.27 0.25 | 17.88 |
| 14 | AB | 0.340.03 | 0.170.01 | 0.9 0.9 | … | … | … | … | 2 | 1000 | 0.18 0.17 | -12.7 |
| 33 | AB | 0.10.02 | 0.0530.01 | 0.5 0.5 | … | … | … | … | 1 | none | 0.27 0.24 | 16.8 |
| 40 | C | 0.0980.02 | 0.0710.01 | 6 6 | … | … | … | … | 1 | none | 4.1 2.7 | -16.2 |
| 65 | C | 0.0640.02 | 0.0640.01 | 8 8 | … | … | … | … | 1 | none | 6.6 4.5 | -15.8 |
| Primary | ||||||||||||
| 7.3 | A | 0.940.1 | 0.420.02 | 0.25 0.25 | 0.09 0.076 | 3.4 | 0.064 0.047 | 335.0 | 2 | none | 0.068 0.051 | -23.9 |
| 7.3 | ABC | 1.10.1 | 0.460.02 | 0.25 0.25 | 0.10 0.086 | 179.3 | 0.074 0.061 | 31 | 2 | none | 0.073 0.055 | -21.0 |
| 7.3 | ABC | 0.950.1 | 0.580.03 | 0.25 0.25 | 0.12 0.11 | 180.0 | 0.075 0.07 | 19 | 2 | 2000 | 0.097 0.086 | -6.1 |
| 14 | AB | 0.260.03 | 0.180.01 | 0.25 0.25 | 0.24 0.20 | 172.9 | 0.16 0.10 | 173.6 | 2 | 1000 | 0.18 0.17 | -12.7 |
| 33 | AB | 0.0540.003 | 0.0530.005 | 0.25 0.25 | 0.28 0.25 | 165.5 | … | … | 1 | none | 0.27 0.24 | 16.8 |
| Secondary | ||||||||||||
| 7.3 | A | 0.460.1 | 0.200.02 | 0.25 0.25 | 0.13 0.07 | 67.0 | 0.12 0.02 | 67 | 2 | none | 0.068 0.051 | -23.9 |
| 7.3 | ABC | 0.630.1 | 0.220.02 | 0.25 0.25 | 0.13 0.08 | 68.4 | 0.12 0.04 | 68.5 | 2 | none | 0.073 0.055 | -21.0 |
| 7.3 | ABC | 0.520.1 | 0.270.03 | 0.25 0.25 | 0.14 0.10 | 66.0 | 0.12 0.03 | 68.7 | 2 | 2000 | 0.097 0.086 | -6.1 |
| 14 | AB | 0.0920.02 | 0.0740.01 | 0.25 0.25 | 0.36 0.19 | 61.2 | 0.31 0.11 | 61.6 | 2 | 1000 | 0.18 0.17 | -12.7 |
| 33 | AB | 0.00930.008 | 0.0180.005 | 0.25 0.25 | … | … | … | … | 1.0 | none | 0.27 0.24 | 16.8 |
| CB230 IRS2 | ||||||||||||
| 3.4 | C | 1.0 | ||||||||||
| 7.3 | ABC | 0.08 | ||||||||||
| 14 | AB | 0.04 | ||||||||||
| 33 | AB | 0.02 | ||||||||||
| 40 | AB | 0.02 | ||||||||||
| 65 | AB | 0.04 |
Note. — Uncertainties on the integrated and peak flux densities are from the flux measurements in the specified apertures, unless ‘Gaussian fit’ is listed in the Aperture column. We do not give uncertainties on the Gaussian fit parameters for the sake of brevity.
| Wavelength | Configuration(s) | Integrated Flux | Peak Flux | Aperture | Gaussian Size | Gaussian PA | Deconvolved Size | Deconvolved PA | Robust | Taper | Beam | Beam PA |
|---|---|---|---|---|---|---|---|---|---|---|---|---|
| (mm) | (mJy) | (mJy) | (″) | (″) | (°) | (″) | (°) | (k) | (″) | (°) | ||
| Total | ||||||||||||
| 1.3 | B | 18130 | 98.51.0 | 1 1 | 0.509 0.37 | 80.8 | 0.35 0.20 | 70.6 | 2 | none | 0.37 0.33 | -83.2 |
| 3.4 | A | 9.01.0 | 6.80.3 | 1 1 | 0.48 0.40 | 75.0 | 0.33 0.171 | 59.9 | 2 | none | 0.39 0.33 | -61.4 |
| 7.3 | A | 1.70.1 | 0.490.02 | 0.3 0.3 | 0.11 0.11 | 130.0 | 0.093 0.083 | 80 | 2 | none | 0.070 0.052 | -23.2 |
| 7.3 | ABC | 2.20.1 | 0.710.02 | 0.3 0.3 | 0.12 0.12 | 78.0 | 0.11 0.082 | 72.0 | 2 | none | 0.073 0.055 | -21.0 |
| 7.3 | ABC | 2.20.1 | 1.00.02 | 0.3 0.3 | 0.15 0.15 | 8.4 | 0.11 0.10 | 56 | 2 | 2000 | 0.11 0.095 | -13.2 |
| 7.3 | ABC | 2.40.1 | 1.70.03 | 0.5 0.5 | 0.35 0.33 | 11.3 | 0.20 0.18 | 31 | 2 | 500 | 0.29 0.28 | 0.7 |
| 14 | AB | 0.540.07 | 0.310.01 | 0.5 0.5 | 0.21 0.14 | 134.1 | 0.12 0.069 | 134.3 | 2 | 1000 | 0.18 0.17 | -12.7 |
| 33 | AB | 0.240.02 | 0.210.01 | 0.5 0.5 | 0.36 0.25 | 35.33 | … | … | 2 | none | 0.36 0.23 | 40.6 |
| 36 | C | 0.210.07 | 0.210.02 | 10 10 | 3.3 2.5 | 164.6 | … | … | 2 | none | 3.5 2.5 | -37.3 |
| 62 | C | 0.180.05 | 0.190.03 | 10 10 | 5.7 4.8 | 130.7 | … | … | 2 | none | 6.6 4.6 | -54.9 |
Note. — Uncertainties on the integrated and peak flux densities are from the flux measurements in the specified apertures, unless ‘Gaussian fit’ is listed in the Aperture column. We do not give uncertainties on the Gaussian fit parameters for the sake of brevity.
| Source | Free-free Slope | F0(free-free) | Thermal Slope | F0(thermal) |
|---|---|---|---|---|
| (mJy) | (mJy) | |||
| CB230 | -0.710.42 | 1.22.0 | -3.30.38 | 890450 |
| L1157 | -0.350.42 | 0.771.2 | -2.60.25 | 27080 |
| L1165 | -0.0130.33 | 0.150.26 | -2.450.13 | 16020 |
Note. — The spectral slopes are defined by the convention Fλ = F where is the spectral slope. The thermal and free-free spectral indicies are derived from simultaneous fitting of the two components.
| Source | Wavelength | Mass | Fraction of | |
|---|---|---|---|---|
| (mm) | () | Free-Free Emission | ||
| CB230 IRS1 A+B | 3.4 | 1.3 0.38 | 0.13 0.008 | 0.038 |
| CB230 IRS1 A+B | 7.3 | ” ” | 0.16 0.01 | 0.19 |
| CB230 IRS1 A+B | 14 | ” ” | 0.18 0.02 | 0.53 |
| CB230 IRS1 A | 7.3 | ” ” | 0.054 0.004 | 0.18 |
| CB230 IRS1 A | 14 | ” ” | 0.075 0.008 | 0.40 |
| CB230 IRS1 B | 7.3 | ” ” | 0.034 0.005 | 0.052 |
| CB230 IRS1 B | 14 | ” ” | 0.036 0.008 | 0.19 |
| L1165-SMM1 A+B | 1.3 | 0.45 0.13 | 0.027 0.001 | 0.002 |
| L1165-SMM1 A+B | 7.3 | ” ” | 0.027 0.002 | 0.10 |
| L1165-SMM1 A+B | 14 | ” ” | 0.022 0.003 | 0.41 |
| L1165-SMM1 A | 1.3 | ” ” | 0.020 0.001 | 0.002 |
| L1165-SMM1 A | 7.3 | ” ” | 0.014 0.0009 | 0.15 |
| L1165-SMM1 A | 14 | ” ” | 0.012 0.0015 | 0.50 |
| L1165-SMM1 B | 1.3 | ” ” | 0.0038 0.0008 | 0.003 |
| L1165-SMM1 B | 7.3 | ” ” | 0.0065 0.001 | 0.10 |
| L1165-SMM1 B | 14 | ” ” | 0.0067 0.002 | 0.33 |
| L1157-mm | 1.3 | 0.6 0.25 | 0.063 0.01 | 0.004 |
| L1157-mm | 3.4 | ” ” | 0.034 0.004 | 0.06 |
| L1157-mm | 7.3 | ” ” | 0.058 0.002 | 0.16 |
| L1157-mm | 14 | ” ” | 0.026 0.004 | 0.65 |
Note. — The calculated masses all assume a dust-to-gas mass ratio of 1:100 and a dust temperature of 30 K. The flux densities used for the total masses at 7.3 mm are derived from the images tapered to 500 k. The uncertainties on the masses are statistical only; the 1.3 mm and 3.4 mm measurements carry an absolute calibration accuracy of 10% - 20% and the 7.3 mm data have a calibration accuracy of 10%. Note that there are additional systematic uncertainties from the fits to the spectral slopes that have not been accounted for.