Weather on the Nearest Brown Dwarfs:
Resolved
Simultaneous Multi-Wavelength Variability Monitoring
of WISE J104915.57-531906.1AB
Abstract
We present two epochs of MPG/ESO 2.2m GROND simultaneous 6-band () photometric monitoring of the closest known L/T transition brown dwarf binary WISE J104915.57-531906.1AB. We report here the first resolved variability monitoring of both the T0.5 and L7.5 components. We obtained 4 hours of focused observations on the night of UT 2013-04-22, as well as 4 hours of defocused (unresolved) observations on the night of UT 2013-04-16. We note a number of robust trends in our light curves. The and light curves appear to be anticorrelated with and for the T0.5 component and in the unresolved lightcurve. In the defocused dataset, appears correlated with and and anticorrelated with and , while in the focused dataset we measure no variability for at the level of our photometric precision, likely due to evolving weather phenomena. In our focused T0.5 component lightcurve, the band lightcurve displays a significant phase offset relative to both and . We argue that the measured phase offsets are correlated with atmospheric pressure probed at each band, as estimated from 1D atmospheric models. We also report low-amplitude variability in and intrinsic to the L7.5 component.
1 Introduction
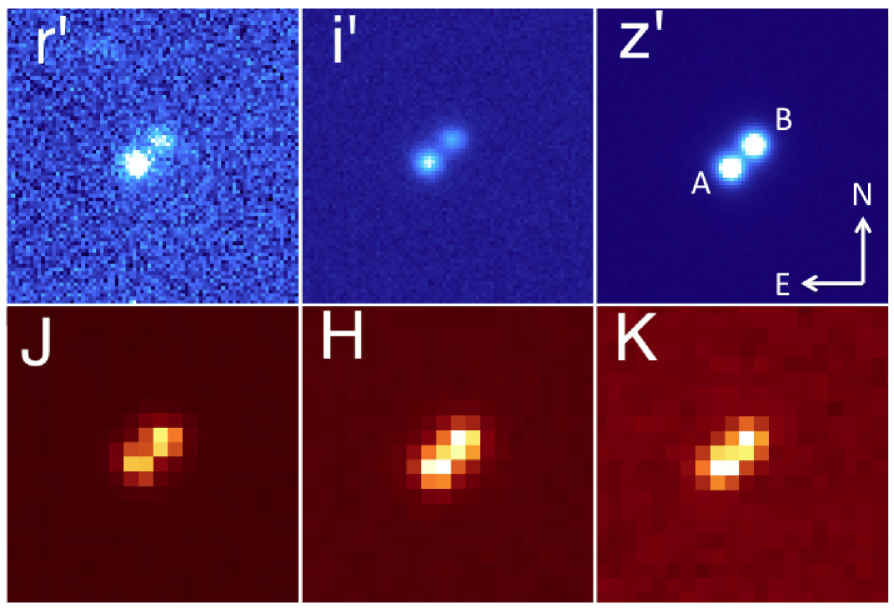
Luhman (2013) recently reported the discovery of WISE J104915.57-531906.1AB (henceforth WISE 1049AB), a brown dwarf binary (1.5”, 3 AU separation) with an L7.5 primary and a T0.5 secondary (Kniazev et al. 2013, Burgasser et al. 2013). WISE 1049AB are the closest and brightest brown dwarfs in the sky (distance of 2.00.15 pc, combined =10.7, 9.6, 8.8), enabling a level of detailed characterization impossible for fainter brown dwarfs.
The L/T transition spectral types of WISE 1049AB make them ideal targets to search for and characterize photometric variability; at these effective temperatures the red dusty clouds found in L dwarf atmospheres are expected to start breaking up (Marley et al. 2010). Time-variability (brightness as a function of rotation angle) is a key diagnostic of cloud properties in brown dwarf atmospheres, probing the spatial distribution of condensates as the brown dwarf rotates. For instance, Artigau et al. (2009) observed correlated variability in the and band (50 mmag amplitude in , 2.4 hour period) for the L/T transition object (spectral type T2.5) SIMP J013656.57+093347.3. This variability is best explained by a mixture of thick and thin patchy iron and silicate clouds covering the surface of this object (Apai et al. 2013). Quasi-periodic variability attributed to clouds has already been observed for a number of L and T type field brown dwarfs (Artigau et al. 2009, Radigan et al. 2012, Buenzli et al. 2012, Heinze et al. 2013), with one object, 2MASS J21392676+0220226, displaying a peak-to-peak variability amplitude of 27% (Radigan et al. 2012). Recent large-scale surveys of brown dwarf variability with Spitzer have revealed mid-IR variability in nearly two dozen L and T type brown dwarfs (Heinze et al. 2013). Buenzli et al. (2013, submitted) find that 30% of the L5-T6 objects surveyed in their HST SNAP survey show variability trends. While variability is observed across the full range of L and T spectral types, L/T transition brown dwarfs often possess higher amplitude variability than earlier L or later T brown dwarfs (Radigan et al. in prep, Metchev et al. 2013).
Gillon et al. (2013) report a detection of 11 maximal peak-to-peak variability at 0.9 m for WISE 1049AB, based on 12 nights of photometric monitoring in an + filter at the TRAPPIST robotic telescope (Jehin et al. 2011). They attribute the measured variability (with 4.870.01 hour period) to the cooler T0.5 component, although the two components are barely resolved in their data. While variability is clearly established for this binary, resolved observations at multiple wavelengths are necessary to characterize the variability and the cloud structure which presumably causes it.
Here we present simultaneous multi-color, broad-band photometric monitoring of WISE 1049AB using GROND at the MPG/ESO 2.2 m. GROND is a unique 7-channel dual optical-IR camera (Greiner et al. 2008), which images simultaneously in an optical camera (four optical bands similar to Sloan , platescale 0.158/pixel) and an IR camera (three near-IR bands , platescale 0.6/pixel). Multi-band monitoring allows instantaneous confirmation of variability across a wide spectral range and provides a rich dataset for further atmospheric characterization of these objects.
2 Observations and Data Reduction
On UT 2013-04-16, we obtained 4 hours on sky of defocused observations (usable coverage of 3.6 hours). Defocused observations are standard in transit observations of exoplanets in order to avoid saturation and maximize photometric precision (e.g. Southworth et al. 2009); because of initial concerns about resolving the binary in the near-IR with GROND’s 0.6” infrared pixels, we attempted a similar strategy for these very bright brown dwarfs, at the expense of resolved lightcurves. On UT 2013-04-22, we obtained 4 hours on sky of focused observations (usable coverage of 3.4 hours). In the focused data, counts in the two brown dwarfs were kept below saturation in all filters. In both cases, no dither pattern was used, in order to place the brown dwarfs reliably on the same pixels and enable high-precision photometry. Optical observations were taken with a base exposure time of 100 s for the defocused observations and 114.9 s for the focused observations. Infrared observations were taken with a base exposure time of 2 s and with 10 coadded exposures between readouts in both datasets. WISE 1049AB was detected in each individual frame in both datasets in . WISE1049AB was detected in in the stacked images in both datasets, but not at a suitable cadence for variability monitoring.
Standard calibrations (bias subtraction, flat-fielding) were performed on both datasets. For the defocused dataset, we performed aperture photometry using the pipeline described in Southworth et al. (2009). In the focused dataset, we resolve the binary in both the optical and near-IR data, although the PSF wings of the two components overlap in the near-IR (see Fig. 1). We extracted resolved psf-fitting photometry using the StarFinder IDL package (Diolaiti et al. 2000). While the optical data was well-sampled, the near-IR data is undersampled with the 0.6” platescale of the GROND IR detector. Nonetheless, with more than 20 resolved sources in the field, we were able to generate an appropriate PSF and obtain reasonable subtractions from our PSF-fitting photometry.
3 Light Curves
3.1 Unresolved combined-light light curves
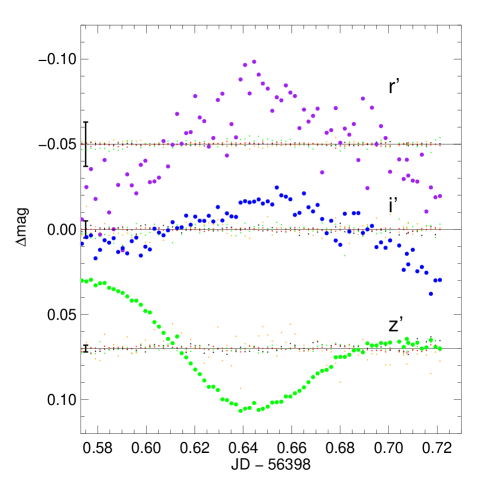
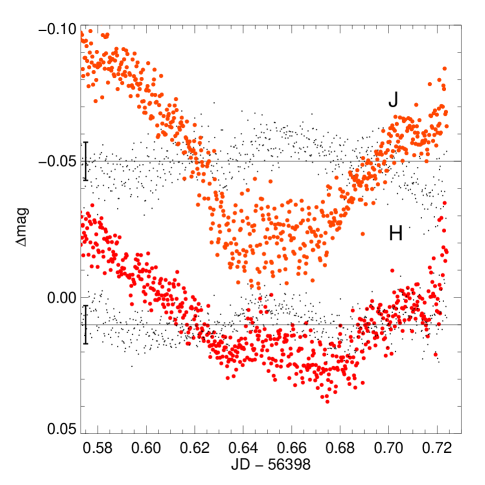
We present optical and near-IR unresolved light curves from UT 2013-04-16 in Fig. 2. For the optical data, the lightcurves of multiple reference stars (10 stars for and , 7 stars for ) were combined to provide a high S/N reference lightcurve and then subtracted from the lightcurve of the brown dwarfs. No significant differences were seen between the lightcurves of the reference stars. We estimate our photometric uncertainty by subtracting a low-order polynomial from each lightcurve to remove smooth trends (both intrinsic variability and instrumental effects) and then calculating the standard deviation of the residuals (which generally follow a gaussian distribution). We find photometric uncertainties of 13 mmag in , 5 mmag in , and 2 mmag in . We estimate peak-to-trough variations over the course of the observation of 64 mmag (6) in , 50 mmag (5) in , and 73 mmag (7) in . The peak in brightness seen at JD56398.65 in and correlates with a dimming at .
For the near-IR data, high S/N reference lightcurves were generated at and by combining 8 reference stars at and 7 reference stars at H. We find photometric uncertainties of 7 mmag in and . We find variability (peak to trough) of 70 mmag (7) in and 43 mmag (4) in . Both and band light curves show dimming at JD56398.65 correlated with the trough seen in brightness at and the peaks seen at and .
We do not report the unresolved band photometry here, as we found significant differences between the light curve shape of reference stars and a very strong upward trend in all the reference stars in the second half of the observation in , which varied considerably from star to star. Thus, we are not confident in our ability to identify true variability of the brown dwarfs with these data.
3.2 Resolved light curves
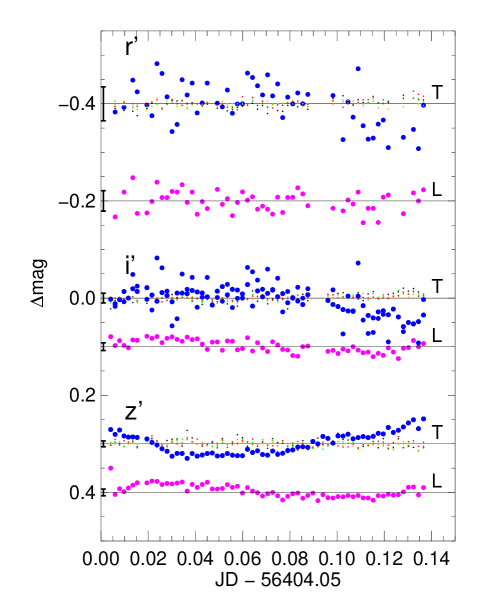
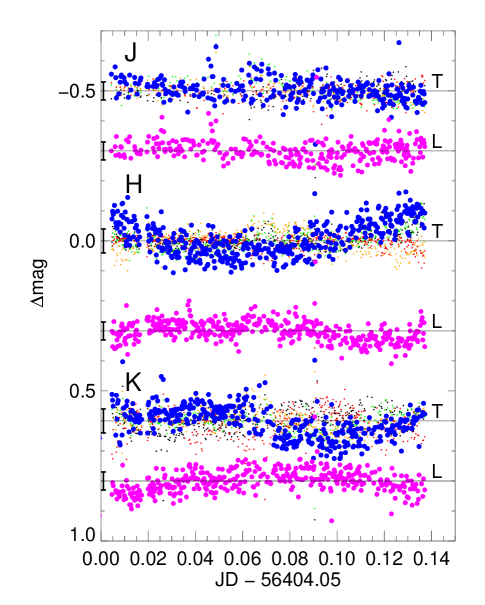
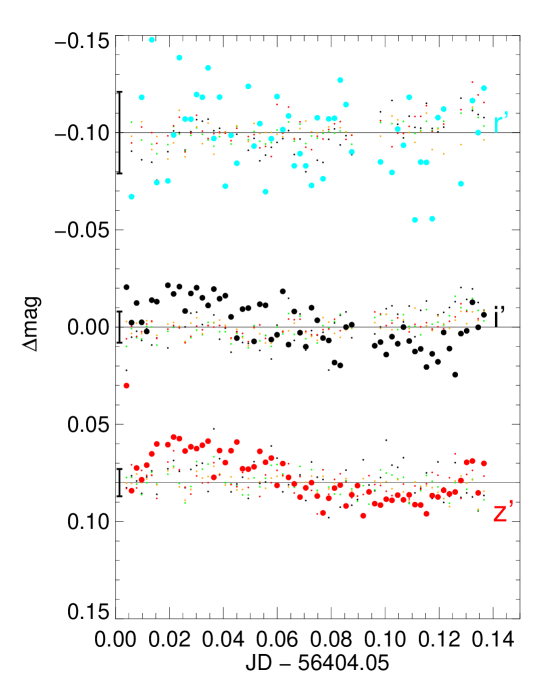
We present optical and near-IR resolved light curves from UT 2013-04-22 in Fig. 3. For the optical bands, high S/N reference lightcurves were constructed by combining lightcurves from 32 reference stars in , 22 reference stars in , and 20 reference stars in . The binary is well-resolved and well-sampled at optical wavelengths. No significant differences were seen between the lightcurves of the reference stars. We estimate our per-point photometric uncertainties as described in Section 3.1. For the T0.5 component, we measure photometric uncertainties of 35 mmag in , 10 mmag in , and 6 mmag in . We estimate variability (peak to trough) of 90 mmag (9) in , 60 mmag (6) in , and 70 mmag (7) in . As in the unfocused data, brightening in and appears to correlate with dimming in (and vice versa).
While the T0.5 component dominates the combined variability, the L7.5 component exhibits variability with a smaller amplitude. Importantly, the L7.5 component’s variations are uncorrelated with the variations seen in the T0.5 component. A zoom-in on the optical lightcurves of the L7.5 component is presented in Fig. 4. For this component, we find photometric uncertainties of 21 mmag in , 8 mmag in , and 7 mmag in . We find variability (peak to trough) of 26 mmag (2) in and and 29 mmag (3) in . No variability was detected in above the levels of our photometric uncertainties. The variability appears quasi-sinusoidal at this epoch, with a period of 3-4 hours, but further monitoring is necessary to confirm this and to accurately determine any rotation period.
Using the Bayesian time-series analysis method of Bailer-Jones (2012), we find that a single component sinusoidal model about the mean which includes a variable Gaussian noise component yields a significantly higher Bayes factor for both the and T0.5 component lightcurves as well as for the L7.5 component lightcurve than does a variable Gaussian noise model about the mean. However, while periodic variability has been observed for these brown dwarfs, this periodicity is not necessarily sinusoidal. This result does nonetheless add confidence that the observed variability is real and not a result of noise.
For the near-IR data, high S/N reference lightcurves were produced at , , and by combining lightcurves from 4 stars in , 5 stars in , and 4 stars in . Reference stars were chosen to be similarly bright as the target brown dwarfs and to lie as close to the target brown dwarfs as possible. For the T0.5 component, we find photometric uncertainties of 30 mmag in and 40 mmag in and . We measure peak to trough variability of 140 mmag (13) in and 110 mmag (10) in . No variability was detected in above the levels of our photometric uncertainty. As with the defocused light curves, the minimum brightness in is close to a similar minimum in . The band light curve also shows a clear minimum brightness, offset by 0.05 days (1.2 hours) from the band minimum. For the L7.5 component, we estimate a photometric uncertainty of 30 mmag in , , and . No variability was detected in the near-IR for this component above the levels of our photometric uncertainty.
Since the L7.5 component does not vary in the near-IR within our photometric errors, we performed a check of our T0.5 near-IR lightcurves by using the L7.5 lightcurve as our reference lightcurve. The T0.5 component and L7.5 component lie on a similar part of the chip and also possess similar luminosities and colors, thus the L7.5 component should serve as an ideal reference lightcurve for the T0.5 component, provided it itself is not significantly variable. Using the L7.5 as the reference lightcurve, we retrieved similar relative lightcurve shapes and amplitudes in , , and (taking into account the greater noise using a single reference) as we did with the high S/N reference lightcurves.
4 Discussion
4.1 Trends, period, and phase shifts
We note a number of significant trends in these light curves. In both datasets, and light curves appear to be anticorrelated with and for the T0.5 component (which likely dominates the variability in the unresolved lightcurve). In the defocused dataset, appears correlated with and and anticorrelated with and , while in the focused dataset we measure no variability for at the level of our photometric precision, likely due to evolution of weather phenomena between the observations. In our focused T0.5 component lightcurves, the band lightcurve appear to have a significant phase offset relative to both and . To estimate the magnitude of this phase offset, we must first adopt a period for the variability of the T0.5 component.
Gillon et al. (2013) report a variability period of 4.870.01 hours for the system, which they attribute solely to the T0.5 component. We cannot confirm this period but we can confirm that the period of the T0.5 component must be greater than 3.5 hours. In our resolved observations, the L7.5 lightcurves may cover a full period in and over the course of 3.5 hours but this must be confirmed. For the calculation of phase offsets we adopt the period of 4.870.01 hours from Gillon et al. (2013) and assume that the effect of the L7.5 component on the period of the combined defocused lightcurve is small.
For the T0.5 single component lightcurve and the combined-light lightcurve (variability assumed to be dominated by the T0.5 component), we measure phase shifts between bands by fitting low-order polynomials to our lightcurves and finding the time of minima and maxima in JD. Assuming that phase=0 occurs at the extremum of the band, we calculate the phase shift relative to for the other bands. We estimate uncertainties on phase shifts of 0.005 days in the optical and 0.01 days in the near-IR. We assign a phase shift of 180∘ for bands anticorrelated with , assuming periodic variability. The observed anti-correlation implies that the light curves are 180∘ out of phase, but this phase offset must be confirmed in future observations covering more than one full period.
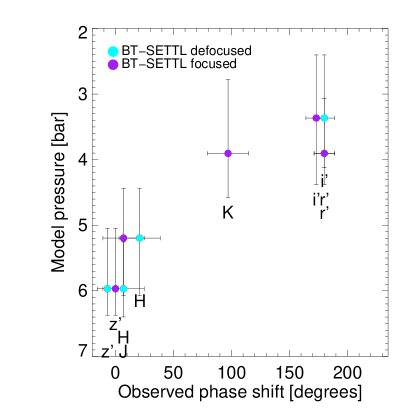
For the T0.5 component, phase shifts cluster around 0∘ in and around 180∘ in , with the band lightcurve displaying a phase shift of 100∘ relative to and (Fig. 5, right panel). While most known variable brown dwarfs display correlated variability across different bands (e.g. Artigau et al. 2009, Radigan et al. 2012), phase shifts between bands have been observed once before in the case of the T6.5 brown dwarf 2MASSJ22282889-431026 (Buenzli et al. 2012), where the phase shift was found to correlate with average model pressure probed at each band.
4.2 Correlation between phase and atmospheric pressure
To evaluate if a correlation between phase and atmospheric pressure holds for WISE 1049B, we use the publicly available BT-Settl 1D atmospheric models (Allard et al. 2012) to estimate the pressure levels probed by the GROND bandpasses. The BT-Settl models utilize a sophisticated cloud model which realistically takes into account the mixing properties of the atmosphere, as determined by 2D radiation hydrodynamic simulations (Freytag et al. 2010). We assume K as suggested by Burgasser et al. (2013), and as expected for an object with tens of Jupiter masses and an age of several-Gyr (e.g., Burrows et al. 2011).
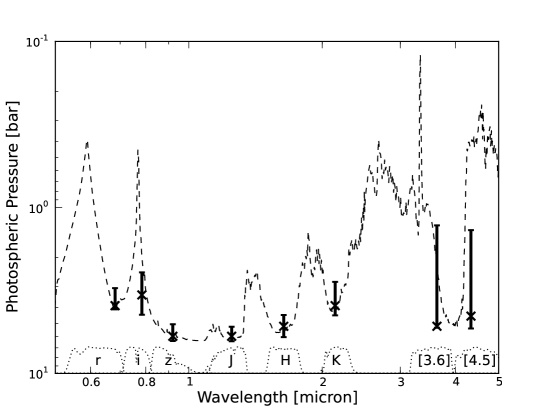
We convert the model surface fluxes into brightness temperatures . We then assign an effective photospheric pressure level to each wavelength using the model’s temperature-pressure profile, which provides a one-to-one correspondence between and . The resulting “pressure spectrum” (Fig. 5) shows that stronger absorption features correspond to deeper photospheric pressure levels. Using the model’s emergent flux density and the product of the telluric and GROND filter transmission profiles, we calculate a mean photospheric pressure for each band and the upper and lower pressure limits within which 80% of that bandpass’ flux is emitted.
The bandpasses probing deepest in the atmosphere are , , and ( bar); the extremum in WISE 1049B’s photometry occurs at nearly the same time (i.e., rotational phase) in these three filters, as they probe roughly the same depth in the atmosphere. We also note that the three filters which probe higher layers of the atmosphere ( bar; in and because of absorption by alkalis, and in because of increasing molecular absorption) all exhibit flux extrema offset from by 100 deg. As plotted in Fig. 5, this result suggests that WISE 1049B exhibits a correlation between atmospheric depth and phase offset similar to that recently seen in the cooler T6.5 brown dwarf 2MASS J22282889-431026 (Buenzli et al. 2012).
Unlike brown dwarfs such as 2MASS J 2139 and SIMP 0136 which display correlated variability across all wavelengths and can be modeled as a combination of two 1D model atmospheres (a combination of thick and patchy clouds, Apai et al. 2013), phase shifts indicate that the vertical and horizontal structure of the atmosphere must also explicitly be taken into account. In particular, 1D models cannot consider the strong effects of rotation on atmospheric structure. Showman and Kaspi (2013) find evidence for large scale (1000 km) atmospheric circulation in three-dimensional, global, anelastic numerical simulations of convection in rapidly rotating brown dwarfs (9 hour period). This produces horizontal temperature variations of up to 50 K as well as significant vertical mixing, driving cloud patterns to evolve on 10-100 rotation period timescales. 2D radiation hydrodynamics simulations by Freytag et al. (2010) show that gravity waves can also play a significant role in forming and dispersing dust clouds in brown dwarf atmospheres, but on somewhat smaller scales. In the case of 2M 2228, Buenzli et al. 2012 suggest a possible “stacked cell” scenario to produce the observed phase shifts, where two convective cells are stacked vertically, one moving upward (ascent) the other downward (subsidence). Subsidence produces heating and inhibits cloud formation while ascent has the opposite effect, cooling and encouraging cloud formation (Buenzli et al. 2012, Showman and Kaspi 2013). A model with two sets of stacked cells, each subtending half of the brown dwarf could then possibly produce phase shifts. In the case of WISE 1049B, we suspect a similar mechanism. The anti-correlated lightcurves may be produced by the combination of patchy cloud layers deeper in the photosphere (driving variability in , , and ) and horizontal temperature differences in the higher layers of the photosphere (producing the , , and variability). These features are perhaps connected by vertical convective motions, i.e the stacked cells suggested by Buenzli et al. (2012), explaining the anticorrelation between , , and , , . Testing this hypothesis will require 1) data at higher spectral resolution – our broadband data still averages over a wide range of pressures and 2) the development of sophisticated 3D brown dwarf circulation models coupled with radiative transfer and cloud formation prescriptions.
5 Conclusions
We present two epochs of simultaneous multi-wavelength variability monitoring of the L/T transition brown dwarf binary WISE 1049AB, spanning from the optical through the near-IR. We note a number of trends in our light curves. The and light curves appear to be anticorrelated with and for the T0.5 component and in the unfocused lightcurve (dominated by the T0.5). In the defocused dataset, appears correlated with and and anticorrelated with and , while in the focused dataset we measure no variability for at the level of our photometric precision. In our focused T0.5 component lightcurve, the band lightcurves appear to have a significant phase offset relative to both and . We also report for the first time low-amplitude variability in and intrinsic to the L7.5 component. We find that the measured phase offsets are correlated with atmospheric pressure probed at each band, as derived from 1D BT-Settl atmospheric models appropriate for this object. However, interpreting these results with 1D models, whether cloudy or clear, is not appropriate, as these models do not take into account rotation or other multi-dimensional effects which drive the atmospheric properties of these objects. The multidimensional models necessary to fully interpret these data are currently under development – these data will be invaluable for testing and validating future and ongoing multi-dimensional modeling of L/T transition brown dwarfs (Allard et al. in prep, Showman and Kaspi 2013).
References
- Allard et al. (2012) Allard, F., Homeier, D., & Freytag, B. 2012, Royal Society of London Philosophical Transactions Series A, 370, 2765
- Apai et al. (2013) Apai, D., Radigan, J., Buenzli, E., et al. 2013, ApJ, 768, 121
- Artigau et al. (2009) Artigau, É., Bouchard, S., Doyon, R., & Lafrenière, D. 2009, ApJ, 701, 1534
- Buenzli et al. (2012) Buenzli, E., Apai, D., Morley, C. V., et al. 2012, ApJ, 760, L31
- Burgasser et al. (2013) Burgasser, A. J., Sheppard, S. S., & Luhman, K. L. 2013, ApJ, 772, 129
- Burrows et al. (2011) Burrows, A., Heng, K., & Nampaisarn, T. 2011, ApJ, 736, 47
- Diolaiti et al. (2000) Diolaiti, E., Bendinelli, O., Bonaccini, D., et al. 2000, A&AS, 147, 335
- Freytag et al. (2010) Freytag, B., Allard, F., Ludwig, H.-G., Homeier, D., & Steffen, M. 2010, A&A, 513, A19
- Gillon et al. (2013) Gillon, M., Triaud, A. H. M. J., Jehin, E., et al. 2013, A&A, 555, L5
- Greiner et al. (2008) Greiner, J., Bornemann, W., Clemens, C., et al. 2008, PASP, 120, 405
- Heinze et al. (2013) Heinze, A. N., Metchev, S., Apai, D., et al. 2013, ApJ, 767, 173
- Jehin et al. (2011) Jehin, E., Gillon, M., Queloz, D., et al. 2011, The Messenger, 145, 2
- Kniazev et al. (2013) Kniazev, A. Y., Vaisanen, P., Mužić, K., et al. 2013, ApJ, 770, 124
- Luhman (2013) Luhman, K. L. 2013, ApJ, 767, L1
- Marley et al. (2010) Marley, M. S., Saumon, D., & Goldblatt, C. 2010, ApJ, 723, L117
- Metchev et al. (2013) Metchev, S., Apai, D., Radigan, J., et al. 2013, Astronomische Nachrichten, 334, 40
- Radigan et al. (2012) Radigan, J., Jayawardhana, R., Lafrenière, D., et al. 2012, ApJ, 750, 105
- Showman & Kaspi (2012) Showman, A. P., & Kaspi, Y. 2012, arXiv:1210.7573
- Southworth et al. (2009) Southworth, J., Hinse, T. C., Jørgensen, U. G., et al. 2009, MNRAS, 396, 1023