Correlation of positive and negative reciprocity fails to confer an evolutionary advantage:
Phase transitions to elementary strategies
Abstract
Economic experiments reveal that humans value cooperation and fairness. Punishing unfair behavior is therefore common, and according to the theory of strong reciprocity, it is also directly related to rewarding cooperative behavior. However, empirical data fail to confirm that positive and negative reciprocity are correlated. Inspired by this disagreement, we determine whether the combined application of reward and punishment is evolutionary advantageous. We study a spatial public goods game, where in addition to the three elementary strategies of defection, rewarding and punishment, a fourth strategy combining the later two competes for space. We find rich dynamical behavior that gives rise to intricate phase diagrams where continuous and discontinuous phase transitions occur in succession. Indirect territorial competition, spontaneous emergence of cyclic dominance, as well as divergent fluctuations of oscillations that terminate in an absorbing phase are observed. Yet despite the high complexity of solutions, the combined strategy can survive only in very narrow and unrealistic parameter regions. Elementary strategies, either in pure or mixed phases, are much more common and likely to prevail. Our results highlight the importance of patterns and structure in human cooperation, which should be considered in future experiments.
pacs:
87.23.Ge, 89.75.FbI Introduction
Humans have mastered the art of cooperation like no other species Nowak and Highfield (2011); Apicella et al. (2012). Regardless of kinship and individual loss, we work together to achieve feats that are impossible to achieve alone. We have developed a very keen sense of fairness to uphold cooperative behavior in our societies Fehr and Schmidt (1999); Henrich et al. (2001), and we frequently punish those that do not cooperate in the pursuit of personal benefits and elevated status Fehr and Gächter (2000); Henrich et al. (2006); Sigmund (2007). There also exist evidence for common marmosets and chimpanzees to show similar preferences regarding altruism and reward division Burkart et al. (2007); Proctor et al. (2013), suggesting a long evolutionary history to the human sense of fairness. Although the origins of this behavior are not fully understood, there exist evidence for between-group conflicts Bowles and Gintis (2011) and the provisioning for someone else’s young Hrdy (2011) as viable for igniting the evolution of remarkable other-regarding abilities of the genus Homo.
Like the origins of cooperative behavior, so too its later development and evolution continue to intrigue and stimulate new research across social and natural sciences Szabó and Fáth (2007); Perc and Szolnoki (2010); Perc et al. (2013); Nowak (2012); Rand and Nowak (2013). Although key mechanisms have been identified that promote the evolution of cooperation Nowak (2006a), there is still disagreement between theory and experiment on many key issues. Two examples have recently attracted notable interest. The first concerns network reciprocity Nowak and May (1992); Hauert and Doebeli (2004); Santos and Pacheco (2005); Fu et al. (2011), according to which cooperators are able to exploit the structure of interaction networks to offset inherent evolutionary disadvantages over defectors. Recent large-scale human experiments, however, fail to provide evidence in support of network reciprocity Gracia-Lázaro et al. (2012a). The second example is of direct relevance for the present work, and it concerns the strong reciprocity model Gintis (2000); Fehr et al. (2002); Boyd et al. (2003); Bowles and Gintis (2004). The later postulates that positive and negative reciprocity are directly correlated. In theory, it indeed seems reasonable to assume that rewarding cooperative behavior and punishing unfair behavior are to be seen as the two sides of the same preference for fairness. Yet recently gathered empirical data suggest otherwise Yamagishi et al. (2012); Egloff et al. (2013). In fact, Yamagishi et al. Yamagishi et al. (2012) have performed a series of experiments and concluded that there is no correlation between the tendencies to reject unfair offers in the ultimatum game Güth et al. (1982) and the tendencies to exhibit prosocial behavior in other games Rand et al. (2009, 2011). Moreover, the analysis of private household data from the Socio-Economic Panel of the German Institute for Economics Research presented by Egloff et al. Egloff et al. (2013) has revealed that positive and negative reciprocity vary independently of each other, thus providing a severe challenge to the strong reciprocity model of the evolution of human cooperation. While the rejection of unfair offers, which ought to be seen equivalent to punishing defection Sigmund et al. (2002), is simply a tacit strategy for avoiding the imposition of an inferior status, the act of cooperating appears to have an altogether different motivational background.
The described disagreement between the strong reciprocity model and empirical data invites an interdisciplinary approach, which promises to shed light on the subject from a different perspective. In the present paper, we therefore apply evolutionary game theory Sigmund (1993); Weibull (1995); Hofbauer and Sigmund (1998); Nowak (2006b); Sigmund (2010) and methods of statistical physics Binder and Hermann (1988); Liggett (1985) to determine whether there are evolutionary advantages to be gained by adopting a strategy that punishes defectors as well as rewards cooperators, as opposed to doing just one or the other. While the elementary strategies of rewarding and punishment have received ample attention in the recent past Hilbe and Sigmund (2010); Sigmund et al. (2010); Rand and Nowak (2011); Hilbe and Traulsen (2012); Perc and Szolnoki (2012); Szolnoki and Perc (2012), little is known about their combined effectiveness. To amend this, we propose and study a modified spatial public goods game Brandt et al. (2003); Szolnoki et al. (2009), where defectors compete with cooperators that punish defectors, reward other cooperators, as well as do both. We intentionally leave out cooperators that neither reward nor punish in order to avoid the second-order free-riding problem Fehr (2004); Fowler (2005), and to thus be able to focus solely on the effectiveness of the combined strategy against the three elementary strategies of defection, rewarding and punishment.
As we will show in what follows, although the spatiotemporal dynamics of the evolutionary game is very complex and interesting from the physics point of view, there exist only narrow and realistically unlikely parameter regions where the combined strategy is able to survive. Given the lack of notable evolutionary advantages of correlating positive and negative reciprocity, the outcome of the experiments by Yamagishi et al. Yamagishi et al. (2012) and Egloff et al. Egloff et al. (2013) can thus be better understood, though the complexity of solutions also lends some support to the strong reciprocity hypothesis as being viable at least under certain special circumstances. We will present compelling evidence to support these conclusions in section III, while in the next section we first describe the studied spatial public goods game and the methods in more detail.
II Public goods game with positive and negative reciprocity
As a frequently used paradigm of social conflicts and human cooperation, the public goods game is staged on a square lattice with periodic boundary conditions where players are arranged into overlapping groups of size such that everyone is connected to its nearest neighbors. Accordingly, each individual belongs to different groups. The square lattice is the simplest of networks that allows us to go beyond the unrealistic well-mixed population assumption, and as such it allows us to take into account the fact that the interactions among humans are inherently structured rather than random. By using the square lattice, we also continue a long-standing history that begun with the work of Nowak and May Nowak and May (1992), who were the first to show that the most striking differences in the outcome of an evolutionary game emerge when the assumption of a well-mixed population is abandoned for the usage of a structured population. Many have since followed the same practice Brandt et al. (2003); Nakamaru and Iwasa (2005); Helbing et al. (2010a) (for a review see Perc et al. (2013)), and there exist ample evidence in support of the claim that, especially for games that are governed by group interactions Szolnoki et al. (2009); Szolnoki and Perc (2011), using the square lattice suffices to reveal all the feasible evolutionary outcomes, and also that these are qualitatively independent of the interaction structure.
Initially each player on site is designated either as a defector (), cooperator that punishes defectors (), cooperator that rewards other cooperators (), or cooperator that both punishes defectors as well as rewards other cooperators () with equal probability. All three cooperative strategies (, and ) contribute a fixed amount (here considered being equal to without loss of generality) to the public good while defectors contribute nothing. The sum of all contributions in each group is multiplied by the synergy factor and the resulting public goods are distributed equally amongst all the group members irrespective of their strategies. In addition, a defector suffers a fine from each punisher ( or ) within the interaction neighborhood, which in turn requires the punisher to bear the cost on each defecting individual in the group. A defector thus suffers the maximal fine if it is surrounded solely by punishers, while a lonely punisher bears the largest cost if it is surrounded solely by defectors. Similarly, every cooperator is given the reward from every and player within the group, while each of them has to bear the cost of rewarding for every cooperator that is rewarded. As a technical comment, we note that the application of payoffs normalized by enables relevant comparisons with the evolutionary outcomes on other interaction networks where players might differ in their degree and group size. Moreover, we use an equally strong fine and reward at the same cost, technically the same pair of values for reward and punishment, which ensures a fair evaluation of the evolutionary advantage of both strategies. By decoupling these parameters, for example by administering high fines and low rewards at the same cost to both punishers and those that reward, would confer an unfair advantage to punishment because it would then be relatively less costly than rewarding. Since giving equal chances for success is of paramount importance for assessing evolutionary viability, we do not decouple and for reward and punishment, and we also award limitless resources to all competing strategies.
In agreement with the described rules of the game, the payoff values of the four competing strategies obtained from each group are thus:
where denotes the number of other players with strategy in the group.
Monte Carlo simulations of the public goods game are carried out comprising the following elementary steps. A randomly selected player plays the public goods game with its partners as a member of all the groups, whereby its overall payoff is thus the sum of all the payoffs acquired in each individual group. Next, player chooses one of its nearest neighbors at random, and the chosen co-player also acquires its payoff in the same way. Finally, player enforces its strategy onto player with a probability given by the Fermi function , where quantifies the uncertainty by strategy adoptions Szolnoki et al. (2009), implying that better performing players are readily adopted, although it is not impossible to adopt the strategy of a player performing worse. Such errors in decision making can be attributed to mistakes and external influences that adversely affect the evaluation of the opponent. Each Monte Carlo step (MCS) gives a chance for every player to enforce its strategy onto one of the neighbors once on average.
The average fractions of defectors (), cooperators that punish (), cooperators that reward (), and cooperators that do both () on the square lattice were determined in the stationary state after a sufficiently long relaxation time. Depending on the actual conditions (proximity to phase transition points and the typical size of emerging spatial patterns), the linear system size was varied from to and the relaxation time was varied from to MCS to ensure that the statistical error is comparable with the line thickness in the figures. We note that the random initial state may not necessarily yield a relaxation to the most stable solution of the game even at such a large system size (). To verify the stability of different solutions, we have therefore applied prepared initial states (see Fig. 10 in Szolnoki et al. (2011a)), and we have followed the same procedure as described previously in Szolnoki et al. (2011b). Next we proceed with presenting the main results.
III Results
Systematic Monte Carlo simulations are performed to reveal phase diagrams for two representative values of the synergy factor . In the absence of reward and punishment, cooperators survive only if , and they are able to defeat defectors completely for Szolnoki et al. (2009). Taking these as benchmark values, we focus on and . For cooperators are able to coexist with defectors without support from additional strategies, solely on the basis of network reciprocity. This can thus be considered as lenient conditions for the evolution of public cooperation. For , on the other hand, cooperators are unable to survive in the absence of reward or punishment, and this are hence adverse conditions for cooperative behavior to prevail. For both values of , we determine the stationary fractions of strategies when varying the reward/fine and the cost . The transition points and the type of phase transitions are identified from Monte Carlo data collected with a sufficiently high accuracy (and frequency) in the close vicinity of the transition points. Finally, the phase boundaries, separating different stable solutions, are plotted in the full phase diagrams. The obtained quantitative results are discussed in detail in the following two subsections.
III.1 Synergy factor
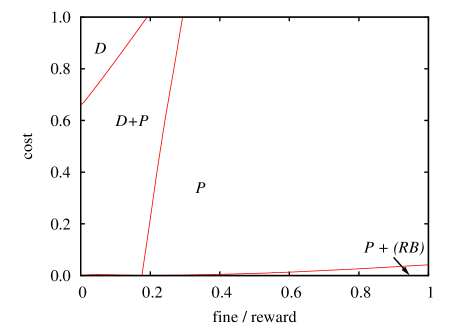
The phase diagram depicted in Fig. 1 suggests that at such a high value of the far more effective action to outperform defectors is punishment rather than rewarding. The pure (or absorbing because the applied dynamical rule leaves the phase unchanged once the system arrives there) phase in the upper left corner of the plane first gives way to the mixed phase, and subsequently to the pure phase as the fine (cost) increases (decreases). Only if the cost is negligible and the fine/reward is large are rewarding strategies able to survive. In this case defectors die out very soon, and from there on strategies and become equivalent since there is nobody left to punish. For the same reason strategy transforms to that of ordinary cooperation. Accordingly, strategies and are able to coexist alongside strategy as long as the cost of rewarding is sufficiently small to offset the second-order free-riding (because do not contribute to rewarding other cooperators). The phase is denoted appropriately as in the lower right corner of Fig. 1.
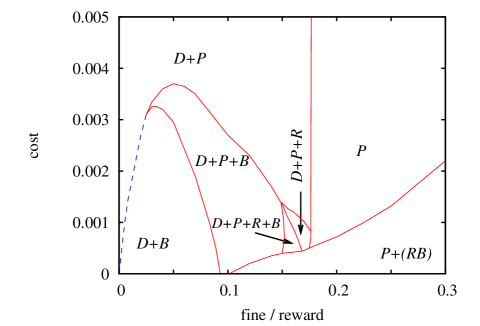
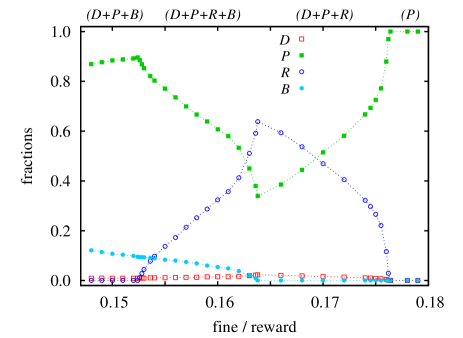
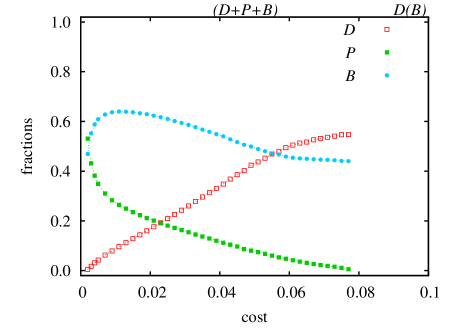
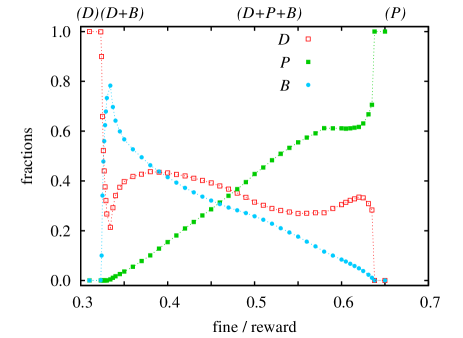
Yet Fig. 1 fails to convey the full story behind the depicted phase diagram. For very low values of ( smaller than ), the studies spatial public goods game reveals its true potential to yield rich dynamical behavior that gives rise to a truly intricate phase diagram. As can be observed in Fig. 2, no less than seven successive phase transitions can occur upon varying a single parameter (increasing at a fixed value of ). In addition to the pure phase, we can observe two-strategy , and (note that here and are equivalent strategies) phases, three strategy and phases, and even the four-strategy phase. While the majority of phase transitions is continuous, the phase transition is discontinuous due to an indirect territorial competition (see Helbing et al. (2010b); Szolnoki and Perc (2013) for further examples of this phenomenon) between strategies and . The two compete independently against the defectors, and the victor is determined by whoever is more effective. The nature of the other phase transitions is illustrated quantitatively in Fig. 3, which shows a cross-section across for the most interesting value of .
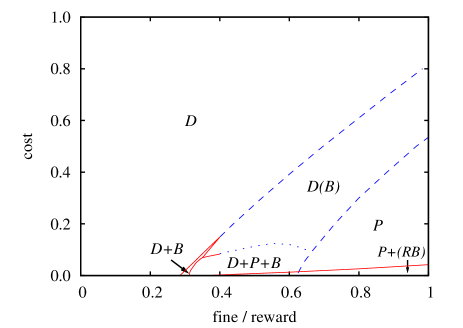
Despite the complexity of solutions, the relevance of the presented results for the main question addressed in this study is quickly revealed. The dashed blue line in Fig. 2, marking the discontinuous phase transition, conveys directly that the combined strategy is more effective than the elementary strategy only if increases [if conditions for rewarding and sanctioning become more lenient (the two actions become less costly)], and this only when the costs are already negligible ( smaller than the administered rewards and fines). Accordingly, we conclude that, at least for high values of the synergy factor , there are no notable evolutionary advantages associated by correlating positive (rewarding) and negative (punishment) reciprocity in a single strategy. This agrees with the empirical data presented by Yamagishi et al. Yamagishi et al. (2012) and Egloff et al. Egloff et al. (2013), who failed to observe the same correlation in human experiments. On the other hand, it should not be overlooked that the combined strategy is viable and that it does convey some advantages (albeit in very narrow and rather unrealistic parameter regions), which thus also lends some support to the strong reciprocity model Fehr et al. (2002).
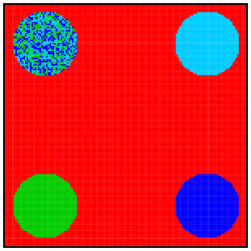
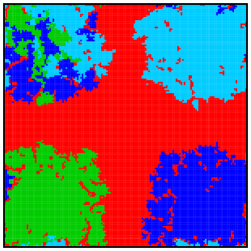
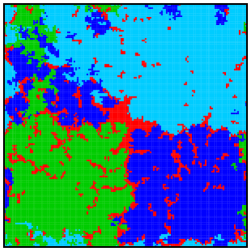
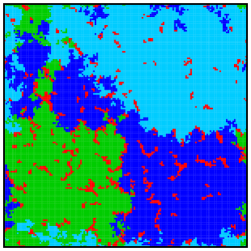
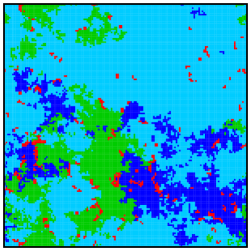
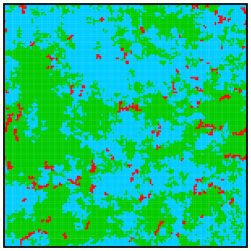
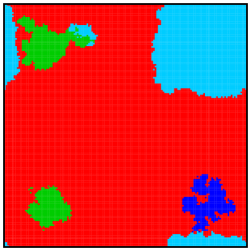
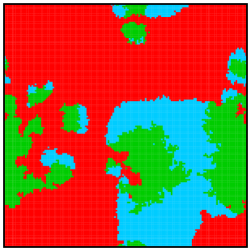
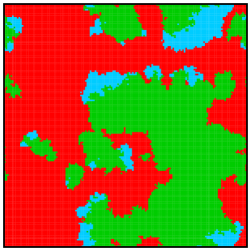
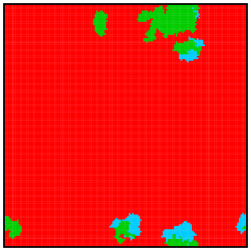
To demonstrate just how the combined strategy may survive, we show in Fig. 4 a series of snapshots from a prepared initial state (applied solely to allow the usage of a relatively small system size), which eventually evolves towards the three-strategy phase. Based on this example, it could be argued that adopting strategy does in fact confer an advantage over strategy , which succumbs to the evolutionary pressure stemming from the three surviving strategies. However, as can be observed at a glance from the depicted phase diagrams presented in Figs. 1 and 2, this is limited to a very narrow and specific parameter range, which is practically invisible at normal resolution (see Fig. 1). In addition, we emphasize that strategy is slightly less effective than strategy (see Fig. 3 for the stationary fractions of the two strategies). Thus, although the combined strategy might appear as a good choice in some of the parameter regions within Fig. 2, it is still second best to the elementary strategy adopting solely punishment.
III.2 Synergy factor
If the conditions for the evolution of public cooperation become harsh, as is the case for , the relations between the competing strategies change quite significantly. The phase diagram presented in Fig. 5 reveals that, besides the expected extension of the pure phase, the parameter region where strategy can survive also becomes larger. Furthermore, there is a significant change in the nature of phase transitions. Unlike at (see Fig. 1), here discontinuous phase transitions dominate, which has to do with the spontaneous emergence of cyclic dominance Reichenbach et al. (2007a, b); Mobilia (2010, 2011) between strategies , and . In particular, within the three-strategy phase strategy outperforms strategy , strategy outperforms strategy , while strategy again outperforms strategy . It is important to note that at the stability of none of the three-strategy phases, and also not of the four-strategy phase, has been due to cyclic dominance. Instead, as Fig. 4 illustrates, there the stability was warranted by the stable coexistence of the strategies, rather than by oscillations that are brought about by cyclic dominance.
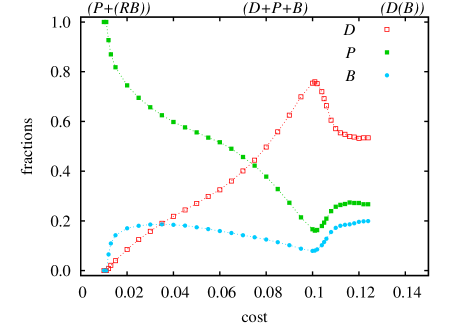
As was frequently the case before Wu et al. (2005); Szolnoki et al. (2011b, a, 2012), here too the spontaneous emergence of cyclic dominance brings with it fascinating dynamical processes that are driven by pattern formation, by means of which the phase may terminate. Figures 6 and 7 feature two characteristic cross-sections of the phase diagram presented in Fig. 5, which reveal two qualitatively very different ways for the cyclic dominance phase to give way to the phase [here indicates that either a pure or a pure phase can be the final state if starting from random initial conditions]. The process depicted in Fig. 6 is relatively straightforward. Here the average fractions of strategies and decay due to the increasing cost , which ultimately results in the vanishing average value of the fraction of strategy . The closed cycle of dominance is therefore interrupted and the phase terminates.
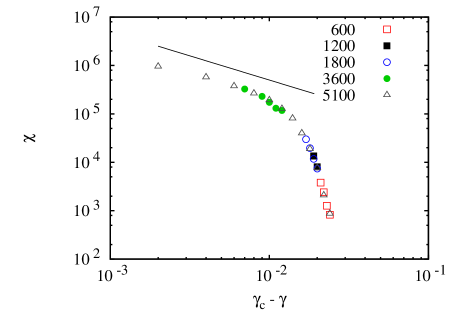

The situation for is much more peculiar and interesting. As results presented in Fig. 7 demonstrate, here the average values of all three strategies remain finite. Hence, the termination of the phase must have a different origin than at presented in Fig. 6. In fact, for it is the amplitude of oscillations that increases with increasing values of . And it is the increase in the amplitude that ultimately results in a uniform absorbing phase regardless of the system size. At this point it is crucial to emphasize that the increase of the amplitude of oscillation is not a finite-size effect. Although in spatial systems with cyclic dominance it is typical to observe oscillations with increasingly smaller amplitude as the system size is increased, this does not hold in the present case. To demonstrate this, we measure the fluctuations in the stationary state according to
| (1) |
where is the average value of the fraction of defectors (a similar quantity can be calculated for the other strategies as well). As Fig. 8 shows, the scaled quantity is size-independent, thus indicating a divergent fluctuation as approaches the critical value. The three-strategy phase is therefore unable to exist beyond this value despite the fact that the average fractions of all three strategies are far from zero. Instead, the phase terminates via a discontinuous phase transition towards the phase, as depicted in Fig. 5. Notably, within the phase either the pure or the pure phase can be the final state, depending on which strategy dies out first.
With this, however, we have not yet covered all the details of the phase diagram presented in Fig. 5. In addition, there are namely the same pure and two-strategy phases observable that we have already reported above for (see Fig. 1), only that at they are shifted further towards higher values of . This is understandable, given that the lesser support for public cooperation due to a lower value of the synergy factor needs to be offset by higher fines and rewards. Moreover, we must not overlook the existence, albeit a very subtle one, of the two-strategy phase, the emergence of which is quantitatively described in the cross-section presented in Fig. 9. This is the only stable solution where solely the combined strategy coexists with defectors, and where thus the correlation of negative and positive reciprocity truly outperforms elementary strategies and . As in all the previously outlined cases, however, in this case too this advantage is minute and limited to a very narrow region in the phase diagram.
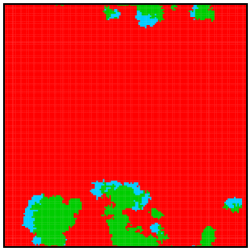
In general, the harsher conditions for the evolution of public cooperation lend more support for the combined strategy to survive, as indeed the regions on the parameter plane where can prevail become quite extensive at smaller values of the synergy factor . This extends the credibility of the strong reciprocity model, and it indicates that, if at all, the evolutionary advantages of correlated positive and negative reciprocity ought to manifest clearer under extreme adversity. In future experiments, it may thus be worthwhile working towards such conditions if the goal is to possibly discern some more actual advantages of correlated reciprocities, and to thus further support the assumptions of the strong reciprocity theory also with empirical data. A warning to end the presentation of results is, however, in order. As the series of final snapshots presented in Fig. 10 clearly demonstrates (and to no lesser extent also the series of snapshots presented in Fig. 4), conditions for pattern formation and complex strategic configurations need to be given for the subtle solutions, here identified by means of extensive and systematic Monte Carlo simulations, to emerge and be stable. Such conditions appear to be very difficult to achieve in experiments with humans, which is why efforts towards large-scale implementations, as recently reported in Gracia-Lázaro et al. (2012b, a), are very encouraging and certainly worth developing further in the future.
IV Discussion
Our goal in the present paper was to determine whether there are evolutionary advantages associated by correlating positive and negative reciprocity in a single strategy, as opposed to adopting solely reward or punishment as an elementary strategy. Systematic Monte Carlo simulations have revealed that, regardless of the synergy factor governing the public goods game, elementary strategies, and punishment in particular, are in general significantly more effective in deterring defection than the combined strategy. Although there exist narrow and rather unrealistic parameter regions where the correlation of positive and negative reciprocity can outperform a particular elementary strategy, these advantages are highly unlikely to play a role in human experiments, and they also frequently come second to the evolutionary success that is warranted by punishment alone under the same conditions. The presented results thus lend support to the empirical data published in Yamagishi et al. (2012); Egloff et al. (2013), which fail to support the central assumption of the strong reciprocity model that negative and positive reciprocity are correlated.
The studied four-strategy spatial public goods game gives rise to fascinating evolutionary outcomes that are separated by continuous and discontinuous phase transitions. We have demonstrated, for example, that indirect territorial competition may lend some credibility to the combined strategy, as the latter is sometimes more effective against the defectors than solely rewarding. In special parameter regions, the combination of positive and negative reciprocity can thus crowd out cooperators that reward other cooperators. Under the same conditions, however, cooperators that punish but do not reward can be more effective still, so overall it is difficult to argue in favor of choosing the combined strategy over an elementary one. Moreover, stationary solutions that are governed by indirect territorial competition terminate suddenly via discontinuous phase transitions, and accordingly, they are difficult to identify and are unlikely to seriously challenge conclusions based on empirical data.
For low synergy factors, we have shown that the spontaneous emergence of cyclic dominance between strategies , and is also a possible solution of the system, and indeed it significantly extends the parameter region where the correlation of positive and negative reciprocity is viable. Within the cyclic phase defectors outperform punishers, punishers outperform the combined strategy, and the combined strategy is able to invade defectors, thereby closing the loop of dominance. In this case, it can again be argued in favor of the combined strategy over solely rewarding, but since the remaining three strategies become spontaneously entailed in a cycle of dominance, the advantage warranted by the correlation of negative and positive reciprocity is indirect and circumstantial at best. Furthermore, we have demonstrated that the cyclic dominance can terminate in very different ways. Either the average fraction of one strategy vanishes, or, more intriguingly, the amplitude of oscillations diverges in a system-size independent manner. Thus, although the average fractions of all three strategies are far from zero, the cyclic dominance phase may end abruptly via a discontinuous phase transition. Although phenomena like indirect territorial competition, cyclic dominance, divergent fluctuations of the amplitude of oscillations, as well as previously reported critical phenomena in evolutionary games Hernández and Zanette (2011), self-organized adaptation Steingrube et al. (2010); Lee et al. (2011) and in-group favoritism Fu et al. (2012), are all of significant interest to physicist, we emphasize that they would likely require massive efforts to be observed in human experiments. Nevertheless, recent large-scale attempts in this direction promise exciting times ahead Gracia-Lázaro et al. (2012b, a).
Lastly, it remains to emphasize that punishment is the elementary strategy that is definitively more effective than the combined strategy, while rewarding is not necessarily so. However, rewarding can be made much more potent if rewards are administered not to all cooperators, but only to those who themselves reward others. In this case, rewarding can completely outperform punishment at low and high values, while the situation reverses only if the costs become relatively high compared to the rewards and fines. Yet in this modified scenario, the act of punishing yields no extra advantages, and in general the strategy can survive only when the strategy can survive too. Therefore, even under such altered, rewarding-friendly conditions, there are still no notable evolutionary advantages to be gained by adopting a strategy that combines both positive and negative reciprocity. With this conclusion, we hope that our study will inspire further research aimed at investigating the role of correlated strategies in evolutionary games, and we also hope that more experimental work will be carried out to clarify their role by the evolution of human cooperation.
Acknowledgements.
This research was supported by the Hungarian National Research Fund (Grant K-101490) and the Slovenian Research Agency (Grant J1-4055).References
- Nowak and Highfield (2011) M. A. Nowak and R. Highfield, SuperCooperators: Altruism, Evolution, and Why We Need Each Other to Succeed (Free Press, New York, 2011).
- Apicella et al. (2012) C. L. Apicella, F. W. Marlowe, J. H. Fowler, and N. A. Christakis, “Social networks and cooperation in hunter-gatherers,” Nature 481, 497–501 (2012).
- Fehr and Schmidt (1999) E. Fehr and K. M. Schmidt, “A theory of fairness, competition, and cooperation,” Quarterly J. Econ. 114, 817–868 (1999).
- Henrich et al. (2001) J. Henrich, R. Boyd, S. Bowles, C. Camerer, E. Fehr, H. Gintis, and R. McElreath, “In Search of Homo Economicus: Behavioral Experiments in 15 Small-Scale Societies,” Am. Econ. Rev. 91, 73–78 (2001).
- Fehr and Gächter (2000) E. Fehr and S. Gächter, “Cooperation and punishment in public goods experiments,” Am. Econ. Rev. 90, 980–994 (2000).
- Henrich et al. (2006) J. Henrich, R. McElreath, A. Barr, J. Ensminger, C. Barrett, A. Bolyanatz, J. C. Cardenas, M. Gurven, E. Gwako, N. Henrich, C. Lesorogol, F. Marlowe, D. Tracer, and J. Ziker, “Costly punishment across human societies,” Science 312, 1767–1770 (2006).
- Sigmund (2007) K. Sigmund, “Punish or perish? Retailation and collaboration among humans,” Trends Ecol. Evol. 22, 593–600 (2007).
- Burkart et al. (2007) J. M. Burkart, E. Fehr, C. Efferson, and C. P. van Schaik, “Other-regarding preferences in a non-human primate: Common marmosets provision food altruistically,” Proc. Natl. Acad. Sci. USA 104, 19762–19766 (2007).
- Proctor et al. (2013) D. Proctor, R. A. Williamson, F. B. M. de Waal, and S. F. Brosnan, “Chimpanzees play the ultimatum game,” Proc. Natl. Acad. Sci. USA 110, 2070–2075 (2013).
- Bowles and Gintis (2011) S. Bowles and H. Gintis, A Cooperative Species: Human Reciprocity and Its Evolution (Princeton University Press, Princeton, NJ, 2011).
- Hrdy (2011) S. B. Hrdy, Mothers and Others: The Evolutionary Origins of Mutual Understanding (Harvard University Press, Cambridge, MA, 2011).
- Szabó and Fáth (2007) G. Szabó and G. Fáth, “Evolutionary games on graphs,” Phys. Rep. 446, 97–216 (2007).
- Perc and Szolnoki (2010) M. Perc and A. Szolnoki, “Coevolutionary games – a mini review,” BioSystems 99, 109–125 (2010).
- Perc et al. (2013) M. Perc, J. Gómez-Gardeñes, A. Szolnoki, and L. M. Floría and Y. Moreno, “Evolutionary dynamics of group interactions on structured populations: A review,” J. R. Soc. Interface 10, 20120997 (2013).
- Nowak (2012) M. A. Nowak, “Evolving cooperation,” J. Theor. Biol. 299, 1–8 (2012).
- Rand and Nowak (2013) D. A. Rand and M. A. Nowak, “Human cooperation,” Trends in Cognitive Sciences 17, 413–425 (2013).
- Nowak (2006a) M. A. Nowak, “Five rules for the evolution of cooperation,” Science 314, 1560–1563 (2006a).
- Nowak and May (1992) M. A. Nowak and R. M. May, “Evolutionary games and spatial chaos,” Nature 359, 826–829 (1992).
- Hauert and Doebeli (2004) C. Hauert and M. Doebeli, “Spatial structure often inhibits the evolution of cooperation in the snowdrift game,” Nature 428, 643–646 (2004).
- Santos and Pacheco (2005) F. C. Santos and J. M. Pacheco, “Scale-Free Networks Provide a Unifying Framework for the Emergence of Cooperation,” Phys. Rev. Lett. 95, 098104 (2005).
- Fu et al. (2011) F. Fu, D. I. Rosenbloom, L. Wang, and M. A. Nowak, “Imitation dynamics of vaccination behaviour on social networks,” Proc. R. Soc. B 278, 42–49 (2011).
- Gracia-Lázaro et al. (2012a) C. Gracia-Lázaro, A. Ferrer, G. Ruiz, A. Tarancón, J. A. Cuesta, A. Sánchez, and Y. Moreno, “Heterogeneous networks do not promote cooperation when humans play a prisoner’s dilemma,” Proc. Natl. Acad. Sci. USA 109, 12922–12926 (2012a).
- Gintis (2000) H. Gintis, “Strong reciprocity and human sociality,” J. Theor. Biol. 206, 169–179 (2000).
- Fehr et al. (2002) E. Fehr, U. Fischbacher, and S. Gächter, “Strong reciprocity, human cooperation and the enforcement of social norms,” Human Nature 13, 1–25 (2002).
- Boyd et al. (2003) R. Boyd, H. Gintis, S. Bowles, and P. J. Richerson, “The evolution of altruistic punishment,” Proc. Natl. Acad. Sci. USA 100, 3531–3535 (2003).
- Bowles and Gintis (2004) S. Bowles and H. Gintis, “The evolution of strong reciprocity: Cooperation in heterogeneous populations,” Theor. Pop. Biol. 65, 17–28 (2004).
- Yamagishi et al. (2012) T. Yamagishi, Y. Horita, Nobuhiro Mifune, H. Hashimoto, Y. Li, M. Shinada, A. Miura, K. Inukai, H. Takagishi, and D. Simunovic, “Rejection of unfair offers in the ultimatum game is no evidence of strong reciprocity,” Proc. Natl. Acad. Sci. USA 109, 20364–20368 (2012).
- Egloff et al. (2013) B. Egloff, D. Richter, and S. C. Schmukle, “Need for conclusive evidence that positive and negative reciprocity are unrelated,” Proc. Natl. Acad. Sci. USA 110, E786 (2013).
- Güth et al. (1982) W. Güth, R. Schmittberger, and B. Schwarze, “An experimental analysis of ultimatum bargaining,” J. Econ. Behav. Org. 3, 367–388 (1982).
- Rand et al. (2009) D. G. Rand, A. Dreber, T. Ellingsen, D. Fudenberg, and M. A. Nowak, “Positive interactions promote public cooperation,” Science 325, 1272–1275 (2009).
- Rand et al. (2011) D. G. Rand, S. Arbesman, and N. A. Christakis, “Dynamic social networks promote cooperation in experiments with humans,” Proc. Natl. Acad. Sci. USA 108, 19193–19198 (2011).
- Sigmund et al. (2002) K. Sigmund, E. Fehr, and M. A. Nowak, “The economics of fair play,” Sci. Am. 286, 82–87 (2002).
- Sigmund (1993) K. Sigmund, Games of Life: Exploration in Ecology, Evolution and Behavior (Oxford University Press, Oxford, UK, 1993).
- Weibull (1995) J. W. Weibull, Evolutionary Game Theory (MIT Press, Cambridge, MA, 1995).
- Hofbauer and Sigmund (1998) J. Hofbauer and K. Sigmund, Evolutionary Games and Population Dynamics (Cambridge University Press, Cambridge, U.K., 1998).
- Nowak (2006b) M. A. Nowak, Evolutionary Dynamics (Harvard University Press, Cambridge, MA, 2006).
- Sigmund (2010) K. Sigmund, The Calculus of Selfishness (Princeton University Press, Princeton, NJ, 2010).
- Binder and Hermann (1988) K. Binder and D. K. Hermann, Monte Carlo Simulations in Statistical Phyisics (Springer, Heidelberg, 1988).
- Liggett (1985) T. M. Liggett, Interacting Particle Systems (Springer, New York, 1985).
- Hilbe and Sigmund (2010) C. Hilbe and K. Sigmund, “Incentives and opportunism: From the carrot to the stick,” Proc. R. Soc. B 277, 2427–2433 (2010).
- Sigmund et al. (2010) K. Sigmund, H. De Silva, A. Traulsen, and C. Hauert, “Social learning promotes institutions for governing the commons,” Nature 466, 861–863 (2010).
- Rand and Nowak (2011) D. G. Rand and M. A. Nowak, “The evolution of antisocial punishment in optional public goods games,” Nat. Commun. 2, 434 (2011).
- Hilbe and Traulsen (2012) C. Hilbe and A. Traulsen, “Emergence of responsible sanctions without second order free riders, antisocial punishment or spite,” Sci. Rep. 2, 458 (2012).
- Perc and Szolnoki (2012) M. Perc and A. Szolnoki, “Self-organization of punishment in structured populations,” New J. Phys. 14, 043013 (2012).
- Szolnoki and Perc (2012) A. Szolnoki and M. Perc, “Evolutionary advantages of adaptive rewarding,” New J. Phys. 14, 093016 (2012).
- Brandt et al. (2003) H. Brandt, C. Hauert, and K. Sigmund, “Punishment and reputation in spatial public goods games,” Proc. R. Soc. B 270, 1099–1104 (2003).
- Szolnoki et al. (2009) A. Szolnoki, M. Perc, and G. Szabó, “Topology-independent impact of noise on cooperation in spatial public goods games,” Phys. Rev. E 80, 056109 (2009).
- Fehr (2004) E. Fehr, “Don’t lose your reputation,” Nature 432, 449–450 (2004).
- Fowler (2005) J. H. Fowler, “Second-order free-riding problem solved?” Nature 437, E8–E8 (2005).
- Nakamaru and Iwasa (2005) M. Nakamaru and Y. Iwasa, “Evolution of altruism by costly punishment in lattice-structured population: Score-dependent viability versus score-dependent fertility,” Evol. Ecol. Res. 7, 853–870 (2005).
- Helbing et al. (2010a) D. Helbing, A. Szolnoki, M. Perc, and G. Szabó, “Punish, but not too hard: How costly punishment spreads in the spatial public goods game,” New J. Phys. 12, 083005 (2010a).
- Szolnoki and Perc (2011) A. Szolnoki and M. Perc, “Group-size effects on the evolution of cooperation in the spatial public goods game,” Phys. Rev. E 84, 047102 (2011).
- Szolnoki et al. (2011a) A. Szolnoki, G. Szabó, and L. Czakó, “Competition of individual and institutional punishments in spatial public goods games,” Phys. Rev. E 84, 046106 (2011a).
- Szolnoki et al. (2011b) A. Szolnoki, G. Szabó, and M. Perc, “Phase diagrams for the spatial public goods game with pool punishment,” Phys. Rev. E 83, 036101 (2011b).
- Helbing et al. (2010b) D. Helbing, A. Szolnoki, M. Perc, and G. Szabó, “Evolutionary establishment of moral and double moral standards through spatial interactions,” PLoS Comput. Biol. 6, e1000758 (2010b).
- Szolnoki and Perc (2013) A. Szolnoki and M. Perc, “Effectiveness of conditional punishment for the evolution of public cooperation,” J. Theor. Biol. 325, 34–41 (2013).
- Reichenbach et al. (2007a) T. Reichenbach, M. Mobilia, and E. Frey, “Mobility promotes and jeopardizes biodiversity in rock-paper-scissors games,” Nature 448, 1046–1049 (2007a).
- Reichenbach et al. (2007b) T. Reichenbach, M. Mobilia, and E. Frey, “Noise and Correlations in a Spatial Population Model with Cyclic Competititon,” Phys. Rev. Lett. 99, 238105 (2007b).
- Mobilia (2010) M. Mobilia, “Oscillatory dynamics in rock-paper-scissors games with mutations,” J. Theor. Biol. 264, 1–10 (2010).
- Mobilia (2011) M. Mobilia, “Fixation and polarization in a three-species opinion dynamics model,” EPL 95, 50002 (2011).
- Wu et al. (2005) Z.-X. Wu, X.-J. Xu, Y. Chen, and Y.-H. Wang, “Spatial prisoner’s dilemma game with volunteering in Newman-Watts small-world networks,” Phys. Rev. E 71, 037103 (2005).
- Szolnoki et al. (2012) A. Szolnoki, M. Perc, and G. Szabó, “Defense Mechanisms of Empathetic Players in the Spatial Ultimatum Game,” Phys. Rev. Lett. 109, 078701 (2012).
- Gracia-Lázaro et al. (2012b) C. Gracia-Lázaro, J. A. Cuesta, A. Sánchez, and Y. Moreno, “Human behavior in prisoner’s dilemma experiments suppresses network reciprocity,” Sci. Rep. 2, 325 (2012b).
- Hernández and Zanette (2011) D. G. Hernández and D. H. Zanette, “Critical transition induced by neighbourhood size in evolutionary spatial games,” Eur. Phys. J. B 82, 361–366 (2011).
- Steingrube et al. (2010) S. Steingrube, M. Timme, F. Wörgötter, and P. Manoonpong, “Self-organized adaptation of a simple neural circuit enables complex robot behaviour,” Nat. Phys. 6, 224–230 (2010).
- Lee et al. (2011) S. Lee, P. Holme, and Z.-X. Wu, “Emergent Hierarchical Structures in Multiadaptive Games,” Phys. Rev. Lett. 106, 028702 (2011).
- Fu et al. (2012) F. Fu, C. E. Tarnita, N. A. Christakis, L. Wang, D. G. Rand, and M. A. Nowak, “Evolution of in-group favoritism,” Sci. Rep. 2, 460 (2012).
Popular summary
Widespread cooperation among unrelated individuals distinguishes humans markedly from other species. The origins of our remarkable other-regarding abilities have been associated with between-group conflicts as well as with alloparental care and provisioning for someone else’s young, all of which were pressing challenges that during the Paleolithic age and beyond could not be met by individual efforts. But in the absence of such challenges, what keeps us cooperating? Reciprocity is long considered an important piece of the puzzle. If someone is kind to us, we tend to be kind in return. Similarly, if someone is unfair or exploitative, we retaliate without much sympathy. And according to the strong reciprocity hypothesis, this positive and negative reciprocity are correlated to give us optimal evolutionary predispositions for the successful evolution of cooperation. But is this really true? Recent human experiments reject the hypothesis, and everyday experiences leave us with the impression that people either tend to reward success or punish wrongdoing, but seldom will they do both. We show how methods of statistical physics resolve the disagreement between theory and observations.
We perform Monte Carlo simulations of the public goods game, where besides defectors, cooperators have the option to reward, punish, or do both. The question we focus on is whether doing both confers an evolutionary advantage to individuals adopting such a correlated strategy. The evolutionary game gives rise to indirect territorial competition, spontaneous emergence of cyclic dominance, as well as divergent fluctuations of oscillations that terminate in an absorbing phase. All these are fascinatingly complex solutions that highlight the importance of collective behavior, pattern formation, and structure in human cooperation. Yet despite the richness of evolutionary outcomes, the correlated strategy can survive only in very narrow and rather unrealistic parameter regions. Rewarding or punishing only is far superior and more effective in deterring defection. Presented results thus lend support to the outcome of recent human experiments, which fail to support the strong reciprocity hypothesis that positive and negative reciprocity are correlated.
Our study demonstrates the usage of statistical physics in evolutionary games with correlated strategies, and we hope it will inspire more theoretical and experimental work aimed at clarifying their role by the evolution of human cooperation. The richness of the results and associated phase diagrams might also attract the attention of the broader physics community to be inspired by the complexity and beauty of the physics of non-equilibrium systems that address fundamental social and biological problems.