2 ESO, Karl-Schwarzschild-Strasse 2 85748 Garching, Germany
3 IAC, C/ Via Lactea, E38205, La Laguna (Tenerife), Spain
4 Max-Planck-Institut für Quantenoptik, Hans-Kopfermann-Str. 1, 85748 Garching, Germany.
5 Menlo Systems GmbH, Am Klopferspitz 19a, 82152 Martinsried, Germany
11email: molaro@oats.inaf.it
A Frequency Comb calibrated Solar Atlas ††thanks: Observations based on the ESO 3.6m Telescope at La Silla, Chile
Abstract
Context. The solar spectrum is a primary reference for the study of physical processes in stars and their variation during activity cycles.
Aims. In November 2010 an experiment with a prototype of a Laser Frequency Comb (LFC) calibration system was performed with the HARPS spectrograph of the 3.6m ESO telescope at La Silla during which high signal-to-noise spectra of the Moon were obtained. We exploit those Echelle spectra to study a portion of the optical integrated solar spectrum and in particular to determine the solar photospheric line positions.
Methods. The DAOSPEC program is used to measure solar line positions through gaussian fitting in an automatic way. The solar spectra are calibrated both with an LFC and a Th-Ar.
Results. We first apply the LFC solar spectrum to characterize the CCDs of the HARPS spectrograph. The comparison of the LFC and Th-Ar calibrated spectra reveals S-type distortions on each order along the whole spectral range with an amplitude of 40 m s. This confirms the pattern found by Wilken et al. (2010) on a single order and extends the detection of the distortions to the whole analyzed region revealing that the precise shape varies with wavelength. A new data reduction is implemented to deal with CCD pixel inequalities to obtain a wavelength corrected solar spectrum. By using this spectrum we provide a new LFC calibrated solar atlas with 400 line positions in the range of , and 175 lines in the nm range corresponding to the LFC bandwidth. The new LFC atlas is consistent on average with that based on FTS solar spectra, but it improves the accuracy of individual lines by a significant factor reaching a mean value of 10 m s.
Conclusions. The LFC–based solar line wavelengths are essentially free of major instrumental effects and provide a reference for absolute solar line positions at the date of Nov 2010, i.e. an epoch of low solar activity. We suggest that future LFC observations could be used to trace small radial velocity changes of the whole solar photospheric spectrum in connection with the solar cycle and for direct comparison with the predicted line positions of 3D radiative hydrodynamical models of the solar photosphere. The LFC calibrated solar atlas can be also used to verify the accuracy of ground or space spectrographs by means of the solar spectrum.
Key Words.:
Atlases – Reference systems – Sun: photosphere – Sun: activity – Stars: atmospheres – Planets and satellites: individual: Moon.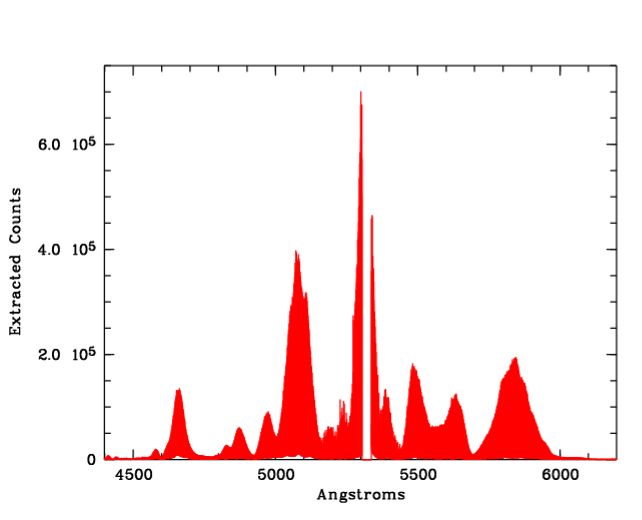
1 Introduction
The optical and infrared spectrum most used as reference for solar and stellar studies is the one obtained with the Fourier Transform Spectrometer (FTS) at the McMath-Pierce Solar Telescope at Kitt Peak National Observatory (Kurucz et al., 1984; Kurucz, 2006). The spectrum covers the spectral region from 296 to 1300 nm and achieves a signal-to-noise ratio of 2500 with a resolving power of R 400 000. However, the FTS solar spectrum is a merger of several observations taken at different positions of the solar disk performed from November 1980 to June 1981 that were later combined to produce an integrated solar flux. In addition, the wavelength’s precision of the FTS composite solar spectrum degrades with the distance of the sub-spectrum from the FTS zero point. As a result, the observed wavelengths of the solar lines are poorly determined, with an uncertainty at the level of a hundred m sat best (Allende Prieto and Garcia Lopez, 1998a, b). Disk-integrated solar spectra were taken with the un-focused sunlight NSO FTS spectra (Gray and Livingstone, 1997; Wallace et al., 2011). Molaro and Centurion (2011) and Molaro and Monai (2012) used HARPS spectra of asteroids to improve the precision of the line position relative to those provided by FTS spectra.
The Doppler shifts of the photospheric lines are related to the gravitational redshift and to dominant motions of the convective layers in which they form. When integrated over the disk, the latter are averaged over a variety of inhomogeneities across the stellar surface that produce the granulation and that may also vary in time in connection to the solar magnetic activity (Lindegren and Dravins, 2003). The spectrograph used to record the solar spectrum can also play a non-negligible role in introducing small distortions in wavelength. The spectral accuracy of conventional cross-dispersed spectrographs ultimately depends on the accuracy of the wavelength calibration. In the visible this is usually achieved by using arc lamp spectra such as those produced in hollow cathode Thorium lamps (Meggers, 1957; Giacchetti et al., 1970). Thorium has thousands of spectral features in the visible domain, it is mono-isotopic and has no hyperfine structure, and produces narrow and highly symmetric line profiles. For all these reasons, Th-Ar hollow cathode lamps have become the standard for wavelength calibration of astronomical spectrographs. The reference for the Th wavelengths is the Atlas of the Thorium Spectrum obtained with the McMath-Pierce Fourier Transform Spectrometer (FTS) of the National Solar Observatory at Kitt Peak (Palmer, 1983), (PE83), with a spectral resolution of 600 000. The atlas gives the position of 11 500 lines between 300 and 1100 nm with a quoted wavenumber accuracy at 550.0 nm ranging from 16 to 82 m s. However, most of of them are blends of individual components and with a spectrograph with resolving power of 100 000 the number of usable lines decreases to 4000. Lovis and Pepe (2007) taking advantage of the stability of the High Accuracy Radial velocity Planet Searcher (HARPS) spectrograph suggested how to increase the number of usable lines, in particular of faint lines and how to improve their wavelength position. However, as we show in this paper, these positions are affected by the HARPS detector system and their application should remain confined to this spectrograph. In the last years a new wavelength calibration technique based on a Laser Frequency Comb (LFC) able to produce a sequence of equally spaced emission lines with similar intensity has been suggested as an ideal calibrator (Murphy et al., 2007) and subsequently demonstrated by Wilken et al. (2012); Ycas et al. (2012); Phillips et al. (2012).
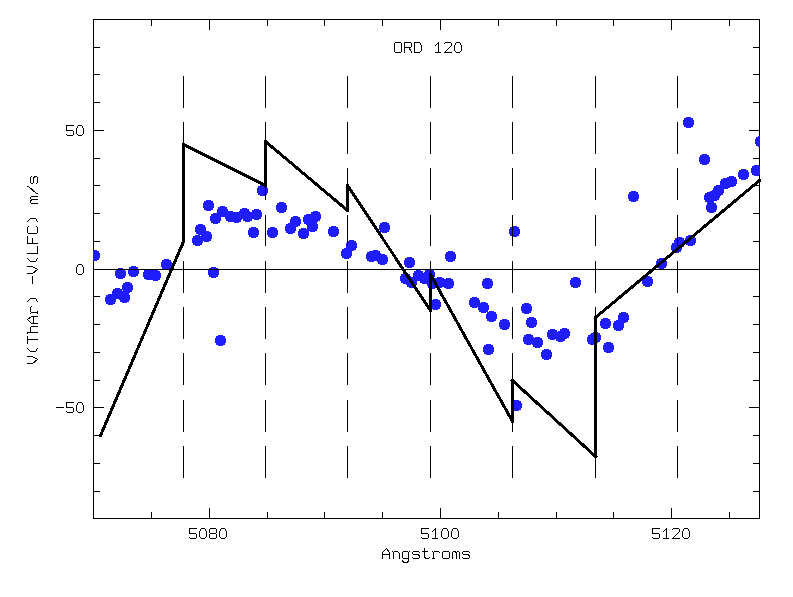
With the first LFC experiment performed with HARPS at the 3.6 m ESO telescope at La Silla, Chile, spectral distortions were found at the level of about 40 m sin order N. 120 (Wilken et al., 2010a, reproduced here in Fig. 6). To achieve large CCDs, manufacturers employ a method which consists in butting a master lithographic block of 1024x512 pixels. Each of the two HARPS CCDs is build up with 16 of these master blocks. At the boundaries of the blocks the pixel size is not exactly 15 m and so is the distance between the center of the two adjacent active pixels on the two sides of the discontinuity. Wilken et al. (2010a) suggested that manufacturing imperfection of pixel sizes in the HARPS CCDs might be responsible for an adaptation of the dispersion curves in the wavelength calibration analysis that produces the observed S-type distortion. These distortions should be present in all HARPS spectra even though the spectrograph is able to deliver sub m srelative precision and should also be present in other Echelle spectrographs which make use of CCDs manufactured with the stitching technique across the dispersion direction. In the present paper we analyze HARPS solar spectra as reflected by the Moon and calibrated with an LFC spanning more than about 100 nm. The aim is to provide a high-precision solar atlas with reduced instrumental uncertainties and to characterize the HARPS spectrograph over a range wider than what tested by the pioneering paper of Wilken et al. (2010a).
| Date | UT start exp | N. S. Spots | Exp.(sec.) | ||||
|---|---|---|---|---|---|---|---|
| 2010-11-25 | 05-47-20 | 14.4 | 60 | ||||
| 2010-11-25 | 05-49-42 | 14.4 | 150 | ||||
| 2010-11-25 | 05-53-19 | 14.4 | 60 | ||||
| 2010-11-25 | 05-55-20 | 14.4 | 120 | ||||
| 2010-11-25 | 05-57-54 | 14.4 | 120 |
| Observation | RVc | RV | N. lines | RV | N. lines | |||||
|---|---|---|---|---|---|---|---|---|---|---|
| km s | km s | km s | km s | km s | m s | km s | ||||
| 2010-11-25, 05-47-20 | -1.190 | -1.181 | 0.267 | 494 | 0.009 | -1.169 | 0.061 | 239 | 0.020 | |
| 2010-11-25, 05-49-42 | -1.187 | -1.180 | 0.248 | 484 | 0.006 | -1.166 | 0.057 | 240 | 0.020 | |
| 2010-11-25, 05-53-19 | -1.182 | -1.176 | 0.256 | 487 | 0.007 | -1.158 | 0.059 | 236 | 0.024 | |
| 2010-11-25, 05-55-20 | -1.179 | -1.176 | 0.263 | 490 | 0.004 | -1.157 | 0.056 | 234 | 0.022 | |
| 2010-11-25, 05-57-54 | -1.176 | -1.171 | 0.264 | 493 | 0.005 | -1.158 | 0.057 | 236 | 0.019 |
2 Observations and data reduction
2.1 The Astro-Comb
Since 2007 ESO, in collaboration with Menlo Systems and the Max-Planck-Institut für Quantenoptik (MPQ), has developed an LFC prototype, called also astro-comb, dedicated to astronomical observations. Four campaigns with HARPS at the 3.6 m telescope in La Silla were organized to test the global performance (Wilken et al., 2010a, b, 2012).
A LFC consists in a multitude of equally spaced optical frequencies over a bandwidth of several tens to hundreds of THz. Its light source is a passively mode-locked laser emitting a train of femtosecond pulses. In the frequency domain, a set of very sharp spectral lines at frequencies is obtained. Here, is an integer, is the repetition rate of the optical pulses, and is the so-called offset frequency. Both and are radio-frequencies that are stabilized to an atomic clock which directly transfers the accuracy and stability of the atomic clock into the optical frequency domain.
The first LFC tested on an astronomical spectrograph was in the infrared (Steinmetz et al., 2008). LFCs are the ideal calibrators for astronomical high resolution spectrographs if they can cover the spectral bandwidth of the spectrograph with a sufficiently flat spectrum and if their line spacing is adapted to the spectrograph resolution. Typically, this requires a line spacing of 10 to 30 GHz.
The ESO astro-comb is based on fibre-laser technology which greatly enhances robustness and reliability, and enables the use of high-power amplifiers. Yb-doped fibre-lasers, as used in this comb, are particularly suited since the second harmonic of the central wavelength at about 1030 nm is in the centre of the visible range. However, the required fibre length limits the round-trip time in the oscillator, and thus its repetition rate. Commercially available fibre-based LFCs therefore typically have a line-spacing of 250 MHz. For astronomical applications, the line-spacing is increased by using Fabry-Perot cavities as a high-resolution spectral filter, suppressing the unwanted lines. The LFC for the HARPS spectrograph, as employed here and described in Wilken et al. (2012), was filtered to a line spacing of 18 GHz by 3 concatenated cavities. This was followed by frequency doubling the LFC spectrum, yielding a center wavelength of about 525 nm, and subsequent spectral broadening in a tapered photonic crystal fibre.
The stability of the LFC system was tested by comparing 1400 spectra collected between November 2010 and January 2011 (Wilken et al., 2012) . These spectra showed that on short time scales the level at which the data no longer follow the photon noise is 2.5 cm sfor the LFC, while it is at 10 cm sfor ThAr. By using the LFC calibrated spectra of HD 75289, Wilken et al. (2012) could also reconstruct the orbit of a Jupiter size exoplanet with a period of 3.5 days known to orbit around this solar-type star.
2.2 The observations
The observations of the Moon analyzed in this paper were made with the HARPS spectrograph during Nov 2010 observing run. The journal of the observations is reported in Table 1 together with some basic information. The observations were performed pointing towards the Moon’s center, and the Moon’s illuminated fraction was of 86%. HARPS spectra are taken at a resolving power of R = = 115 000 covering the spectral range from to nm with a small gap at nm. The Point Spread Function in the order centers was sampled with 4.1 pixels 15 m wide. The fibers feeding HARPS are equipped with a double scrambler to provide both slit and pupil stability. This is an important difference compared to slit spectrographs where non-uniform slit illumination induces radial velocity differences between different exposures. HARPS is able to deliver a sequence of observations over a 500-day baseline with a dispersion of 64 cm salong the exoplanet radial velocity orbital change.
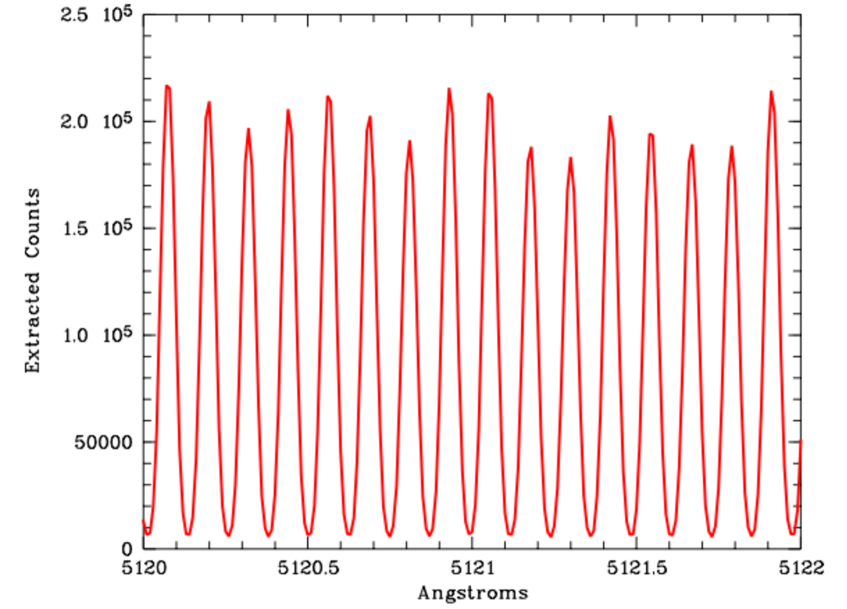
The LFC spectrum is imaged onto parts of both of HARPS’ CCDs for a total wavelength range of 125 nm, spanning from 465 to 590 nm. The whole LFC spectrum is shown unresolved in Fig 1. Since the flux has considerable variations in intensity over the spectrum, a good calibration can be obtained in a somewhat more restricted range from about 476 and 585 nm with a gap between the two detectors at 530 to 534 nm. Note that the structure in the LFC spectral envelope was a feature of 2010 test while present LFC are generated with a very constant spectral envelope. The LFC spectrum has a very high line density and individual lines are not resolved on this scale. A zoom into a spectral window of 0.2 nm at 512.0 nm is reproduced in Fig. 2 showing the uniform and non-blended line pattern with a line density of 80 lines per nm. The LFC has 350 lines per order, while the Th-Ar lamp has less than 100 lines per order with different intensity, sometimes blended or saturated. The LFC spectra were used both to obtain the wavelength calibration and to correct for instrumental drifts. The LFC emission lines are identified and fitted using gaussian profiles. The wavelength solution is obtained by means of a third degree polynomial along the CCD. The average number of modes per order in the wavelength range we are studying is of 350, corresponding to a mode separation of 18 GHz. While fiber A of HARPS is fed with the moonlight from the telescope, the LFC is launched into fiber B, providing a simultaneous reference spectrum to monitor overnight instrumental drifts. The instrumental drift is computed from the displacement of the LFC spectrum acquired simultaneously with the Sun spectra on the adjacent fiber. For each LFC mode the displacement is weighted by the signal collected on that mode.
3 Measuring solar line positions
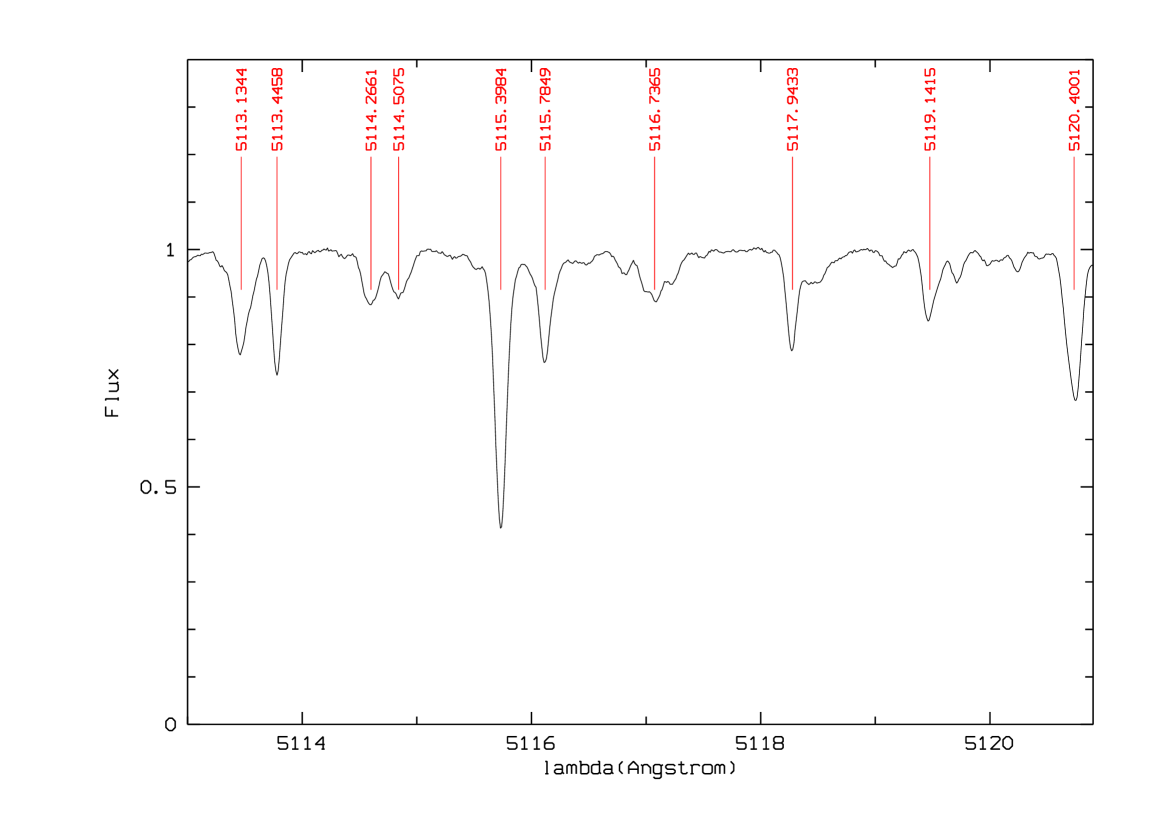
We used the DAOSPEC program to measure the position of the photospheric lines on solar spectra calibrated with the LFC. DAOSPEC is a program developed by P. Stetson that automatically finds absorption lines in a stellar spectrum, fits the continuum and identifies lines with the help of a laboratory line list (Stetston and Pancino, 2008). Spectral lines are modeled by gaussian profiles and identify blends through an estimation of the FWHM adjusted on the actual measurement of the line widths. As such DAOSPEC is not adequate to measure strongly saturated lines which are on the square-root or damping parts of the curve of growth or to reveal the line asymmetries, namely the shape of the line bisector of photospheric lines. It is well known that the blueward hook of the originates from the upflowing granules and dominates the bisector close to the continuum while the intergranular components are more gaussian and slightly redshifted. The result is that strictly speaking the radial velocity of a line is a function of the line depth. DAOSPEC provides the line position under the gaussian approximation and computes the mean radial velocity from the lines of the input lines list identified in the spectrum. As such this is an approximation but has the advantage to be easily reproduced and measured. An example of the automatic identifications made by DAOSPEC in a small portion of the solar spectrum is shown in Fig. 3. For the initial line list we have adopted the one derived by Molaro and Monai (2012) in their HARPS solar data, which contains many strong and unblended lines in the spectral region covered by the LFC. We set a threshold of 0.0025 nm for the minimum equivalent width (EW) to avoid problems with relatively weak lines and performed the analysis on the two different HARPS CCDs separately. The initial line list is a list of the observed lines in the sun thus already incorporating the convective blueshift and the gravitational redshift. The mean radial velocities of the spectra computed from all identified lines by DAOSPEC with respect to the input line list are provided in Table 2 separately for the blue (RV) and red (RV) CCDs .
The theoretical expected radial velocity of the solar spectrum accounts for the motions of the Moon with respect to the observer and with respect to the Sun. For the latter we also estimate a component of 3.2 m sdue to the rotation of the Moon, since the sunlight hits the receding lunar hemisphere before being reflected with an angle of 43o. These are computed by using the JPL ephemerides and their sum is provided in the second column of Table 2. The mean difference between the measured radial velocity RV or RV and the expected value RVc as computed with JPL ephemerides is +21.7 m sin the red and = 5.7 m sin the blue. Any difference with the predicted velocity can be due either to an intrinsic shift of the reference solar spectrum induced by solar activity or to an error in the wavelengths of the solar spectrum lines taken as a reference. Since in 2006, the year of the reference spectrum, the Sun showed six solar spots, slightly less than the 14 of the epoch of the present observations, we assume that the radial velocity differences reflect uncertainties more likely coming from the reference spectrum used as an input list, i.e. the subset of the line list provided by Molaro and Monai (2012) which was generated from HARPS spectra of CERES calibrated with a conventional Th-Ar technique. The standard deviation of the distribution of the deviations of the line position with respect to derived radial velocity returned by the DAOSPEC analysis is of 260 m sand of 60 m sin the blue and red, respectively. In the following section we will show that a significant contribution to the scatter of the red CCD originates in the instrumental distortions introduced by CCD manufacturing defects. However, the blue region shows a considerably larger dispersion which is more likely originated in the solar spectrum used as a reference.
| EW | Ident | ||
|---|---|---|---|
| Å | m s | mÅ | |
| 5593.73963 | 51.73 | 41.4 | NI1 |
| 5594.65538 | 41.16 | 64.0 | FE1 |
| 5598.30493 | 30.29 | 82.1 | FE1 |
| 5600.03586 | 31.28 | 28.5 | MN2 |
| 5600.22349 | 16.07 | 36.7 | FE1 |
| 5601.28320 | 40.22 | 97.7 | CA1 |
| 5614.78097 | 18.89 | 41.8 | NI1 |
| 5618.63788 | 6.06 | 49.9 | FE1 |
| 5619.60420 | 13.80 | 33.3 | FE1 |
| 5620.47933 | 19.18 | 36.8 | FE1 |
| 5624.02998 | 11.99 | 49.7 | FE |
| 5625.32288 | 27.45 | 39.5 | NI1 |
| 5633.95031 | 51.04 | 65.5 | FE1 |
| 5635.82653 | 16.82 | 34.8 | FE1 |
| 5637.12063 | 15.95 | 33.4 | NI1 |
| 5637.40814 | 13.14 | 41.7 | OS1 |
| 5638.26528 | 6.53 | 73.9 | FE1 |
| 5641.44472 | 3.12 | 63.0 | FE1 |
| 5644.12610 | 22.26 | 35.0 | FE2 |
| 5645.61161 | 3.76 | 32.0 | SI1 |
| 5649.67584 | 8.73 | 31.5 | NI1 |
| 5649.99071 | 12.45 | 34.1 | FE1 |
| 5650.68848 | 9.56 | 35.9 | FE1 |
| 5652.32118 | 11.43 | 25.2 | FE1 |
4 Detection of HARPS spectral distortions
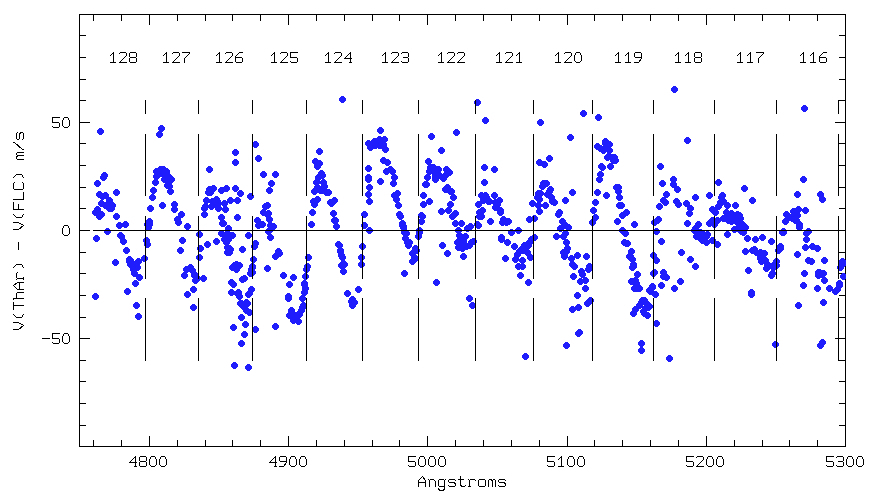
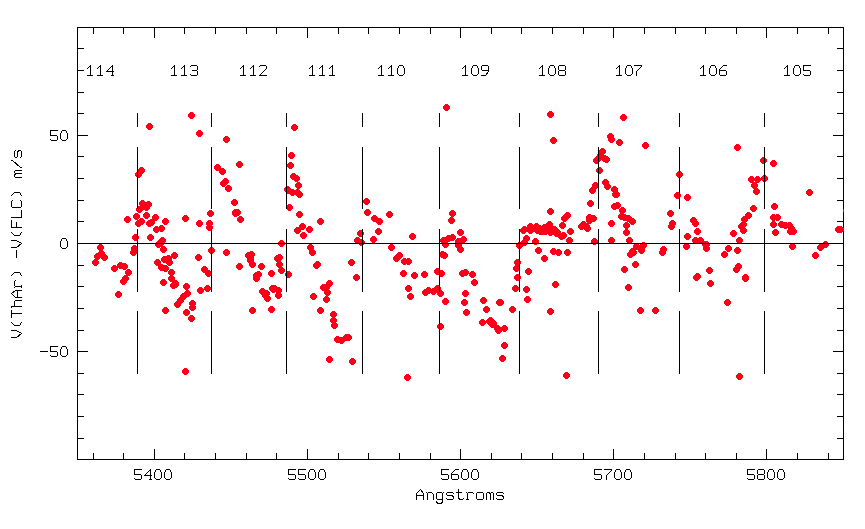
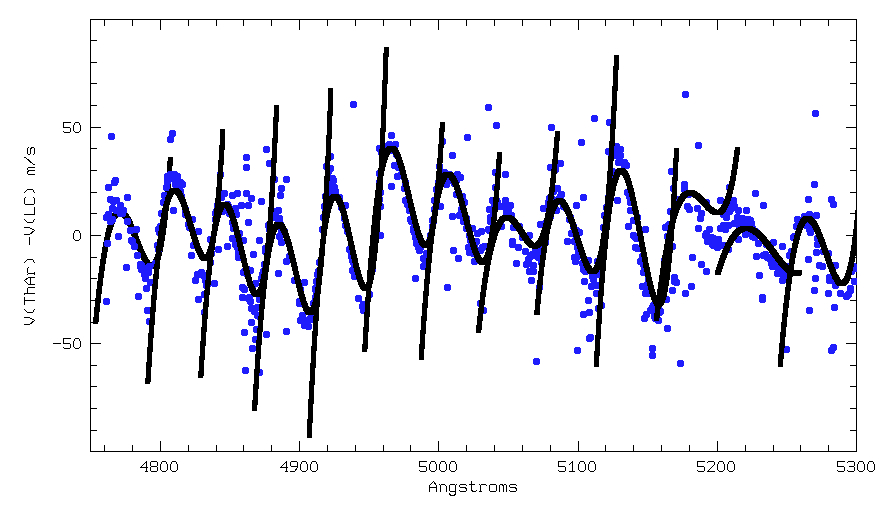
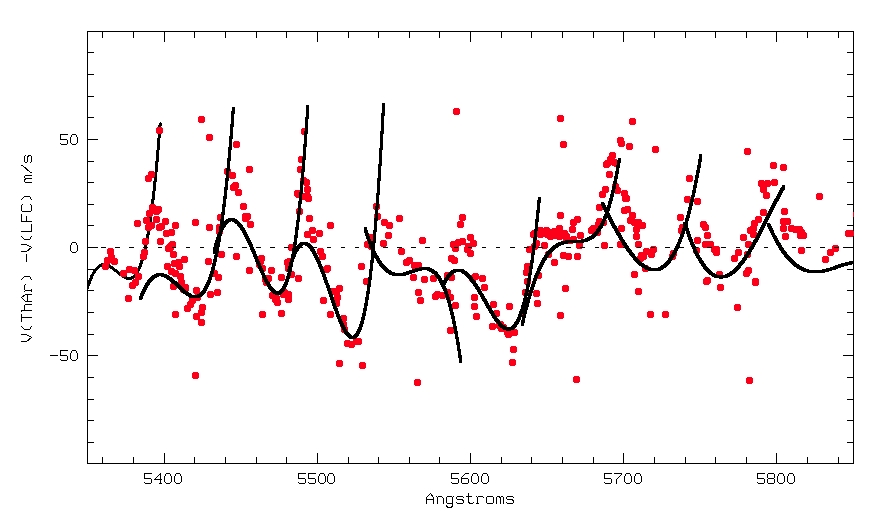
As an application of the newly derived solar line list we show how it can be used to reveal instrumental distortions of HARPS spectra calibrated with Th-Ar lamps. For this purpose we compared the line positions measured in the spectrum calibrated in wavelength with the Th-Ar with those measured in the same spectrum but calibrated with the LFC. The differences between the two sets of measurements on the full set of 1245 solar lines with EW greater than 0.0025 nm detected in the range are shown in Fig. 4 for the blue and Fig. 5 for the red. The difference in wavelengths reveals a characteristic pattern which is remarkably similar in each order from one order to the other. The pattern is a kind of S-type with positive velocity differences at the beginning of each order. It is only in the last 3 orders of the red portion investigated that the pattern is less clear or even absent. On average the mean radial velocity in the whole red range is of -0.8 22 m sand -0.16 21.6 m sin the blue range, but could be quite offset from zero in small spectral ranges. For instance, in order N.109 the mean value is of -9.2 22.5 m swhile in order N. 123 it is of 14.2 19.1 m s. In general, the pattern is very similar to the one revealed by Wilken et al. (2010a) in the first experiment with an LFC on HARPS. Owing to the high line density of the LFC spectra, Wilken et al. (2010a) were able to characterize the detectors by revealing the effect of the stitching pattern of the CCD fabrication on the wavelength calibration. The S-type shape is the result of the adaptation of the polynomial solution to the limited number of Th lines if non identical pixel sizes are present. The presence of non identical pixels in proximity of the CCD stitch goes unnoticed when Th-Ar calibration is used, because of the low number of lines present in the orders, but produces a peak-to-peak radial velocity distortion which reaches 80 m sin the Echelle order 120.
A zoom of the results for the Echelle order 120 is shown in Fig. 6 together with what found by Wilken et al. (2010a) for the same order, which shows a good overlap. There are only few points deviating significantly from the S-type shape that are due to relatively weak lines where the error in the measurement of the line position is particularly large. This comparison shows that although the number density of useful solar lines is considerably lower than the LFC emission, they are considerably more numerous than the Th lines and sufficient to reveal the wavelength shifts introduced by CCD defects.
Another way to see the same distortion is by measuring the difference in line position of the LFC spectrum once calibrated with the Th-Ar solution, thus taking advantage of the denser LFC lines with respect to the solar spectrum. Fig. 7 and Fig. 8 show the velocity difference between the line positions in the LFC spectrum calibrated with the Th-Ar lamp and the same LFC spectrum calibrated on itself. The velocities derived with the Th-Ar calibration are corrected by -9 and -20 m ssince as discussed in the previous section the Th-Ar provides slightly redshifted wavelengths in this portion of the spectrum. The orders are not merged and reveal an additional distortion at the edges. However, a close resemblance with the distortions revealed by using the solar lines can be seen. In particular the deviation from zero of individual orders and the less defined S-type behaviour around 525.0 nm or in the red CCD are also confirmed. We have verified that the distortions remain stable over the period of these observations. Although we do not expect these to change, they should be verified with further similar LFC experiments performed with a longer time baseline. The close similarity between the two results provides confidence on the accuracy of the wavelengths of the LFC solar atlas. Therefore, this atlas can be used to calibrate or to test the accuracy of any ground or space spectrograph from an acquisition of a solar spectrum and the comparison with the present atlas.
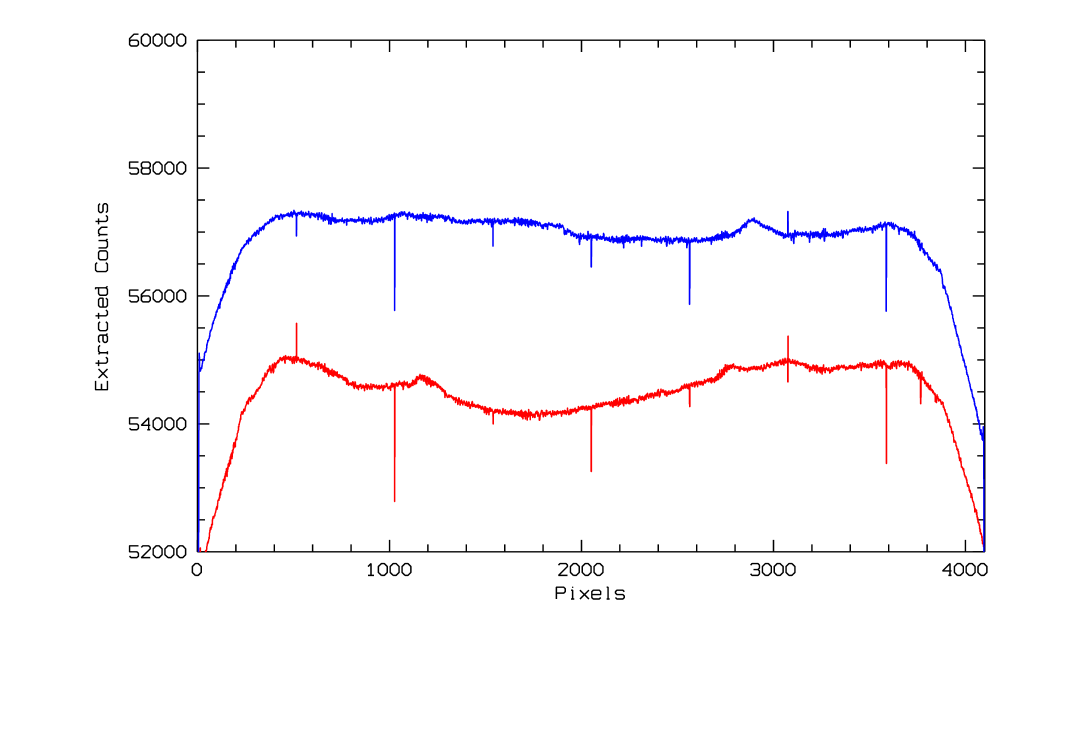
The observed inter-order distortions are likely induced by the stitching pattern which is present in the HARPS CCDs. Different pixel sizes can be revealed by accurate flat fielding and in particular by technical LED flats which illuminate the whole CCD. Summing up of columns of the LED flats for the two HARPS CCDs normal to the dispersion direction are shown in Fig. 9. The technical flats reveal abrupt changes in the flux involving 1 or 2 pixels in correspondence of the CCD stitching but with an offset of 4 pixels, i.e. every 4+ n 512 pixels. The changes in flux are highly variable going from a minimum of 0.4 % of the adjacent flux at position 1540 up to 3 % which is observed at position 1028. The flux changes reflect a change in the sensitive area of the pixels close to the junctions. Thus every 512 pixels there is a discontinuity as the intra-pixel distance is slightly different along the stitching borders. It is the combined effect of these irregularities with the position and number of Th lines in that order that produces the observed spectral distortions, which are similar but not identical in all spectral orders as revealed by our analysis by means of the LFC calibrated solar atlas.
5 A LFC calibrated solar atlas
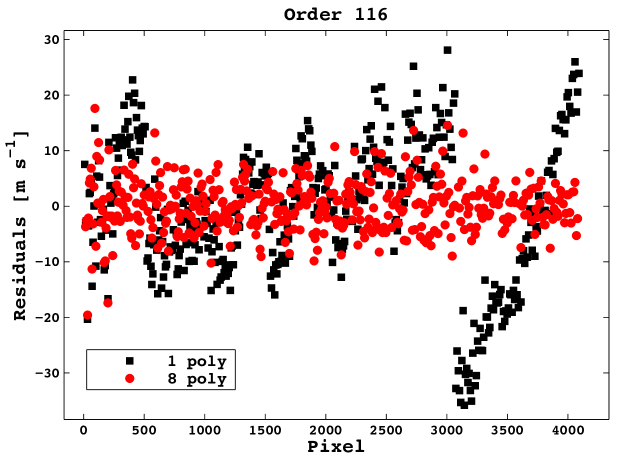
We have improved the wavelength calibration in order to properly account for the pixel size discontinuities occurring at the CCD stitches . The spectral order were each divided into 8 chunks of 512 pixel elements, as many as the number of master blocks along the dispersion direction. For each chunk, the wavelength calibration was obtained by fitting a third degree polynomial to the position of the LFC modes. In each chunk we had some 40-50 LFC lines to be used for the fit. An example of the improvement in the residuals of the new wavelength calibration is shown in Fig. 10. The residuals from wavelength solutions restricted to eight portions of the CCD are significantly smaller and do not show spikes or trends as when the CCD is considered as made up of pixels of equal size. A similar approach cannot be followed with hollow cathode lamps because of paucity and irregular distribution of the Th-Ar lines lines.
Thus, thanks to the high spectral density of the LFC lines, and to their precision we correct for CCD non-uniformities and obtained a solar spectrum which is relatively free from major instrumental effects affecting the wavelength calibration. We used DAOSPEC to measure the solar line positions on these spectra. Out of the about 1200 lines initially selected, we retained only lines with positions that did not deviate significantly from the mean value measured in the five spectra of the Moon. In this way the selected list is less vulnerable to the presence of blends and of reduction problems. In fact, deviations larger than average are observed for lines falling in correspondence of the wings of the strong lines of Hα, Hβ and of the NaI and MgI multiplets. After a 3 clipping the final line list comprises 400 and 175 lines in the ranges and nm, respectively. The global radial velocity is adjusted to match the theoretical radial velocity expected from the Sun and therefore made independent from the accuracy of the radial velocity of the input list. The standard deviation of the difference in the velocities of the five solar spectra is also reported in the second column of Table 3. Average values are of 12 and 15 m sin the blue and red, respectively, and are consistent with the photon noise error. The table provides the first entries of the atlas as an example of the content, while the full table is available electronically . The solar spectra adopted in this analysis and calibrated by means of the LFC are also made available in ascii format for general use 111Table 3 and the solar spectra are only available in electronic form at the CDS via anonymous ftp to cdsarc.u-strasbg.fr (130.79.128.5) or via http://cdsweb.u-strasbg.fr/cgi-bin/qcat?J/A+A/. The spectra are non-normalized spectra with a step size of 0.01 Å and are separated into a blue (475.368 and 530.409) and a red (533.726 and 586.000) spectra corresponding to the portion of spectra falling onto the two HARPS CCDs which have been calibrated with the LFC. The spectra provided are corrected by the motion of the observer towards the Moon and by the motion of the Moon towards the Sun, the sum of which is reported in the second column of Table 2. The calibrated LFC of individual orders, which gives in formation of the shape and behaviour of the spectral point spread function, is also provided.
6 The Lovis & Pepe (2007) Th-Ar line list
The detected inter-order distortions in HARPS spectra produced by different pixel sizes in the CCDs have relevant bearings on the Th-Ar line list provided by Lovis and Pepe (2007) (LP07) which is based on HARPS Th-Ar observations. The authors made use of the higher sensitivity of a grating spectrograph such as HARPS compared to a Fourier Transform Spectrometer to reduce the random noise of the Palmer (1983) wavelengths. LP07 used a large set of Th-Ar spectra taken with HARPS over one month to improve the measurement precision of many Th-Ar lines of PE83. They identified lines which in HARPS showed no significant wavelength variations with time and obtained their positions with typical rms of 5 -10 m s. Thus, they suggested to replace the wavelengths of individual PE83 lines according to their observed position. The new LP07 Th-Ar atlas contains 4000 previously unidentified lines and more than doubles the number of lines available for wavelength calibration. However, for what discussed in the previous section it is very likely that the Th lines in HARPS were falling in a slightly different position if compared to PE83 as the result of the spectral distortions introduced by CCD defects which we revealed by means of the LFC wavelength calibration. A new thorium line list based on new measurements from the FTS at NIST has been made available very recently (Redman et al., 2013). When the new lines are compared with those of LP07 a large scatter is confirmed.
LP07 noted that only some lines where changing position with time. They attributed this to either the fact that these lines experience significant shifts with changing lamp pressure or current, or that they are actually a blend with varying relative intensities of the lines composing the blend. Considering what discussed in this paper, it is more likely that lines that changed position were closer to the critical points generating the spectral distortions and therefore were subject to larger instabilities.
Therefore, the new positions provided by LP07 are particularly useful to minimize the effect of spectral distortions in HARPS spectra, but their use should not be generalized to other spectrographs. We also performed a test by comparing a solar spectrum calibrated with PE83 Th-Ar lines with the same spectrum but calibrated with the Th-Ar lines by LP07. In the spectral region 530-680 nm the two spectra reveal a difference of 17 m sin radial velocity. The fact that the reference spectrum of Molaro and Monai (2012) was calibrated with the PE83 line list accounts for most of the difference of 21 m sbetween the expected velocity and the computed one reported in Table 2.
The laboratory wavelength list of LP07 was modified to match the lower resolving power of UVES by means of an algorithm derived by Murphy et al. (2007). These are currently used in the UVES spectrograph. We emphasize that since the modified positions are associated to HARPS distortions there is no reason to export them to a different spectrograph where such a distortions, even when present, should have a different behaviour. A new set of wavelengths for Th-Ar based on this set of LFC observations in the 475-580 nm spectral region is in preparation (Fei Zaho et al., 2014).
7 Summary and future prospects
From the analysis of a high signal-to-noise integrated solar spectrum obtained from Moon observations and calibrated by means of an LFC we confirmed the presence of wavelength distortions in the HARPS spectra first revealed by Wilken et al. (2010a) with the first LFC experiment. We also extended such an evidence to all 23 orders of the Echellogram covered by the LFC showing that the behavior is quite general and should affect the whole spectrum. We also showed that the distortions in the different orders have similar patterns but they differ among them depending on the number and position of Thorium lines available in each order.
By using the spectral region covered by the LFC we provided a new atlas of solar line positions with about 600 entries in the range nm. The mean accuracy of individual positions of strong lines is of 12 6 m sand in many lines can be as good as 5 m sand is free of instrumental effects.
Thus, the atlas can be used to calibrate any ground or space spectrographs in the covered range down to this precision. As a whole, it provides an absolute reference of the solar photospheric radial velocity relative to the date of Nov 2010. On Nov 2010 the Sun was showing a reduced activity of the solar cycle. The number of spots at that epoch is of 14.4, a number which corresponds to a low magnetic activity.
The connection between radial velocity variations with the cycle of magnetic activity along the solar cycle is far from being settled. For instance several radial velocity shifts of Cen B related to stellar activity were observed and corrected for in order to reveal the presence of one of the smallest exoplanets (Dumusque et al., 2012). Jiménez et al. (1986) measured changes in the radial velocity of the Sun in the period from 1976 and 1985 with a resonant scattering spectrometer and found variations of 16 m sin correspondence of the peak cycle and Deming and Plymate (1994) measured a peak-to-peak modulation of 30 m s over the 11-year solar activity period with the positions redshifted in correspondence to the maximum of the activity. However, McMillan et al. (1993) did not reveal any drift within 4 m s in the solar line position from a long data series spanning from 1987 to 1992. Lagrange et al. (2010, 2011) computed the radial velocity variations caused by the spots observed on the Sun’s surface in cycle 23 (between 1993 and 2003) and included them in a synthetic model of the solar spectrum. They found typical amplitudes of up to a few m sdepending on the activity level and on the temperature of the spot, but they were lower than those observed by Jiménez et al. (1986) and Deming and Plymate (1994). The periodograms contain peaks at periods that are sometimes very different from the solar rotation period and therefore require accurate control to be revealed. Contrary to spots, plages suppress convection in the active regions, leading always to a redshift of the whole solar spectrum. Meunier et al. (2010) considered the presence of plages and found a long-term amplitude of 8 m swhile the short term radial velocity amplitude is of the order of m sor down to 0.4 m sduring the low-activity period. Gray et al. (2009) pointed out that the shift is line-dependent and that strong and weak lines should give different shifts, which would be interesting to measure. Since the various experiments used different lines at different wavelengths, this could, at least partially, explain the discrepancies.
The solar spectrophotometer Mark-I located at the Observatorio del Teide provides radial velocity measurements of the Sun-as-a-star spanning the last 36 years and showed a clear modulation of 5 m sin phase with the magnetic activity cycle and clearly anti-correlated with the solar spot number (Palle et al., 2013). However, no dependence on the solar cycle is visible in the Global Oscillation at Low Frequencies (GOLF) observations on board of the Solar heliospheric Observatory (SOHO) over 8 years of observations (García et al., 2005). These activity-related movements are expected at the level of few m sand can be established with HARPS observations of asteroids when calibrated with a laser frequency comb.
The present list of absolute solar line positions could be also used as a reference of theoretical models of the solar photosphere. The 3D radiative-hydrodynamical convection models for FeI and FeII solar lines can be compared directly with the observed line positions. According to Asplund et al (2000) the comparison of the absolute line shifts of their models with the observed line positions from Allende Prieto and Garcia Lopez (1998b) reveals excellent agreement for weak FeI lines (EW 0.006 nm ) with a difference of 0 53 m swhich degrades to 51 81 m swhen including also lines with larger equivalent widths (EW 0.01 nm ). For FeII lines the agreement is slightly worse with a mean difference of -64 85 m s. 3D radiative hydrodynamical models of the solar photosphere computed with the CO5BOLD code have also been obtained and described in Caffau and Ludwig (2007). For instance these models for the FeI 552.5544 nm line provide a convective blue shift of -371 m s(Caffau, 2010). In the present atlas the observed line position for this FeI line is at 552.554816 nm and therefore it results redshifted by +226 m swith respect to the laboratory wavelength. Adopting a solar gravitational redshift of +633.5 m s, as measured at the Earth, the intrinsic motion of the convective region of the formation of the FeI 552.5544 nm line is blue-shifted by -407.5 m s. Thus the difference between the observed central wavelength and the predicted one is of 36.5 m s. This example shows how an improved solar line position could be useful in constraining theoretical models for the solar photosphere and a detailed comparison will be the subject of a dedicated work (González Hernández et al., 2014).
Acknowledgements.
We are grateful to Peter Stetston and Elena Pancino for making available and providing assistance with DAOSPEC. We thank Simonetta Fabrizio and Gabriella Schiulaz for reviewing the text. We thank an anonymous referee for several suggestions which improved the paper. R.R., M.E. and J.I.G.H. acknowledge financial support from the Spanish Ministry project MINECO AYA2011-26244, and J.I.G.H. also from the Spanish Ministry of Economy and Competitiveness (MINECO) under the 2011 Severo Ochoa Program MINECO SEV-2011-0187. L. P. is Visiting Researcher (PVE) of the CNPq Brazilian Agency, at the Federal University of Rio Grande do Norte, Brazil.References
- Allende Prieto and Garcia Lopez (1998a) Allende Prieto C., & Garcia Lopez R. J. 1998a, A&AS, 129, 41
- Allende Prieto and Garcia Lopez (1998b) Allende Prieto, C., & Garcia Lopez R. J. 1998b, A&AS, 131, 431
- Asplund et al (2000) Asplund, M., Nordlund, A., Trampedach, R., Allende Prieto, C., & Stein, R. F. 2000, A&A, 359, 729
- Brault and Neckel (1987) Brault, J., & Neckel, H. 1987, Spectral Atlas of Solar Absolute Disk-Averaged and Disk-Center Intensity from 3290 to 12 510 A, unpublished (tape-copy from KIS IDL library)
- Caffau and Ludwig (2007) Caffau E., and Ludwig, H. G., 2007 A&A 467, L11
- Caffau (2010) Caffau E., private comunication.
- Centurión et al. (2010) Centurión, M. and Molaro, P. and Levshakov, S. 2010 Memorie SAIt, 80, 929, ArXiv 0910.4842
- de Cuyper and Hensberge (1988) de Cuyper, J.-P., & Hensberge, H. 1988, A&AS, 129, 409
- Deming and Plymate (1994) Deming, D., & Plymate, C. 1994, ApJ, 426, 382
- Dumusque et al. (2012) Dumusque, X., et al., 2012, Nature 491, 207
- Fei Zaho et al. (2014) Fei Zaho et al., 2014 in preparation.
- Famaey et al. (2005) Famaey, B., Jorissen, A., Luri, X., et al., 2005, A&A, 430, 165
- Giacchetti et al. (1970) Giacchetti, A., Stanley R., W., and Zalubas, R., 1970, J. Opt. Soc. Am. 60, 474
- García et al. (2005) García R.A. 2005 A&A 385, 395
- González Hernández et al. (2014) González Hernández, J., I., et al in preparation.
- Gray and Livingstone (1997) Gray, D. F., & Livingston, W. C. 1997, ApJ, 474, 802
- Gray et al. (2000) Gray, D. F., Tycner, C., & Brown, K. 2000, PASP, 112, 328
- Gray et al. (2009) Gray, D. F., 2009 ApJ, 697:1032
- Hunten (1970) Hunten, D. M. 1970 ApJ159, 1107
- Kurucz et al. (1984) Kurucz, R. L., Furenlid, I. J., & Testerman, L. 1984, NOAO Atlas No. 1, The Solar Flux Atlas from 296 to 1300 nm. Sunspot, (NM: National Solar Observatory)
- Kurucz (2006) Kurucz, R. L., arXiv:astro-ph/0605029
- Jiménez et al. (1986) Jiménez, A., Palle, P.L., Regulo, C. et al. 1986, AdSpR 6, 89
- Lagrange et al. (2010) Lagrange A. -M., Desort M., Meunier N. 2010 A&A 512, A38
- Lagrange et al. (2011) Lagrange A. -M., Desort M., Meunier N. 2011 A&A 528, L9
- Lindegren and Dravins (2003) Lindegren, L., & Dravins, D. 2003, A&A, 401, 1185
- Livingston et al. (1999) Livingston, W., Wallace, L., Huang, Y., Moise, E 1999 ASPC 183, 494
- Lovis and Pepe (2007) Lovis, C., & Pepe F. 2007, A&A, 468, 1115
- Mayor et al. (2003) Mayor, M., Pepe, F., Queloz, D., Bouchy, F., Rupprecht, G., Lo Curto, G., Avila, G., Benz, W., Bertaux, J.-L., Bonfils, X., Dall, Th., Dekker, H., Delabre, B., Eckert, W., Fleury, M., Gilliotte, A., Gojak, D., Guzman, J. C., Kohler, D., Lizon, J.-L., Longinotti, A., Lovis, C., Megevand, D., Pasquini, L., Reyes, J., Sivan, J.-P., Sosnowska, D., Soto, R., Udry, S., van Kesteren, A., Weber, L., Weilenmann, U. 2003 Msngr 114, 20
- Mayor et al. (2009) Mayor, M., Bonfils, X.;, Forveille, T., Delfosse, X., Udry, S, Bertaux, J.-L., Beust, H., Bouchy, F., Lovis, C., Pepe, F., Perrier, C., Queloz, D., Santos, N.C. 2009 A&A 507, 487
- McMillan et al. (1993) McMillan, R. S., Moore, T. L., Perry, M. L., & Smith, P.H. 1993, ApJ, 403, 801
- Meggers (1957) Meggers, W.F., 1957 in Oosterhoff P.T., ed Trans. IAU Vol. 9 proceedings of the Ninth General Assembly, Cambridge Univ. press, cambridge, p225
- Meunier et al. (2010) Meunier N., Desort M., Lagrange A. -M., 2010 A&A 512, A39
- Mitchell et al. (1991) Mitchell, W. E., Jr., and Livingston, W., C., 1991, ApJ, 372, 336
- Molaro et al. (2008) Molaro, P., Levshakov, S. A., Monai, S., et al. 2008, A&A, 481, 559
- Molaro et al. (2008b) Molaro, P. , Reimers, D. ,Agafonova, I. I. and Levshakov, S. A. 2008, EPJ, 163, 173
- Molaro and Monai (2012) Molaro, P. , Monai, S., 2012 A&A 544,125
- Molaro and Centurion (2011) Molaro, P. , Centurion, M., 2011 A&A 525, A74
- Murphy et al. (2007) Murphy, M. T.; Udem, Th.; Holzwarth, R.; Sizmann, A.; Pasquini, L.; Araujo-Hauck, C.; Dekker, H.; D’Odorico, S.; Fischer, M.; Hänsch, T. W.; Manescau, A. 2007 MNRAS 380, 839.
- Murphy et al. (2007b) Murphy, M. T., Tzanavaris, P., Webb, J. K., & Lovis, C. 2007, MNRAS, 378, 221
- Murphy et al. (2006) Murphy, M. T., Webb, J. K., & Flambaum V.V. 2006, arXiv: 0612407
- Nidever et al. (2002) Nidever, D. L., Marcy, G. W., Butler, R.P., et al., 2002, ApJS, 141, 503
- Nordström et al. (2004) Nordström, B., Mayor, M., Andersen, J., et al., 2004, A&A, 418, 989
- Palmer (1983) Palmer, B. A., Engleman, R. 1983, LA, Los Alamos: National Laboratory, —c.
- Palle et al. (2013) Pallé, P.L., and Cortés T. Roca 2013 Highlights of Spanish Astrophysics VII, Proceedings of the X Scientific Meeting of the Spanish Astronomical Society (SEA), held in Valencia, July 9 - 13, 2012, Eds.: J.C. Guirado, L.M. Lara, V. Quilis, and J. Gorgas., pp.750-761
- Pepe et al. (2005) Pepe, F., Mayor, M., Queloz, D., et al. 2005, The Messenger, 120, 22
- Phillips et al. (2012) Phillips, D., Glenday, A., Li, C., Cramer, C., Furesz, G. Chang, G., Benedick, A., Chen, L., Kärtner, K., Korzennik, S., Sasselov, D., Szentgyorgyi, A., and Walsworth, R., 2012, Opt. Express 20, 13711-13726.
- Redman et al. (2013) Redman, S. L., Nave, G., Sansonetti C., J. 2013 arXiv:1308.5229v1
- Steinmetz et al. (2008) Steinmetz, T., Wilken, T., Araujo-Hauck, C., et al. 2008, Science, 321, 1335
- Stetston and Pancino (2008) Stetston, P. B. Pancino, E. 2008 PASP 120, 1332
- Thomas et al. (2005) Thomas, P.C., Parker J. Wm., McFadden, L.A., Russel C. T., Stern S. A. Sykes M. V. and Young E. F., 2005, Nature 437, 224
- Wallace et al. (2011) Wallace L., Hinkle, K., Livingston W.C., Davis, S.P., N. S. O. Technical Report N. 11-001 Published 2011, by National Solar Observatory, P. O. Box 26732, Tucson AZ 85726
- Wilken et al. (2010b) Wilken, T. et al., 2010 MNRAS 405, 16
- Wilken et al. (2010a) Wilken, T. et al., 2010 SPIE.7735E..28W
- Wilken et al. (2012) Wilken, T et al., 2012 Nature 485, 611.
- Ycas et al. (2012) Ycas, G., Quinlan, F., Diddams, S. Osterman, S. Mahadevan, S. Redman, S., Terrien, R., Ramsey, L., Bender,C., Botzer, B., and Sigurdsson, S., 2012 Opt. Express 20, 6631-6643.