G2C2 II: Integrated colour-metallicity relations for Galactic Globular Clusters in SDSS passbands
Abstract
We use our integrated SDSS photometry for 96 globular clusters in and , as well as and photometry for a subset of 56 clusters, to derive the integrated colour-metallicity relation (CMR) for Galactic globular clusters. We compare this relation to previous work, including extragalactic clusters, and examine the influence of age, present-day mass function variations, structural parameters and the morphology of the horizontal branch on the relation. Moreover, we scrutinise the scatter introduced by foreground extinction (including differential reddening) and show that the scatter in the colour-metallicity relation can be significantly reduced combining two reddening laws from the literature. In all CMRs we find some low-reddening young GCs that are offset to the CMR. Most of these outliers are associated with the Sagittarius system. Simulations show that this is due less to age than to a different enrichment history. Finally, we introduce colour-metallicity relations based on the infrared Calcium triplet, which are clearly non-linear when compared to and colours.
keywords:
Galactic Globular Clusters1 Introduction
Globular clusters (hereafter GCs) form during the earliest stages of galaxy formation. In nearly all galaxies that have been studied, GCs follow a nearly universal luminosity function (e.g., Rejkuba, 2012), exhibit a bimodal colour distribution (e.g., Zepf & Ashman 1993; Ostrov et al. 1993; Whitmore et al. 1995; Mieske et al. 2006; Peng et al. 2006; Strader et al. 2006; Mieske et al. 2010; Faifer et al. 2011; Yoon et al. 2011b and references therein) and a strong correlation between the number of globular clusters and the luminosity of their parent galaxies (specific frequency –Harris & van den Bergh 1981). These all imply that the formation of globular clusters has been intimately related to the early assembly history of galaxies (Harris, 1991). Therefore, the properties of globular clusters allow us to use them as fossil tracers of the initial stages of galaxy formation and evolution (see West et al. 2004 and Brodie & Strader 2006 for reviews).
Although most globular clusters show evidence of extended star formation and enrichment histories (see review by Gratton et al. 2012), the vast majority are nevertheless almost homogeneous in iron (Marino et al., 2013) and have large ages ( Gyr, Chaboyer et al. 1998; Strader et al. 2005; Puzia et al. 2005), making them still the best available approximation of single stellar populations. Their integrated colours are largely dominated by light from K-giants and this allows for a more straightforward interpretation (in terms of age, metallicity, etc.) than the more complex stellar populations of galaxies.
The bimodal distribution of GC colours corresponds, at least in our Galaxy, to a bimodal distribution of metallicities (e.g. Zinn, 1985), with blue clusters being more metal poor than their red counterparts. Moreover, these two GC populations are also kinematically distinct (Sharples et al., 1998; Zepf et al., 2000; Côté et al., 2001, 2003; Peng et al., 2004; Strader et al., 2011; Pota et al., 2013). However, it is still uncertain whether the bimodal distributions of GC colours observed in more distant galaxies can be generalized into bimodal metallicity distributions (Cantiello & Blakeslee, 2007; Galleti et al., 2009; Foster et al., 2010, 2011; Alves-Brito et al., 2011; Caldwell et al., 2011; Chies-Santos et al., 2011a, b; Usher et al., 2012). There is no colour that yields a univocal mapping to metallicity. Yoon et al. (2006) and Richtler (2006) showed that a non-linear relation between metallicity and integrated colour can transform a unimodal metallicity distribution into a bimodal colour distribution. Vice versa, Yoon et al. (2011a) demonstrated that the bimodal colour distributions could be transformed into metallicity distributions consisting of a sharp peak with a metal-poor tail, similar to the metallicity distribution functions of resolved field stars in nearby elliptical galaxies (e.g. Harris & Harris, 2002).
Colour-metallicity relations (CMR), calibrated to objects of known metal abundance are essential to correctly interpret the colour distributions in external galaxies. The first empirical relationships between colour and [Fe/H] were approximately linear (Brodie & Huchra, 1990; Couture et al., 1990; Kissler-Patig et al., 1997, 1998), while more recent studies tend to prefer non-linear CMRs (Peng et al., 2006; Blakeslee et al., 2010; Sinnott et al., 2010; Usher et al., 2012). Faifer et al. (2011) find a linear CMR, but their sample was lacking in metal-poor GCs, which are the clusters invoking the non-linearity of the CMRs.
Some stellar population models also predict a non-linear CMR (Yoon et al., 2006, 2011a, 2011b; Cantiello & Blakeslee, 2007) and studies based on optical-NIR colours (Chies-Santos et al., 2012; Blakeslee et al., 2012) provide further evidence that the non-linearity of the CMR is unavoidable even in the presence of unimodal metallicity distributions. Moreover, the metallicity distributions seem usually less bimodal than the optical colour distributions, which suggests that at least part of the observed colour bimodality is caused by the nonlinearity of the CMR (Blakeslee et al., 2012). Although most of these studies agree on the non-linear form of the CMR, further data sets are indispensable to extend the metallicity range, to better calibrate the CMR and to capture its details.
In Vanderbeke et al. (2013, in press, hereafter Paper I) we have presented integrated photometry for 96 globular clusters in SDSS passbands and , as well as and photometry for a subset of 56 clusters. This paper discusses the dataset and the error statistics of the sample. Here we use these data to construct the Galactic colour-metallicity relation. We discuss the CMRs for the different colour combinations in Section 2 and study the influence of (differential) reddening, horizontal branch (HB) morphology, age, present-day mass function variations, structural parameters and contamination correction on the scatter in the CMR. In Section 3 we investigate the colour bimodality of our sample, and summarize the results in Section 4.
2 The colour-metallicity relation for Globular Clusters
We use the photometry described in detail in Paper I to refine the colour-metallicity relations for GCs. For some clusters, both SDSS and CTIO magnitudes were obtained. Motivated by the findings of Paper I, we use CTIO magnitudes in all cases, except for Pal 3 and Pal 13. For Galactic clusters, metallicities are taken from the compilation of Harris (1996), using the latest version, and are based on the Carretta et al. (2009) scale supplemented with data from Armandroff & Zinn (1988). However, our Galaxy lacks the high metallicity (solar or more) GCs that are encountered in bright cluster ellipticals; following Peng et al. (2006) and Blakeslee et al. (2010) we will supplement our data with photometry (and metallicities) for globular clusters in M 49 and M 87, taken from the SDSS and the ACS Virgo Cluster Survey (Côté et al., 2004) in Section 2.3. There is also a lack of very metal-poor clusters in both the Galactic and extragalactic samples; some globular clusters in dwarf spheroidals appear to be more metal-poor than the most extreme such objects in our Galaxy.
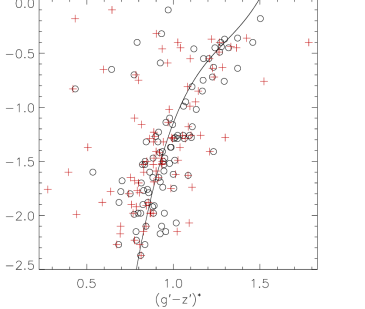
In Fig. 1 we present [Fe/H] as a function of for 96 Galactic GCs. Red filled circles represent CTIO photometry, blue filled circles are used for clusters with SDSS data. The previous CMRs from Blakeslee et al. (2010) and Sinnott et al. (2010) are shown as grey and green lines. For completeness, we show all clusters in Fig. 1, but only the clusters with extinction (Harris, 1996) are used to fit the CMR.
We fit a straight line to the data using the method of least absolute deviation (robust fitting) as this is less sensitive to outliers (Armstrong & Tam Kung, 1978). The best robust fit to the CTIO data only is given by:
| (1) |
and is represented by a red line in the figure, while the best fit to both SDSS and CTIO data is given by:
| (2) |
which is the purple line in Fig. 1. The errors on the coefficients are computed by a bootstrap method. We note that the CMR of Blakeslee et al. (2010) seems to overestimate [Fe/H] for the relatively more metal-rich clusters, while our linear relations do not fit well the metal-poor end of the metallicity range. There is considerable scatter around the relation, more than would be expected simply from photometric errors. This appears to be related to foreground reddening and is discussed in detail in Section 2.4.
SDSS data for low-reddening clusters show more scatter around the existing relations than the corresponding CTIO data. When computing the horizontal RMS for these two subsamples with respect to the CMR of Blakeslee et al. (2010), we find a RMS of 0.14 for the low-reddening CTIO subsample, but a RMS of 0.20 for the low-reddening SDSS subsample. This might be due to the saturation issues for SDSS data discussed in Paper I. On the metal-rich side, four low-reddening clusters are offset from the relation. These clusters are E 3 and Terzan 7 (CTIO data) and Whiting 1 and Pal 1 (SDSS data). In Paper I we raised some sky determination issues which affect the obtained magnitudes of E 3 and Terzan 7. For the position in colour-metallicity space of these and other clusters, we refer to Fig. 5. These and other outliers are discussed in Section 2.1.
Due to the sizable scatter, the limited metallicity range and the low sample size, it is not justifiable to fit a higher-order polynomial to the Galactic data. The linear fit is a reasonable approximation for the Galactic data only, when considering the limitations of the sample. The fit however is not satisfactory, thus we will address this issue again in Section 2.3, where we will include extragalactic data from the literature to extend the metallicity range and the sample size.
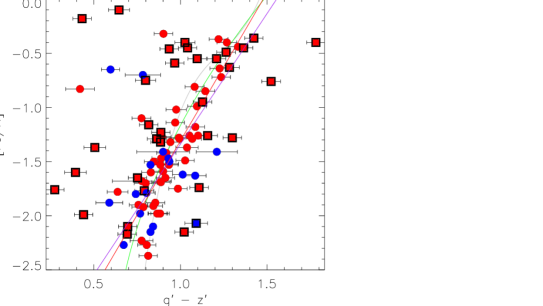
Fig. 2 shows the CMR for the colour. As a reference, the CMRs published in Sinnott et al. (2010) and Usher et al. (2012) are presented as green and cyan lines. Sinnott et al. (2010) presented a CMR for clusters in NGC 5128, using Milky Way clusters to convert their [MgFe]′ index to [Fe/H], but their CMR has not been compared to colours for Galactic GCs. It is generally assumed that Galactic GCs are not intrinsically different from extragalactic GCs (e.g. Foster et al., 2010), although Usher et al. (2012) note that differences in the CMR could be driven by differences in the age or the IMF of GCs between galaxies. These possibilities will be further discussed in Sections 2.6 and 2.7.
Galactic GC colours based on CTIO data compare well to the extragalactic CMR of Sinnott et al. (2010). Only clusters suffering severe reddening are outliers. The two low-reddening metal-rich GCs based on SDSS data are Whiting 1 (associated to the Sagittarius system) and Pal 1. For E 3 and Terzan 7, discussed above, no -band observations were performed. Nevertheless, it is clear again that the low-reddening SDSS data has more scatter around the Sinnott et al. (2010) CMR than the low-reddening CTIO data. NGC 5272 and NGC 6205 are the low-reddening outliers at with small photometric uncertainties. This reinforces the suspicion that the SDSS magnitudes of bright clusters are affected by saturation of their bright stars (as discussed in Paper I). We will discuss this further in a future paper dealing with the colour-magnitude diagrams.
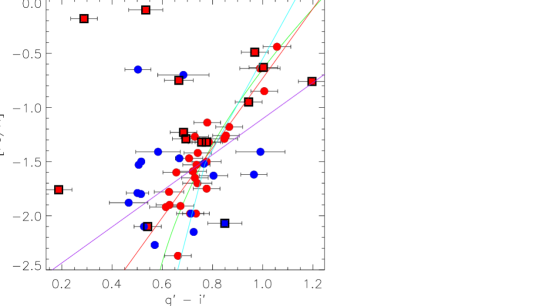
The best robust fit for the CTIO data only is given by
| (3) |
while including the SDSS data results in
| (4) |
Errors on this relation were determined using a bootstrap method. It is clear that the relation based on CTIO data only compares well to the extragalactic relation published by Sinnott et al. (2010), while the scatter in the SDSS data results in an inconsistent fit when using all available data. The relative lack of metal-poor clusters makes it hard to constrain the metal-poor part of the CMR.
Usher et al. (2012) proposed a broken line fit as their [Z/H]- relation (their Eq. 10) and give a conversion between [Z/H] and [Fe/H] (their Eq. 1). Plotting this relation as a cyan line on Fig. 2 we find that their relation predicts slightly redder colours for metal-poor clusters than our observed colours. Nevertheless, our sample has only a couple of metal-poor objects with available colours.
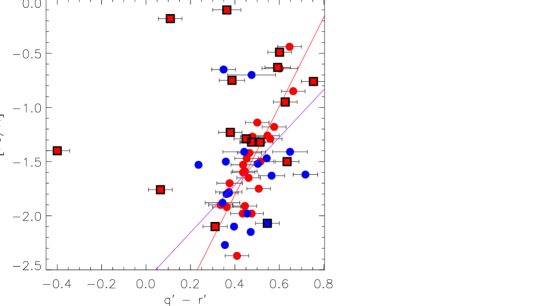
Fig. 3 presents [Fe/H] as a function of for 58 GCs. Again, the more significant outliers are affected by high foreground reddening, and, the scatter for low-reddening GCs in the SDSS data is significantly larger than for the CTIO data. When robustly fitting the low-reddening CTIO data, we find:
| (5) |
while including the SDSS data results in
| (6) |
In this colour the CMR is even closer to being linear, which is expected when considering the limited wavelength baseline of and hence its relatively weak sensitivity to metal abundance.
2.1 Outliers in the CMR
We here discuss briefly the properties of some of the most significant low-reddening outliers from the Galactic CMR.
As discussed in Paper I, E 3 and Terzan 7 are very poor clusters and were both observed with the CTIO 0.9 m telescope during conditions with the sky having a higher surface brightness than the average cluster surface brightness (sky-subtracted, within the half-light radius). As a consequence, small variations in the sky determination can significantly affect the obtained magnitudes. Moreover, E 3 suffers from considerable extinction along the line of sight ().
Pal 4, a GC initially suspected to be a dwarf galaxy, is one of the only low-reddening globular clusters which has a colour redder than expected based on its metallicity. However, this offset can be partly explained by its large colour uncertainty ().
Both Whiting 1 and Pal 1 are faint clusters, resulting in very poor CMDs. For the sake of completeness, we provide more details on the photometric analysis performed in Paper I for the latter clusters. For Whiting 1, one candidate non-member star was selected in the CMD but had no proper motions, so the star was not removed. Pal 1 is located at a Galactic latitude of (resulting in a foreground reddening of ), so some foreground stars are expected. Based on the CMD, seven candidate outliers were selected in the same colour-magnitude region, five of which had known proper motions in the NOMAD catalog (Zacharias et al., 2005), including the four brightest candidates. We decided to remove all seven candidate outliers (because all candidates are in the same CMD region), which resulted in magnitude corrections as presented in Paper I. Not performing the magnitude corrections would result in , thus moving the cluster towards the CMR (to a position close to Whiting 1).
Despite the photometric uncertainties, it is interesting to discuss these clusters in some more detail. In their study of the Galactic outer halo, van den Bergh & Mackey (2004) found several similarities for the properties of Pal 1 and Terzan 7 (e.g. ), suggesting that these clusters have similar formation and evolutionary histories. These authors explain the existence of such metal-rich GCs in the outer Galactic halo by a formation in dwarf spheroidal galaxies. This appears probable for Terzan 7, a cluster often associated with the Sagittarius system (e.g. Geisler et al. 2007). Moreover, these clusters have estimated ages lower than 8 Gyrs (Rosenberg et al. 1998; Geisler et al. 2007). Hence, it is possible that these clusters are outliers on the CMR, because they have a different formation history. Forbes & Bridges (2010) associated Pal 1 as a probable member of the Canis Major dwarf and confirm the similarities between Pal 1 and the Sagittarius dSph GCs in their age-metallicity relation. Nevertheless, other GCs associated by Forbes & Bridges (2010) to the Canis Major system (including NGC 1851, NGC 1904, NGC 2298, NGC 2808, NGC4590 and Rup 106) are very close to the CMR of Blakeslee et al. (2010).
Whiting 1 is another young ( Gyr) GC associated with the Sagittarius dwarf spheroidal galaxy, hence another object that originated in a dwarf galaxy that has since been disrupted by the tidal forces of the Milky Way (Carraro, 2005; Carraro et al., 2007). This intermediate-metallicity object is clearly offset of the CMR presented in Fig. 1.
Lotz et al. (2004) find that dE GC candidates are as blue as the metal-poor GCs of the Milky Way. In the discussion, these authors assume that their sample of dE GCs is dominated by old and metal-poor GCs. However, in the above analysis, Pal 1, Whiting 1 and Terzan 7 are younger GCs at intermediate metallicities, associated with dSph galaxies. This again stresses the peculiarity of these objects.
2.2 Calcium Triplet metallicity scale
Though gaining importance and attention, the infrared Calcium Triplet (CaT) is not yet generally accepted as a metallicity indicator (e.g. Foster et al., 2010; Usher et al., 2012, and references therein). Nevertheless, homogeneous CaT measurements from Saviane et al. (2012) allow us to produce a CMR based on our colours and metallicity based on this indicator.
In this section we compare our colours with , which is the sum of the equivalent widths of the two strongest CaT lines () corrected for the HB level (, Armandroff & Da Costa 1991). Fig. 4 presents the CMR for the CaT parameter as a function of the colours. Some of the findings of the previous section are confirmed: the scatter for the SDSS data is larger than for the CTIO data and for the CTIO data, the scatter is closely related to the reddening estimate. Although the metallicity range is limited, the figure suggests that is non-linear with and . Even for the relation seems slightly non-linear. Nevertheless, it is again clear that this latter colour has a relatively weak sensitivity to metal abundance, as a consequence of its limited wavelength baseline.
Based on the transmission curves, one would expect that is the colour most sensitve to , because both and fall within . Indeed, for the clusters with available photometry, shows the largest dynamic range.
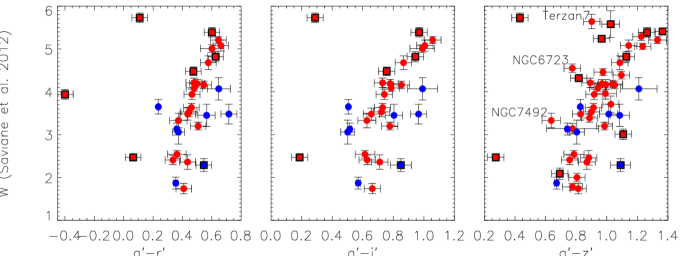
Terzan 7, one of the GCs associated to the Sagittarius system, is the metal-rich low-reddening cluster which is the outlier with respect to the general relation in . Note that Terzan 7 was also an outlier in the CMR presented in Fig. 1.
2.3 The colour-metallicity relation including Extragalactic Globular Clusters
The Milky Way lacks both very metal-poor and very-metal rich GCs. Here we address the issues raised in the previous sections by including extragalactic GCs from the literature. Peng et al. (2006) presented colours for GCs in the giant ellipticals M 49 and M 87, for which spectroscopic metallicities were published in Cohen et al. (1998, 2003). These clusters are added to our Galactic sample; they provide extra leverage especially at the metal-rich end of the relation.
We present all available data in Fig. 5. Several Galactic GCs suffer from high reddening () and are indicated with boxes in the figure. For clarity, no error bars are presented in this figure. We also show, in the same figure, CMRs from the literature.
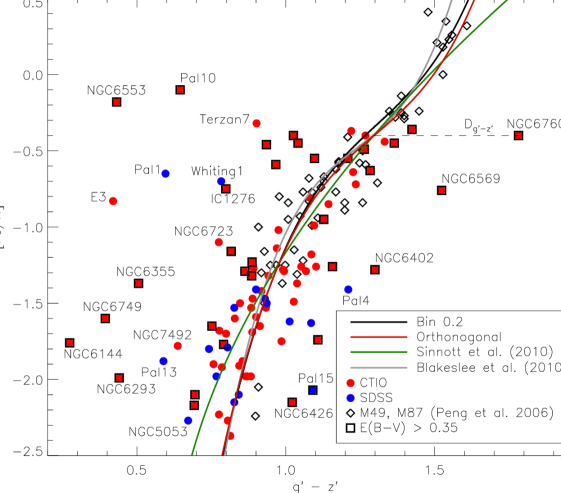
In the previous sections it became clear that most of the scatter in the CTIO data is caused by the uncertainty in the reddening correction, which will be scrutinised in Section 2.4 (while for SDSS data saturation may also play a role). Therefore we exclude clusters with high reddening to make the fits. Because the scatter in colour is still significant, we binned the data points in bins of 0.2 dex in metallicity. We then computed the median colour for each bin, obtaining a representative colour for each metallicity bin and fitted a cubic polynomial to the binned data. This resulted in a CMR:
| (7) |
which is plotted as a black solid line in Fig. 5. Note that the uncertainties on the coefficients are large because of the small number of degrees of freedom and because we use the bin size as the metallicity uncertainty in the bootstrapping routine. Using the homogeneous Saviane et al. (2012) [Fe/H] values where possible does not significantly change the fitted relation. Compared to Blakeslee et al. (2010) we find good agreement over the metallicity range considered. When comparing our CMR to Sinnott et al. (2010), there are larger differences on both the metal-poor and metal-rich end. This is partly due to the fact that Sinnott et al. (2010) used a different metallicity range for their fit ( [Fe/H] ). Nevertheless the two CMRs compare reasonably well up to [Fe/H]. On the blue end of the relation, the difference is somewhat larger, stressing the importance of obtaining additional data at the low metallicity end.
As has been discussed in Section 2.1, some clusters are strong outliers: Whiting 1, Terzan 7 (clusters associated with the Sagittarius dSph) and Pal 1 (probably related to the Canis Major system). Another outlier is E 3, an old cluster with uncertain photometry. We make a new subset, excluding these clusters from the low-reddening sample. Using this subset, we performed an optimization algorithm in python, minimizing the orthogonal distance to the CMR. This resulted in our final CMR:
| (8) |
presented as a red line in Fig. 5. This relation compares very well to the binned relation given by Eq. 7, with all coefficients within the error bars. Compared to the CMR of Sinnott et al. (2010), there is a significant offset at both the metal-rich and metal-poor end.
Visual inspection might suggest that the [Fe/H] range of to reveals a larger spread in for the M 49 and M 87 GCs than for the MW GCs. However, this is misleading, as the overall RMS for the extragalactic GCs is 0.069, while the RMS for the extragalactic GCs with [Fe/H] between and equals 0.074. Note that the RMS for the low-reddening Galactic GCs amounts 0.16.
2.4 Colour uncertainties due to Reddening
It is clear from Fig. 1 that most of the CMR outliers, which are not related to dSph galaxies or do not have uncertain photometry, suffer from high reddening. Note that not only Galactic studies suffer from this issue: Kim et al. (2013) also indicate that colours of M 31 GCs are very susceptible of reddening uncertainties. This resulted in colour scatter so large that no meaningful comparison could be made with their models.
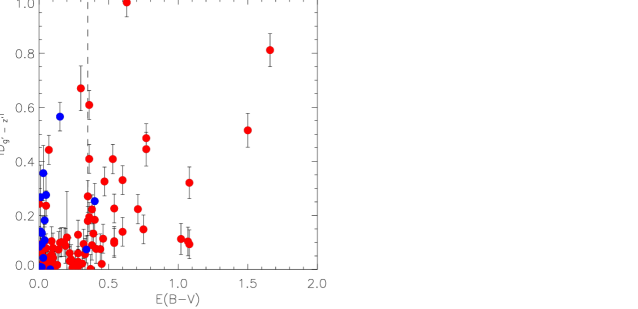
To get a handle on the error introduced by the reddening estimates, we define a new parameter, which is the colour difference between the final CMR (Eq. 8) assuming the metallicity is accurately known and the observed colour:
| (9) |
as indicated in Fig. 5. This new parameter is positive (negative) when the observed colour is bluer (redder) than the colour predicted by our final CMR. In Fig. 6 we plot the distance to the CMR as a function of the reddening (from Harris 1996 (2010 edition), which is a compilation of Reed et al. 1988; Webbink 1985 and Zinn 1985). It is clear that a significant part of the scatter is caused by the uncertainties in the reddening estimates. Note that the scatter is relatively larger for low-reddening clusters with SDSS data than with CTIO data.
To get a better notion of the uncertainty on the reddening estimate, we present in Fig. 7 the absolute difference between the reddening corrections based on Cardelli et al. (1989) (C89) and Schlafly & Finkbeiner (2011) (S11, which was used in Paper I) with:
| (10) | |||||
| (11) |


We find, as expected, that the reddening corrections and uncertainties are much larger in the -band than in the -band and that both reddening estimates generally compare well for and . Higher reddenings are more unreliable, probably reflecting the patchiness of the extinction and irregular distribution of dust clouds. For NGC 6144, NGC 6256, NGC 6544 and NGC 6553 we find and .
To further scrutinize the reddening issue, we introduce another new parameter:
| (12) |
In practice, results in colours which are redder if we would use the Cardelli et al. (1989) reddening law instead of the updated maps by Schlafly & Finkbeiner (2011) to correct for the reddening.
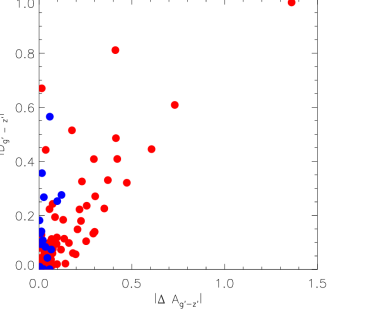
In the left panel of Fig. 8 we compare the absolute scatter in the CMR as a function of the absolute value of this new parameter. The clusters with low and large are Pal 1, Whiting 1, Terzan 7 and E 3. The origin of these large offsets was discussed in more detail in Section 2.1.
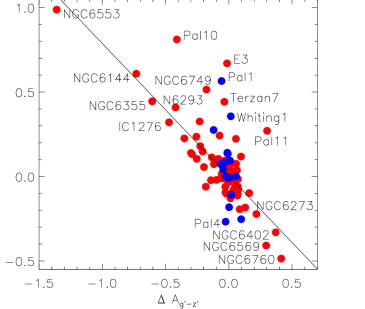
The right panel of Fig. 8 presents the scatter about the CMR as a function of . Surprisingly, correlates with . This is unexpected: in fact it predics that, when:
the colour (based on the Schlafly & Finkbeiner 2011 extinction coefficients) is too blue and results in . This demonstrates that the scatter around the CMR and the reliability of the extinction estimate are intimately related. Moreover, GCs located at Galactic latitude (including Pal 10, NGC 6553, NGC 6355 and NGC6760) are known to have unreliable extinction estimates (Schlafly & Finkbeiner, 2011).
Again, E 3, Pal 1, Terzan 7 and Whiting 1 do not follow the general trend. Nevertheless, some other clusters also do not follow the relation either: Pal 10, Pal 11 and NGC 6749 all suffer high extinction (, 0.35 and 1.50, respectively). For these clusters, it is not the difference between the reddening estimates of Cardelli et al. (1989) and Schlafly & Finkbeiner (2011) that causes the offset in the CMR. However, as these are high reddening clusters, it does illustrate again that the scatter in the CMR scales with the reddening.
We made a robust fit of as a function of and obtain
| (13) |
plotted as a black line in Fig. 8. We can use this relation to correct the colours:
or
| (14) |
with and the calibrated but not reddening corrected magnitudes.
Fig. 9 presents a CMR for , which are represented as black circles. For reference, the colours are given as red crosses. Note the huge difference for e.g. NGC 6553, a high-metallicity cluster with a colour correction of more than 1 magnitude. It is clear that the scatter is significantly reduced: the horizontal RMS for the colour is 0.24, while it is 0.16 for the corrected colour. This suggests that a combination of the C89 and S11 reddening laws results in a better extinction estimate. Moreover, the horizontal RMS for the colour is also 0.16 when we limit the sample to GCs with . Nevertheless, not all GCs are moved towards the CMR by applying the reddening correction of Eq. 14. Pal 11 is a high-reddening 10.4 Gyr old GC (Lewis et al., 2006) that scatters off the CMR when applying this correction. E 3, Pal 1, Terzan 7 and Whiting 1 are not affected by the reddening correction. Again, their position in the figure suggests another evolutionary history and younger ages.
Pal 10, another high reddening GC () in the Sagittarius constellation, is moved towards but not on the CMR by the reddening correction. It is notable that the difference between the corrected colour and the CMR is similar to the difference for Terzan 7 and Whiting 1, which are associated to the Sgr dSph.
Some GCs suffer from substantial differential reddening (Heitsch & Richtler, 1999; Alonso-García et al., 2012). To estimate the contribution of the differential reddening to the photometric error and to the scatter in the CMR, we present in Fig. 10 the absolute distance to the CMR as a function of the differential reddening (obtained from Alonso-García et al. 2012, supplemented with data from Contreras Peña et al. 2013 for NGC 6402). Some of the clusters with show large offsets from the CMR, while clusters with relatively low differential reddening () are all close to the CMR. NGC 6553, NGC 6144 and NGC 6355 are clusters with . NGC 6287 has , but lies remarkably close to the CMR. The large values could suggest that the differential reddening is affecting the reddening estimate for the entire cluster. Nevertheless, NGC6402, NGC 6273, NGC 6553, NGC 6144 and NGC 6355 are right on the relation presented in the right panel of Fig. 8, suggesting that combining both Cardelli et al. (1989) and Schlafly & Finkbeiner (2011) reddening laws could resolve the issue.

In a future paper, we will determine the reddening by fitting isochrones to the colour-magnitude diagrams and further discuss this issue.
2.5 The Effects of Horizontal Branch morphology
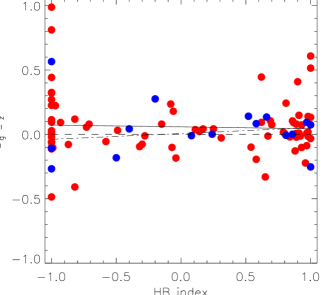
Yoon et al. (2006) studied the influence of HB morphology on GC colours and indicated that HB stars are the main drivers behind the non-linearity of the CMR. The CMR presented in Eq. 8 is clearly non-linear and should account for the influence of the HB stars. However, to check whether the HB morphology contributes to the scatter around the CMR we plot in Fig. 11 the colour difference as function of the HB morphology index (, Lee 1990; Lee et al. 1994) of Mackey & van den Bergh (2005) for 78 GCs. The best fit relation
| (15) |
is not statistically significant and is given by the solid line in Fig. 11. The HB index becomes insensitive to the HB morphology for very blue and very red HBs (Catelan et al., 2001, and references therein), which are the ranges which are best populated in our GC sample. Motivated by this argument, we restrict the HB index range to to fit the data and find
| (16) |
presented by the dash-dot line in the same figure. Again, this relation is statistically not significant, which indicates that the non-linear CMR does account well for the influence of the HB morphology on the cluster colour.
To further investigate the effects of the HB morphology we list in Table 1 some clusters with similar metallicities but different HB structure, the so-called ’second parameter objects’ (e.g. Catelan et al. 2001; Caloi & D’Antona 2005). For NGC 288 and NGC 362, one of the best studied ’second parameter pairs’ of GCs, we find a blue (red, respectively) offset from the CMR, as could be expected from the HB morphology of these clusters. The same holds for NGC 6205 and NGC 7006, while this is not the case for NGC 5272. In most cases is smaller than the colour uncertainties; therefore, we conclude that the effect of the HB morphology on the integrated colour is reasonably well accounted for by the non-linear CMR.
2.6 Age as possible cause for the scatter in CMR
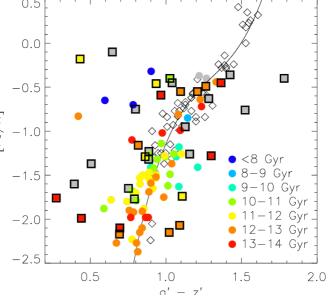
In Section 2.1, discussing the young GCs associated to the Sagittarius and Canis Major system, we already considered age as possible contributor to the scatter in the CMR. In this section, we will discuss this issue in some more detail, concentrating on both high-reddening and low-reddening clusters. Recently, Forbes & Bridges (2010) made a compilation of the most reliable ages published to date (based on results of Salaris & Weiss 1998; Bellazzini et al. 2002; Catelan et al. 2002; De Angeli et al. 2005; Carraro et al. 2007; Marín-Franch et al. 2009). We add new ages for IC4499, Pal 15 and NGC7006 from Dotter et al. (2011), NGC6293 (Lee & Carney, 2006), NGC6402 (Paust & Chaboyer, 2011), NGC6553 (Ortolani et al., 1995), Pal 11 (Lewis et al., 2006) and Pal 13 (Trouille & Chaboyer, 2002). Note that Vandenberg et al. (2013) do not give an age estimate for Pal 1, Terzan 7 and E 3, because of the poor quality of the available CMDs.
Fig. 12 presents [Fe/H] as a function of the colour, with the clusters being colour-coded depending on their age. Three young low-reddening GCs (Terzan 7, Pal 1 and Whiting 1) were associated with the Canis Major and Sagittarius systems. For the old GC E 3, we discussed in Section 2.1 the photometric uncertainties for the observations of this faint cluster, which suffers significant foreground extinction ().
To pinpoint the influence of age on the colour for the younger GCs, we integrated PARSEC (v1.1) isochrones from Bressan et al. (2012) with a Kroupa (1998) IMF corrected for binaries111http://stev.oapd.inaf.it/cgi-bin/cmd. For Pal 1 and Whiting 1 (with [Fe/H] and an age about 7 Gyr), we used a metallicity and obtained SSP integrated , much redder than the observed and (respectively). For Terzan 7 (with [Fe/H] and age of 7.3 Gyr) we adopted . For this combination, the models predict , much redder than based on our observations. The models confirm that the colours of GCs, older than a few Gyrs, are totally dominated by the RGB, which is populous and bright. At old-enough ages it is only the metal abundance that sets the colour of the RGB, suggesting that Pal 1, Whiting 1 and Terzan 7 are peculiar clusters with a different chemical enrichment history. This will be further discussed in Section 2.10.
It is clear that age is not the main contributor to the scatter in the CMR. Several old high-reddening clusters are offset of the relation (e.g. NGC 6144, NGC 6293, NGC 6402). Pal 15 and NGC 6426 are distant, high-reddening GC (with signs of differential reddening) and are coeval with all other metal-poor GCs, with ages estimated about 13 Gyrs (Dotter et al., 2011). The metal-rich outlier with an age of 12 Gyr is NGC6553, suffering significant differential reddening, as was described in Section 2.4.
2.7 Do mass function variations play a role?
In Section 2.6, we quietly assumed that the GC initial mass function (IMF) is well represented by a Kroupa (1998) IMF. Although the IMF of the Milky Way field stars is mostly consistent with Salpeter (1955) or Kroupa IMFs (Bochanski et al., 2010), recent studies discuss the possibility of IMF variations (e.g. Conroy & van Dokkum 2012 and references therein). Paust et al. (2010) suggested that the observed variations of GC present-day mass functions (MF) are related to dynamical evolution, while Marks et al. (2012) claim IMF correlations with cluster density and metallicity.
Recently, Hamren et al. (2013) gathered the MF slopes published to date (based on results of Paust et al. 2010; Rosenberg et al. 1998; Bellazzini et al. 2012; Frank et al. 2012; Pulone et al. 2003; Dotter et al. 2008; Cote et al. 1991; Grillmair & Smith 2001; Jordi et al. 2009; De Marchi et al. 2007; Capaccioli et al. 1991; Grabhorn et al. 1991; Paust et al. 2009; Saviane et al. 1998; Milone et al. 2012). These authors used a single-sloped power law MF in the form (implying for the classic Salpeter (1955) MF) and cover masses of the present day mass function, which are the stellar masses remaining in old clusters.
In Fig. 13 we plot the colour difference (defined in Eq. 9) as a function of the MF power law slope for 34 GCs. The clusters are colour-coded with age as in Fig. 12. Pal 5 is indicated with an arrow, because only an upper limit for the MF slope was given. Making a robust fit to the data results in
| (17) |
which is represented by the solid line in Fig. 13. Limiting the fit to the low-reddening () clusters does not alter the fit and using the extinction corrected colours (defined in Section 2.4) confirms the correlation.
Despite the significant scatter among the relation, Pal 1 and Pal 4 are the strongest outliers. Both clusters are faint, resulting in for Pal 1 and for Pal 4. Remark that the magnitudes obtained for Pal 1 and Pal 4 are based on SDSS data. Therefore, their colours did not suffer from the complications regarding the CTIO sky determination (as discussed in Paper I). Excluding these clusters to make a robust fit we find
| (18) |
fully consistent with Eq. 17. Nevertheless, if we use the colours excluding Pal 1 and Pal 4, the slope of the relation does become more shallow and is only different from zero at the 1.6 level.
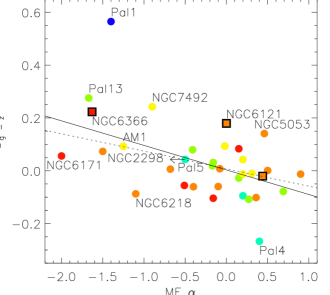
The MF slope for Whiting 1 is not given by Hamren et al. (2013). Nevertheless, Carraro et al. (2007) found that the luminosity function of Whiting 1 is remarkably flat and suggest that the cluster has experienced tidal stripping by the Milky Way. If the mass function is confirmed to be approximately flat, this cluster would be located close to Pal 1 in Fig. 13 and would follow the general trend given by Eq. 17: GCs with more bottom-light MFs show a blue offset to the CMR.
Other GCs showing evidence for tidal stripping by the Milky Way include Pal 5 (Koch et al., 2004) and Pal 13 (Côté et al., 2002). Remark that both clusters follow the general trend (given by Eq. 17), although the slope of the MF for Pal 5 is just an upper limit.
Remark that NGC 5053, a GC likely associated with the Sgr dSph by Law & Majewski (2010) shows a blue offset to the CMR. Nevertheless, Eq. 17 predicts a negligible colour difference based on the MF slope found by Paust et al. (2010).
Although the coefficients in Eqs. 17 and 18 are significantly different from zero, we are prudent to conclude any correlations between MF variations and the CMR offset are real. These correlations would not imply the MF varies with metallicity, they only suggest the colour offset to the CMR is related to the MF.
2.8 Influence of structural parameters in the CMR scatter
In this section, we study the CMR scatter and its relation to the structural parameters, which relate to the evolutionary history of the GCs.
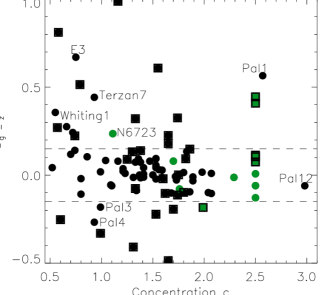
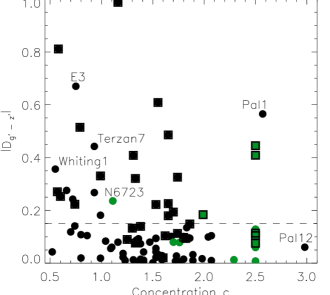
Fig. 14 presents the colour difference and absolute colour difference (as defined in Eq. 9) as a function of the concentration c (obtained from the compilation of Harris 1996 (2010 version), which is based on values taken from Trager et al. 1993, 1995 and McLaughlin & van der Marel 2005). In this figure, green symbols are used for core-collapsed clusters.
It is remarkable that, ignoring Pal 1 and all high-reddening GCs, only low-concentration GCs are offset the CMR. However, all these clusters are faint and we can not exclude that this is the principal cause of the scatter with respect to the CMR. Note that NGC 6723, a GC in the Sagittarius constellation, has a similar concentration and metal abundance to Whiting 1 and Terzan 7. However, it has an estimated age of 13.06 Gyr (Marín-Franch et al., 2009), hence this GC is much older than Whiting 1 and Terzan 7.
Pal 1, the GC which might be associated to the Canis Major dSph, has a very different concentration and is the only low-reddening cluster with a concentration that is an outlier in the CMR.
Note that low-reddening core-collapsed clusters (with the exception of NGC 6723) are all close to the CMR. This suggests that the colours of GCs are not altered during or after the core-collapse.
2.9 A Note on the influence of the contamination correction on the scatter in the CMR
In Paper I we described how we used CMDs and proper motions to clean out the aperture magnitudes. In this section we check how effective this correction is and what its influence is on the scatter in the CMR.
Fig. 15 presents the absolute colour difference (defined in Eq. 9) as a function of the magnitude correction and the colour correction. Only three low-reddening clusters deviate strongly from the CMR. These clusters (E 3, Pal 3 and Pal 13) are very faint which is reflected in their magnitude errors. It was not possible to obtain a decent CMD for these clusters so no magnitude correction was applied.
The need to clean out the contamination, especially for faint clusters, is illustrated well by Pal 12. For this halo cluster, only one very bright foreground star was identified in the CMD and removed from the aperture photometry. This resulted in magnitude corrections of 1.38 (1.20, 1.15, 1.06) mag. in (, , ), yielding a 0.32 mag. correction for the contamination in . Note that for this cluster , so the magnitude correction significantly moved the GC towards the CMR relation.
Nevertheless, as was discussed in Section 2.4, the main source of the scatter in the CMR is the reddening uncertainty.
2.10 GCs with a different chemical evolution?
In Section 2.1 we discussed the particular position in colour-metallicity space of Whiting 1, Pal 1, E 3 and Terzan 7. In the previous sections, we excluded age and HB morphology as the origin for the offset for these low-reddening clusters. For E 3 and Terzan 7, we can not exclude photometric uncertainties cause the offset. In this section, we reexamine the issue, but also include NGC 6723, NGC 7492 and Pal 13, which are other low-reddening GCs showing similar blue offsets to the [Fe/H] CMR (see Fig. 5).
NGC 6723 is a low-reddening cluster in the Sagittarius constellation, which was also discussed in Section 2.8. However, Forbes & Bridges (2010) listed this cluster among the Milky Way GCs and did not include this cluster in their subsample associated to the Sagittarius dSph. With an age of about 13 Gyr, it is much older than Terzan 7 and Whiting 1. Note that NGC 6723 and NGC 7492 also show a similar offset to the CaT CMR as Terzan 7 (see Fig. 4). Pal 13 is a sparse distant halo cluster which is about to be devoured by the Milky Way (Siegel et al., 2001).
Only age and chemical composition determine the colours of the RGB stars which dominate the magnitudes of the GCs, hence it is not unreasonable to consider the chemical history as the possible origin for the colour offset. Moreover, Sakari et al. (2011) show that Pal 1, a low surface brightness cluster with a sparse red giant branch, has a very unusual chemistry: the cluster does not show the Na-O anti-correlation and the neutron-capture elements show different abundances than for standard Galactic GCs.
Whiting 1 and Terzan 7 are two GCs associated with the Sgr dSph that are offset the CMR, the latter cluster being formed during the main episode of star formation in the Sgr system (Bellazzini et al., 1999). Smecker-Hane & McWilliam (2002) show that not only the GCs associated to the Sgr system can be peculiar: the red giant stars in the Sgr dSph galaxy span a wide range of metallicities and show very unusual abundance variations (both for abundances as for neutron-capture elements), inferring an extended period of star formation and chemical enrichment with considerable mass loss.
Mackey & Gilmore (2004) suggested an extragalactic origin for the old outer halo cluster NGC 7492, a cluster located at . Majewski et al. (2004) find that it is unlikely that this cluster is a Sagittarius remnant, though these authors do not fully exclude this possibility. Based on a sample of four RGB stars, Cohen & Melendez (2005) recover the well-known Na-O anti-correlation and find evidence for a chemical history (including neutron capture processes) similar to that of inner halo GCs with similar [Fe/H].
Several GCs associated to the Canis Major dSph (NGC 1851, NGC 1904, NGC 2298, NGC 2808, NGC 4590 and Rup 106) are on the CMR. In our sample, Pal 1 is the only GC related to the Canis Major system (Forbes & Bridges, 2010) that is offset the CMR. However, the existence of the Canis Major structure is under debate. It is not clear whether this system is produced by a collision with a dSph satellite galaxy or if it is caused by a warp in the Galactic disk, combined with the spiral arm populations of the Milky Way (see e.g. Mateu et al. 2009).
If the latter turns out to be true, it is even more remarkable that several clusters linked to the Sagittarius stream, which is then the only genuine dSph stream being accreted to the Milky Way, are outliers in the CMR. However, other GCs associated to the Sagittarius system by Forbes & Bridges (2010) also fall close the CMR (including NGC 6715, Pal 12, NGC 4147 and NGC 5634), thus not all GCs related to dSph galaxies have somehow particular colours.
Bellazzini et al. (1999) claimed that the stellar content and the star formation history of the Sgr dSph appears very similar to those of other dSph galaxies. Most of the GCs that are consistently off the CMR are related to the Sagittarius dSph in some way. Accurate colours and metallicities for GCs residing in dwarf galaxies are highly desirable to check our findings. If it is true that dwarf galaxies host a number of peculiar GCs, we should be able to find these GCs as well in massive galaxies, which are assembled by accreting such objects in CDM theories. However, these peculiar clusters are faint thus detecting them will be observationally challenging.
Note that not all clusters with particular chemical properties are offset the CMR. Cohen (2004) demonstrate the chemical peculiarities of Pal 12, another GC associated to the Sagittarius system (Forbes & Bridges, 2010). Due to the large contamination correction (as shown in Fig. 15), this cluster falls right on the CMR. NGC 2419, another outer halo cluster with chemical peculiarities (Cohen & Kirby, 2012), is not off the CMR.
3 Colour bimodality
It is widely known that the metallicity distribution of Galactic GCs is bimodal. If the colour is representative of the metallicity then one would expect to find bimodality in the distribution of colour. However, we ran a Gaussian mixture modelling algorithm (gmm – Muratov & Gnedin 2010) on the full Galactic distribution and did not find evidence for a bimodal distribution (Fig. 16, panel (a)).


The gmm parameters for the colour distribution and the corresponding [Fe/H] distribution of the full GC sample are listed in Table 2. It is clear that the colour distributions are not strictly bimodal and could just be skewed unimodal distributions. It would imply that the bimodal Galactic metallicity distribution transforms into a skewed unimodal distribution as a result of the non-linear CMR. This is in fact the opposite case of a unimodal metallicity distribution transforming into a bimodal colour distribution (which was studied in Yoon et al., 2006). Moreover, about half of the metal-poor clusters are attributed to the metal-rich peak based on their colours. Note that more than half of the smaller ACSVCS galaxies from Peng et al. (2006), hosting a similar number of GCs as our current sample, did not exhibit strong colour bimodality either.
| (a) | (b) | (c) | (a∗) | (c∗) | |
| … | … | … | … | ||
| … | … | … | … | ||
| 96 | 63 | 56 | 96 | 56 | |
| D | |||||
| 0.06 | 0.45 | 0.23 | 0.001 | 0.055 | |
| 0.88 | 0.21 | 0.29 | 0.11 | 0.003 | |
| 0.98 | 0.87 | 0.66 | 0.01 | 0.583 | |
| Ratio | 26 : 74 | 93 : 7 | 80 : 11 : 9 | 75 : 25 | 83:17 |
| 1.14 | 0.34 |
As our sample is not large (compared to massive galaxies with extensive GC systems) and there are some outliers in the CMR, with colour determinations affected by high reddening, we decided to analyse a subsample limited to clusters with low reddening. The distribution for this subset is presented in panel (b) of Fig. 16. In spite of the imposed constraints, no colour bimodality is found. The corresponding gmm parameters are listed in Table 2.
It is known gmm is susceptible to outliers, especially long tails (Muratov & Gnedin, 2010; Blakeslee et al., 2012). In a final attempt to recover the Galactic colour distribution, we make a new subset of Galactic GCs, excluding GCs with a colour error larger than 0.1 mag, two Sagittarius CMR outliers (Terzan 7 and Whiting 1) and Pal 1 (for reasons described above). Fig. 17 presents the colour distribution for this subset, which is trimodal ( and , although the value suggests that it is not very statistically significant). gmm parameters are listed in Table 2.
The clusters in the reddest peak of the histogram (NGC 104, NGC 6356, NGC 6352, NGC 6624 and Pal 8) are all bulge or thick disk clusters. Heasley et al. (2000) proposed NGC 104 (47 Tuc), NGC 6352, NGC 6624 had a common origin, but Gao et al. (2007) did not assign the GCs to the same accretion streams. Vandenberg et al. (2013) found a bifurcation in their age-metallicity diagram of clusters with disk-like kinematics. It is remarkable that NGC 104, NGC 6352 and NGC 6624 all pertain to the second branch in their diagram. No age estimate was obtained in the latter study for NGC 6356 and Pal 8, which are subject to considerable reddening ().
Peng et al. (2006) found VCC 798 (NGC 4382/M 85) as the best candidate for a trimodal colour distribution. This galaxy is classified as in the RC3 (Corwin et al., 1994), indicating pure S0, and has a very strong disk component, although the inclination angle makes it appear less obvious. It is tempting to speculate that the trimodal colour distribution is linked with the disk component. Nevertheless, the giant elliptical galaxy NGC 4365 also hosts three subpopulations of GCs (Brodie et al., 2005; Blom et al., 2012a, b), making a link with the disk less probable. For M 31, a spiral galaxy, some evidence for a trimodal distribution was found, although it is not completely clear how many subpopulations are present (Perrett et al., 2002).

In Fig. 18 we present the [Fe/H] distributions of the different subsamples. It is clear that the [Fe/H] distribution for all GCs (case (a)) is bimodal, which is confirmed by the gmm results given in Table 2. It is clear that the strong [Fe/H] bimodality vanishes limiting the sample to the low-reddening clusters, because a significant fraction of the metal-rich GCs is located towards the bulge of the Galaxy, where the reddening is significant. Note that the gmm parameters for the [Fe/H] distribution associated to case (c) are not conclusive: the peak separation D favours a bimodal distribution, while the second peak is not clearly apparent in Fig. 18. The rather large values favour a unimodal distribution. It was not possible with gmm to fit a trimodal distribution to the case (c) [Fe/H] distribution. Therefore it is rather normal no bimodal colour distributions were found for the different subsamples and it nicely illustrates that selection effects can complicate the correct interpretation of the colour and metallicity distributions.

4 Summary
In the current study we used our integrated optical photometry (presented in Paper I) to confirm and improve existing CMRs. For the -[Fe/H] relation we double the number of Galactic GCs used in the fit when comparing to the earlier studies by Peng et al. (2006) and Blakeslee et al. (2010). Moreover, these authors relied on pure aperture photometry and did not correct for foreground contamination. Nevertheless, we rely on the same extragalactic data to extend the metallicity range. Furthermore, we confirm the -[Fe/H] relation of Sinnott et al. (2010), for the first time with Galactic GCs. However, we find an offset at both the metal-rich and metal-poor end of their -[Fe/H] CMR. We also demonstrate that the CaT metallicity indicator behaves non-linear when compared to the and colours.
We scrutinise the influence of the reddening estimate on the scatter in the CMR and demonstrate that this scatter can be significantly reduced by combining Cardelli et al. (1989) and Schlafly & Finkbeiner (2011) reddening laws. We also discuss how the scatter in the CMR is influenced by the contamination correction, differential reddening, HB morphology, age, present-day mass function variations and structural parameters.
We find a group of clusters which lie conspicuously off the Galactic CMR: with one possible exception, all these objects are associated with the Sagittarius dwarf or the proposed Canis Major dwarf. This might imply that a subset of globular clusters belonging to dwarf spheroidal galaxies are a different population from those found in the Milky Way and other bright local group members. If so, it will not be possible to build our globular cluster system from mergers of dwarf galaxies with the early Milky Way, unless such objects are radically different from present-day dwarf spheroidals in the Local Group.
Acknowledgments
We thankfully acknowledge the anonymous referee for very useful and thought-provoking comments. We would like to thank Giovanni Carraro, Ivo Saviane, Caroline Foster and Sven De Rijcke for fruitful discussions, Peter Camps for the implementation of the fitting routine in Python. JV acknowledges the support of ESO through a studentship. JV and MB acknowledge the support of the Fund for Scientific Research Flanders (FWO-Vlaanderen). AJ acknowledges support by the Chilean Ministry for the Economy, Development, and Tourism s Programa Iniciativa Cientí ca Milenio through grant P07-021-F, awarded to The Milky Way Millennium Nucleus.
The authors are grateful to CTIO for the hospitality and the dedicated assistence during the numerous observing runs.
This research has made use of NASA’s Astrophysics Data System and the NED which is operated by the Jet Propulsion Laboratory, California Institute of Technology, under contract with the National Aeronautics and Space Administration.
This research made use of Montage, funded by the National Aeronautics and Space Administration’s Earth Science Technology Office, Computation Technologies Project, under Cooperative Agreement Number NCC5-626 between NASA and the California Institute of Technology. Montage is maintained by the NASA/IPAC Infrared Science Archive.
For this part of the research, we have made extensive use of the European Virtual Observatory applications aladin (Bonnarel et al., 2000) and topcat (Taylor, 2005). The Virtual Observatory is a project designed to provide the astronomical community with the data access and the research tools necessary to enable the exploration of the digital, multi-wavelength universe resident in the astronomical data archives. We used the applications provided by astrometry.net222http://astrometry.net/.
References
- Alonso-García et al. (2012) Alonso-García J., Mateo M., Sen B., et al., 2012, AJ, 143, 70
- Alves-Brito et al. (2011) Alves-Brito A., Hau G. K. T., Forbes D. A., et al., 2011, MNRAS, 417, 1823
- Armandroff & Da Costa (1991) Armandroff T. E., Da Costa G. S., 1991, AJ, 101, 1329
- Armandroff & Zinn (1988) Armandroff T. E., Zinn R., 1988, AJ, 96, 92
- Armstrong & Tam Kung (1978) Armstrong R. D., Tam Kung M., 1978, J. R. Stat. Soc., Ser. C, 27, 363
- Bellazzini et al. (2012) Bellazzini M., Dalessandro E., Sollima A., Ibata R., 2012, MNRAS, 423, 844
- Bellazzini et al. (1999) Bellazzini M., Ferraro F. R., Buonanno R., 1999, MNRAS, 307, 619
- Bellazzini et al. (2002) Bellazzini M., Ferraro F. R., Ibata R., 2002, AJ, 124, 915
- Blakeslee et al. (2010) Blakeslee J. P., Cantiello M., Peng E. W., 2010, ApJ, 710, 51
- Blakeslee et al. (2012) Blakeslee J. P., Cho H., Peng E. W., Ferrarese L., Jordán A., Martel A. R., 2012, ApJ, 746, 88
- Blom et al. (2012a) Blom C., Forbes D. A., Brodie J. P., et al., 2012a, MNRAS, 426, 1959
- Blom et al. (2012b) Blom C., Spitler L. R., Forbes D. A., 2012b, MNRAS, 420, 37
- Bochanski et al. (2010) Bochanski J. J., Hawley S. L., Covey K. R., et al., 2010, AJ, 139, 2679
- Bonnarel et al. (2000) Bonnarel F., Fernique P., Bienaymé O., et al., 2000, A&A Supl., 143, 33
- Bressan et al. (2012) Bressan A., Marigo P., Girardi L., et al., 2012, MNRAS, 427, 127
- Brodie & Huchra (1990) Brodie J. P., Huchra J. P., 1990, ApJ, 362, 503
- Brodie & Strader (2006) Brodie J. P., Strader J., 2006, ARA&A, 44, 193
- Brodie et al. (2005) Brodie J. P., Strader J., Denicoló G., et al., 2005, AJ, 129, 2643
- Caldwell et al. (2011) Caldwell N., Schiavon R., Morrison H., Rose J. A., Harding P., 2011, AJ, 141, 61
- Caloi & D’Antona (2005) Caloi V., D’Antona F., 2005, A&A, 435, 987
- Cantiello & Blakeslee (2007) Cantiello M., Blakeslee J. P., 2007, ApJ, 669, 982
- Capaccioli et al. (1991) Capaccioli M., Ortolani S., Piotto G., 1991, A&A, 244, 298
- Cardelli et al. (1989) Cardelli J. A., Clayton G. C., Mathis J. S., 1989, ApJ, 345, 245
- Carraro (2005) Carraro G., 2005, ApJ Letters, 621, L61
- Carraro et al. (2007) Carraro G., Zinn R., Moni Bidin C., 2007, A&A, 466, 181
- Carretta et al. (2009) Carretta E., Bragaglia A., Gratton R. G., et al., 2009, A&A, 505, 117
- Catelan et al. (2001) Catelan M., Bellazzini M., Landsman W. B., Ferraro F. R., Fusi Pecci F., Galleti S., 2001, AJ, 122, 3171
- Catelan et al. (2002) Catelan M., Borissova J., Ferraro F. R., Corwin T. M., Smith H. A., Kurtev R., 2002, AJ, 124, 364
- Chaboyer et al. (1998) Chaboyer B., Demarque P., Kernan P. J., Krauss L. M., 1998, ApJ, 494, 96
- Chies-Santos et al. (2012) Chies-Santos A. L., Larsen S. S., Cantiello M., et al., 2012, A&A, 539, A54
- Chies-Santos et al. (2011a) Chies-Santos A. L., Larsen S. S., Kuntschner H., et al., 2011a, A&A, 525, A20
- Chies-Santos et al. (2011b) Chies-Santos A. L., Larsen S. S., Wehner E. M., Kuntschner H., Strader J., Brodie J. P., 2011b, A&A, 525, A19
- Cohen (2004) Cohen J. G., 2004, AJ, 127, 1545
- Cohen et al. (2003) Cohen J. G., Blakeslee J. P., Côté P., 2003, ApJ, 592, 866
- Cohen et al. (1998) Cohen J. G., Blakeslee J. P., Ryzhov A., 1998, ApJ, 496, 808
- Cohen & Kirby (2012) Cohen J. G., Kirby E. N., 2012, ApJ, 760, 86
- Cohen & Melendez (2005) Cohen J. G., Melendez J., 2005, AJ, 129, 1607
- Conroy & van Dokkum (2012) Conroy C., van Dokkum P. G., 2012, ApJ, 760, 71
- Contreras Peña et al. (2013) Contreras Peña C., Catelan M., Grundahl F., Stephens A. W., Smith H. A., 2013, ArXiv e-prints
- Corwin et al. (1994) Corwin Jr. H. G., Buta R. J., de Vaucouleurs G., 1994, AJ, 108, 2128
- Côté et al. (2004) Côté P., Blakeslee J. P., Ferrarese L., et al., 2004, ApJS, 153, 223
- Côté et al. (2002) Côté P., Djorgovski S. G., Meylan G., Castro S., McCarthy J. K., 2002, ApJ, 574, 783
- Côté et al. (2003) Côté P., McLaughlin D. E., Cohen J. G., Blakeslee J. P., 2003, ApJ, 591, 850
- Côté et al. (2001) Côté P., McLaughlin D. E., Hanes D. A., et al., 2001, ApJ, 559, 828
- Cote et al. (1991) Cote P., Richer H. B., Fahlman G. G., 1991, AJ, 102, 1358
- Couture et al. (1990) Couture J., Harris W. E., Allwright J. W. B., 1990, ApJS, 73, 671
- De Angeli et al. (2005) De Angeli F., Piotto G., Cassisi S., et al., 2005, AJ, 130, 116
- De Marchi et al. (2007) De Marchi G., Paresce F., Pulone L., 2007, ApJ Letters, 656, L65
- Dotter et al. (2011) Dotter A., Sarajedini A., Anderson J., 2011, ApJ, 738, 74
- Dotter et al. (2008) Dotter A., Sarajedini A., Yang S.-C., 2008, AJ, 136, 1407
- Faifer et al. (2011) Faifer F. R., Forte J. C., Norris M. A., et al., 2011, MNRAS, 416, 155
- Forbes & Bridges (2010) Forbes D. A., Bridges T., 2010, MNRAS, 404, 1203
- Foster et al. (2010) Foster C., Forbes D. A., Proctor R. N., Strader J., Brodie J. P., Spitler L. R., 2010, AJ, 139, 1566
- Foster et al. (2011) Foster C., Spitler L. R., Romanowsky A. J., et al., 2011, MNRAS, 415, 3393
- Frank et al. (2012) Frank M. J., Hilker M., Baumgardt H., et al., 2012, MNRAS, 423, 2917
- Galleti et al. (2009) Galleti S., Bellazzini M., Buzzoni A., Federici L., Fusi Pecci F., 2009, A&A, 508, 1285
- Gao et al. (2007) Gao S., Jiang B.-W., Zhao Y.-H., 2007, ChJAA, 7, 111
- Geisler et al. (2007) Geisler D., Wallerstein G., Smith V. V., Casetti-Dinescu D. I., 2007, PASP, 119, 939
- Grabhorn et al. (1991) Grabhorn R. P., Cohn H. N., Lugger P. M., Murphy B. W., 1991, in The Formation and Evolution of Star Clusters, edited by K. Janes, vol. 13 of Astronomical Society of the Pacific Conference Series, 392
- Gratton et al. (2012) Gratton R. G., Carretta E., Bragaglia A., 2012, A&AR, 20, 50
- Grillmair & Smith (2001) Grillmair C. J., Smith G. H., 2001, AJ, 122, 3231
- Hamren et al. (2013) Hamren K. M., Smith G. H., GuhaThakurta P., et al., 2013, ArXiv e-prints
- Harris (1991) Harris W. E., 1991, ARA&A, 29, 543
- Harris (1996) Harris W. E., 1996, AJ, 112, 1487
- Harris & Harris (2002) Harris W. E., Harris G. L. H., 2002, AJ, 123, 3108
- Harris & van den Bergh (1981) Harris W. E., van den Bergh S., 1981, AJ, 86, 1627
- Heasley et al. (2000) Heasley J. N., Janes K. A., Zinn R., Demarque P., Da Costa G. S., Christian C. A., 2000, AJ, 120, 879
- Heitsch & Richtler (1999) Heitsch F., Richtler T., 1999, A&A, 347, 455
- Jordi et al. (2009) Jordi K., Grebel E. K., Hilker M., et al., 2009, AJ, 137, 4586
- Kim et al. (2013) Kim S., Yoon S.-J., Chung C., et al., 2013, ArXiv e-prints
- Kissler-Patig et al. (1998) Kissler-Patig M., Brodie J. P., Schroder L. L., Forbes D. A., Grillmair C. J., Huchra J. P., 1998, AJ, 115, 105
- Kissler-Patig et al. (1997) Kissler-Patig M., Kohle S., Hilker M., Richtler T., Infante L., Quintana H., 1997, A&A, 319, 470
- Koch et al. (2004) Koch A., Grebel E. K., Odenkirchen M., Martínez-Delgado D., Caldwell J. A. R., 2004, AJ, 128, 2274
- Kroupa (1998) Kroupa P., 1998, in Brown Dwarfs and Extrasolar Planets, edited by R. Rebolo, E. L. Martin, M. R. Zapatero Osorio, vol. 134 of Astronomical Society of the Pacific Conference Series, 483
- Law & Majewski (2010) Law D. R., Majewski S. R., 2010, ApJ, 718, 1128
- Lee & Carney (2006) Lee J.-W., Carney B. W., 2006, AJ, 132, 2171
- Lee (1990) Lee Y.-W., 1990, ApJ, 363, 159
- Lee et al. (1994) Lee Y.-W., Demarque P., Zinn R., 1994, ApJ, 423, 248
- Lewis et al. (2006) Lewis M. S., Liu W. M., Paust N. E. Q., Chaboyer B., 2006, AJ, 131, 2538
- Lotz et al. (2004) Lotz J. M., Miller B. W., Ferguson H. C., 2004, ApJ, 613, 262
- Mackey & Gilmore (2004) Mackey A. D., Gilmore G. F., 2004, MNRAS, 355, 504
- Mackey & van den Bergh (2005) Mackey A. D., van den Bergh S., 2005, MNRAS, 360, 631
- Majewski et al. (2004) Majewski S. R., Kunkel W. E., Law D. R., et al., 2004, AJ, 128, 245
- Marín-Franch et al. (2009) Marín-Franch A., Aparicio A., Piotto G., et al., 2009, ApJ, 694, 1498
- Marino et al. (2013) Marino A. F., Milone A. P., Lind K., 2013, ApJ, 768, 27
- Marks et al. (2012) Marks M., Kroupa P., Dabringhausen J., Pawlowski M. S., 2012, MNRAS, 422, 2246
- Mateu et al. (2009) Mateu C., Vivas A. K., Zinn R., Miller L. R., Abad C., 2009, AJ, 137, 4412
- McLaughlin & van der Marel (2005) McLaughlin D. E., van der Marel R. P., 2005, ApJS, 161, 304
- Mieske et al. (2006) Mieske S., Jordán A., Côté P., et al., 2006, ApJ, 653, 193
- Mieske et al. (2010) Mieske S., Jordán A., Côté P., et al., 2010, ApJ, 710, 1672
- Milone et al. (2012) Milone A. P., Piotto G., Bedin L. R., et al., 2012, A&A, 537, A77
- Muratov & Gnedin (2010) Muratov A. L., Gnedin O. Y., 2010, ApJ, 718, 1266
- Ortolani et al. (1995) Ortolani S., Renzini A., Gilmozzi R., et al., 1995, Nature, 377, 701
- Ostrov et al. (1993) Ostrov P., Geisler D., Forte J. C., 1993, AJ, 105, 1762
- Paust & Chaboyer (2011) Paust N., Chaboyer B., 2011, in American Astronomical Society Meeting Abstracts #217, vol. 43 of Bulletin of the American Astronomical Society, 152.14
- Paust et al. (2009) Paust N. E. Q., Aparicio A., Piotto G., et al., 2009, AJ, 137, 246
- Paust et al. (2010) Paust N. E. Q., Reid I. N., Piotto G., et al., 2010, AJ, 139, 476
- Peng et al. (2004) Peng E. W., Ford H. C., Freeman K. C., 2004, ApJ, 602, 705
- Peng et al. (2006) Peng E. W., Jordán A., Côté P., et al., 2006, ApJ, 639, 95
- Perrett et al. (2002) Perrett K. M., Bridges T. J., Hanes D. A., et al., 2002, AJ, 123, 2490
- Pota et al. (2013) Pota V., Forbes D. A., Romanowsky A. J., et al., 2013, MNRAS, 428, 389
- Pulone et al. (2003) Pulone L., De Marchi G., Covino S., Paresce F., 2003, A&A, 399, 121
- Puzia et al. (2005) Puzia T. H., Kissler-Patig M., Thomas D., et al., 2005, A&A, 439, 997
- Reed et al. (1988) Reed B. C., Hesser J. E., Shawl S. J., 1988, PASP, 100, 545
- Rejkuba (2012) Rejkuba M., 2012, Astroph. & Space Science, 341, 195
- Richtler (2006) Richtler T., 2006, Bulletin of the Astronomical Society of India, 34, 83
- Rosenberg et al. (1998) Rosenberg A., Saviane I., Piotto G., Aparicio A., Zaggia S. R., 1998, AJ, 115, 648
- Sakari et al. (2011) Sakari C. M., Venn K. A., Irwin M., Aoki W., Arimoto N., Dotter A., 2011, ApJ, 740, 106
- Salaris & Weiss (1998) Salaris M., Weiss A., 1998, A&A, 335, 943
- Salpeter (1955) Salpeter E. E., 1955, ApJ, 121, 161
- Saviane et al. (2012) Saviane I., da Costa G. S., Held E. V., et al., 2012, A&A, 540, A27
- Saviane et al. (1998) Saviane I., Piotto G., Fagotto F., Zaggia S., Capaccioli M., Aparicio A., 1998, A&A, 333, 479
- Schlafly & Finkbeiner (2011) Schlafly E. F., Finkbeiner D. P., 2011, ApJ, 737, 103
- Sharples et al. (1998) Sharples R. M., Zepf S. E., Bridges T. J., et al., 1998, AJ, 115, 2337
- Siegel et al. (2001) Siegel M. H., Majewski S. R., Cudworth K. M., Takamiya M., 2001, AJ, 121, 935
- Sinnott et al. (2010) Sinnott B., Hou A., Anderson R., Harris W. E., Woodley K. A., 2010, AJ, 140, 2101
- Smecker-Hane & McWilliam (2002) Smecker-Hane T. A., McWilliam A., 2002, ArXiv Astrophysics e-prints
- Strader et al. (2005) Strader J., Brodie J. P., Cenarro A. J., Beasley M. A., Forbes D. A., 2005, AJ, 130, 1315
- Strader et al. (2006) Strader J., Brodie J. P., Spitler L., Beasley M. A., 2006, AJ, 132, 2333
- Strader et al. (2011) Strader J., Romanowsky A. J., Brodie J. P., et al., 2011, ApJS, 197, 33
- Taylor (2005) Taylor M. B., 2005, in Astronomical Data Analysis Software and Systems XIV, edited by P. Shopbell, M. Britton, R. Ebert, vol. 347 of Astronomical Society of the Pacific Conference Series, 29
- Trager et al. (1993) Trager S. C., Djorgovski S., King I. R., 1993, in Structure and Dynamics of Globular Clusters, edited by S. G. Djorgovski, G. Meylan, vol. 50 of Astronomical Society of the Pacific Conference Series, 347
- Trager et al. (1995) Trager S. C., King I. R., Djorgovski S., 1995, AJ, 109, 218
- Trouille & Chaboyer (2002) Trouille L., Chaboyer B., 2002, in American Astronomical Society Meeting Abstracts, vol. 201 of Bulletin of the American Astronomical Society, 710
- Usher et al. (2012) Usher C., Forbes D. A., Brodie J. P., et al., 2012, MNRAS, 426, 1475
- van den Bergh & Mackey (2004) van den Bergh S., Mackey A. D., 2004, MNRAS, 354, 713
- Vandenberg et al. (2013) Vandenberg D. A., Brogaard K., Leaman R., Casagrande L., 2013, ArXiv e-prints
- Webbink (1985) Webbink R. F., 1985, in Dynamics of Star Clusters, edited by J. Goodman, P. Hut, vol. 113 of IAU Symposium, 541–577
- West et al. (2004) West M. J., Côté P., Marzke R. O., Jordán A., 2004, Nature, 427, 31
- Whitmore et al. (1995) Whitmore B. C., Sparks W. B., Lucas R. A., Macchetto F. D., Biretta J. A., 1995, ApJ Letters, 454, L73
- Yoon et al. (2011a) Yoon S.-J., Lee S.-Y., Blakeslee J. P., et al., 2011a, ApJ, 743, 150
- Yoon et al. (2011b) Yoon S.-J., Sohn S. T., Lee S.-Y., et al., 2011b, ApJ, 743, 149
- Yoon et al. (2006) Yoon S.-J., Yi S. K., Lee Y.-W., 2006, Science, 311, 1129
- Zacharias et al. (2005) Zacharias N., Monet D. G., Levine S. E., Urban S. E., Gaume R., Wycoff G. L., 2005, VizieR Online Data Catalog, 1297, 0
- Zepf & Ashman (1993) Zepf S. E., Ashman K. M., 1993, MNRAS, 264, 611
- Zepf et al. (2000) Zepf S. E., Beasley M. A., Bridges T. J., et al., 2000, AJ, 120, 2928
- Zinn (1985) Zinn R., 1985, ApJ, 293, 424