The Solar Neighborhood XXXI: Discovery of an Unusual Red+White Dwarf Binary at 25 Parsecs via Astrometry and UV Imaging
Abstract
We report the discovery of a nearby M5.0V dwarf at 24.6 pc, SCR 18486855, that is orbited by an unusual companion causing an astrometric perturbation of more than 200 milli-arcseconds. This is by far the largest perturbation found to date among more than 700 targets observed during our long-term astrometry/photometry program at the CTIO 0.9-m telescope. We present here a suite of astrometric, photometric, and spectroscopic observations of this high proper motion (13/yr) system in an effort to reveal the nature of this unusual binary. The measured near-UV and optical U band fluxes exceed those expected for comparable M5.0V stars, and excess flux is also detected in the spectral range 4000Å–7000Å. The elusive companion has been detected in HST-STISMAMA images at 1820Å and 2700Å, and our analysis shows that it is probably a rare, cool, white dwarf with T = 4600-5500K. Given the long-term astrometric coverage, the prospects for an accurate mass determination are excellent, although as yet we can only provide limits on the unusual companion’s mass.
1 Introduction
Using the CTIO 0.9-m telescope, we have made astrometric observations of more than 700 nearby stars since 1999 during our Cerro Tololo Inter-american Observatory Parallax Investigation (CTIOPI). We have presented nearby subdwarf, red dwarf, and white dwarf discoveries in The Solar Neighborhood series (Jao et al., 2005; Henry et al., 2006; Subasavage et al., 2009; Riedel et al., 2010; Jao et al., 2011; Riedel et al., 2011), as part of the RECONS (REsearch Consortium On Nearby Stars)111www.recons.org effort to explore the solar neighborhood. To date, we have reported astrometric perturbations with amplitudes of tens of milli-arcseconds (hereafter, mas) (Henry et al., 2006; Riedel et al., 2010) and continue to observe 50 objects exhibiting perturbations in an effort to determine accurate masses for low mass stars and brown dwarfs. Here we report an extraordinary perturbation of the M5.0V star SCR 1848-6855 (hereafter SCR 1848) with an amplitude of more than 200 mas. This star was discovered during our SuperCOSMOS-RECONS (SCR) search for high proper motion objects in the southern sky and found to have 1287 yr-1 (Hambly et al., 2004). In this paper, we present a detailed analysis of this unusual system, including results from the 0.9-m program and several other ground-based and space-based efforts, to understand the physical properties of the mysterious companion.
2 Observations and Results
2.1 Astrometry from CTIO
We used the CTIO 0.9-m to measure the astrometric properties (proper motion, parallax, perturbation of the photocenter) and photometry of SCR 1848, and provide the results in Table 1. The telescope has a 20482048 Tektronix CCD camera with 0401 pixel-1 plate scale (Jao et al., 2005). For both astrometric and photometric observations, we used the central quarter of the chip, yielding a 68 square field of view. We used the Kron-Cousins filter for parallax measurements to maximize the number of suitable reference stars in the field, and obtained photometry of SCR 1848 and similar stars through Johnson (, and ) and Kron-Cousins ( and ) filters. Bias and dome flat frames were taken nightly for basic image reduction. We have one epoch of and photometry and four epochs of , and , for which results are given in Table 1. Additional details of parallax and photometry observations and data analysis can be found in Jao et al. (2005) and Winters et al. (2011), respectively.
With more than 8 years of astrometric observations, the red dwarf exhibits an extraordinary perturbation with peak-to-peak amplitudes of 200 mas in RA and 60 mas in DEC. Shown in Figure 1(a) is a map of the red dwarf’s photocentric position relative to the barycenter, split into RA and DEC directions, after shifts due to proper motion and parallax have been removed. We suspect that the epoch of periastron occurred around 2004.6. This is the largest photocentric perturbation we have detected among more than 700 targets observed astrometrically at the 0.9-m since 1999. To eliminate any doubt that the perturbation is real, for comparison we also present residuals from a reference star in the field in Figure 1(b), in which the vertical scale is one-fifth that for SCR 1848.
Because the scale of the perturbation exceeds the size of the parallactic ellipse by a factor of five (so far), the parallactic motion is overwhelmed by the perturbation, and the yearly cadence of the parallax remains in Figure 1(a), particularly in the RA axis. To derive an accurate trigonometric parallax for the system, we therefore solve for proper motion, parallax, and orbital motion iteratively. We first carry out a standard reduction for proper motion and parallax. A reduction using all of the data without compensating for the perturbation results in a parallax of 24.262.30 mas (41 pc), which is inconsistent with the more carefully treated results discussed below. We then fit an photocentric orbit to the residuals shown in Figure 1(a). This orbit is then removed, and we derive the results for proper motion (1280.90.3 mas/yr) and parallax (40.630.72 mas), placing the system at a distance of 24.6 pc. After the first iteration of removing the large perturbation, the residuals in RA were reduced by a factor of 4.5 and the parallax error was reduced by a factor of 3. These new residuals are comparable to the night-to-night variations in the photocenter positions, and the parallax error is less than our median parallax errors (1.4 mas) for stars with coverage of at least six years, so no further iterations were appropriate for the current dataset. We will continue to follow the system to improve our understanding of the overall path of the photocenter. Further discussion is based upon the parallax of 40.63 mas as given in Table 1. We checked this result by evaluating only those images taken since 2007 to ensure that the perturbation persists, i.e., selecting frames after the presumed periastron, with results shown in Figure 1(c). A comparison of the reference star’s motion in Figure 1(b) to the residual effect of the perturbation in SCR 1848’s position in Figure 1(c) (same scale in both panels) reveals that the perturbation’s effects are seen on both axes and that the science star is not single. The parallax (46.260.70 mas) derived for the 2007-2012 data is roughly in agreement with the results for all data with the perturbation removed ,although we note that in this unusual case the parallax errors may be underestimated and the distance from 2007-2012 data should be treated with caution222Because the perturbation in Figure 1(c) is significantly reduced compared to that in Figure 1(a), we did not perform an orbital fit to revise the parallax. We merely use this reduction as additional assurance that the system is at a distance of roughly 24.6 pc.. Details pertaining to the perturbation fit as well as the analysis of the photocentric orbit are discussed in section 3.2.
| Result | Value |
|---|---|
| Name | SCR 18486855 |
| R.A.(2000.0) | 18:48:21.1 |
| Decl. (2000.0) | 68:55:34.5 |
| observation span(yr) | 8.5 |
| No. of reference stars | 11 |
| No. of frames | 141 |
| (mas) | 39.520.72 |
| correction to absolute parallax (mas) | 1.110.08 |
| (mas) | 40.630.72 |
| (mas yr-1) | 1280.90.3 |
| P.A. (degrees) | 195.70.1 |
| 22.55 | |
| (23.60) | |
| 18.35 | |
| 18.13 | |
| 16.86 | |
| 15.68 | |
| 13.83 | |
| 11.89 | |
| 11.40 | |
| 11.10 | |
| spectral type | M5.0VJ |
Note. — The photometry is from GALEX General Release 6. is specifically of the M dwarf component measured directly from STIS images discussed in section 2.5, but all other magnitudes are combined photometry of both components. and were taken on March 12, 2010 at the CTIO 0.9-m, while the , , and measurements are from four different nights of observations. photometry is from the 2MASS catalog. The “J” in the spectral type indicates it is classified from a combined spectrum of two components.


2.1.1 A Background Source Near SCR 1848
SCR 1848 is a high proper motion star that moves primarily south with a slight deviation to the west. After carefully checking all parallax frames, we noticed it was on top of a faint background source in the first image taken on UT 2003 March 29 by comparing it with the SuperCOSMOS infrared plate taken in 1996. The background star later appeared clearly in our image on UT 2005 July 29 and in subsequent frames. During this period of time, SCR 1848 coincidentally shows its largest parallax residual in RA, as shown in Figure 1(a). In order to understand how this faint background star affects the centroids by SExtractor, we performed the following simulations to confirm that the perturbation is not due to this faint background star.
First, we used the last few epochs of images, in which SCR 1848 and the background source were widely separated (e.g. 117 at position angle 18∘ on UT 2011 September 26), to measure the flux ratio of the two sources to be 400:1 in the filter used for the parallax series. No proper motion was detected for the background source during the last two years of images, so we then created simulated images of SCR 1848 and the background source by using PSFs of reference stars in the SCR 1848 field utilizing the first image taken in each of the 28 epochs, and adding in the background source at its position measured at the last epoch. We then created FITS images containing the two sources at epochs corresponding to our parallax frames by tracing SCR 1848’s position from 2011 back to 2003 using SCR 1848’s presumably uncorrupted proper motion and position angle values from Hambly et al. (2004).
Using SExtractor to determine the centroids of SCR 1848 in the simulated images and in the original parallax frames, we find mean differences of 4.7 and 12.9 mas in RA and DEC, respectively, in the 28 epochs of images. Since 2005, the differences are less than 1 mas. These results illustrate that the early epoch images have centroids that are slightly skewed by the background star and that the offsets are larger in DEC than in RA, which is contradictory to what we see in the parallax residuals. In fact, the offsets in RA are 40 times smaller than what is measured for the perturbation shown in Figure 1(a). We therefore conclude that the faint background source is not the cause of the perturbation.
2.2 Photometry from CTIO
The photometric distance estimated from colors using the suite of relations in (Henry et al., 2004) is 37.09.4 pc, which is 1.3 further than the adopted trigonometric parallax distance of 24.6 pc, but is not terribly useful as a distance constraint. The large error in the photometric estimate is caused by photometric colors for the system that differ from similar stars. photometry for SCR 1848 and six similar red dwarfs was obtained at the CTIO 0.9-m on 2010 March 13, and is given in Table 2.2. As shown in Figure 2, in a color plot SCR 1848 is noticeably bluer than stars of comparable spectral types spanning similar , and does not follow the trend of similar red dwarfs in the vs. color-color plot. As discussed in section 2.4, SCR 1848’s red spectrum is a good match to the spectroscopic standards Proxima and GJ1061 at type M5.0V, but the and photometry indicates that the companion is contributing blue light to the system. If SCR 1848 had 18.5, consistent with other M5.0V, it would be only 9.3 pc away, which is inconsistent with the trigonometric parallax.
| Object | SpecType | Ref | |||||||
|---|---|---|---|---|---|---|---|---|---|
| (mas) | |||||||||
| LHS5156 | 15.94 | 14.97 | 13.30 | 11.98 | 10.28 | 7.77 | 95.151.17 | M4.5V | 1, 2, 7 |
| GJ1103 | 15.86 | 14.95 | 13.26 | 11.89 | 10.19 | 7.66 | 114.003.30 | M4.5V | 1, 3, 7, 9 |
| LHS2106 | 17.06 | 16.08 | 14.21 | 12.87 | 11.13 | 8.65 | 66.231.16 | M4.5V | 1, 2, 7, 8 |
| LHS306 | 16.97 | 16.00 | 14.19 | 12.81 | 11.05 | 8.50 | 89.241.69 | M4.5V | 1, 2, 5, 6 |
| GJ1061 | 16.22 | 14.98 | 13.07 | 11.45 | 9.47 | 6.61 | 271.921.34 | M5.0V | 1, 2, 4 |
| Proxima | 14.21 | 12.95 | 11.13 | 9.45 | 7.41 | 4.38 | 774.252.08 | M5.0V | 1, 2, 6 |
| SCR1848 | 18.35 | 18.13 | 16.86 | 15.68 | 13.83 | 11.10 | 40.630.72 | M5.0VJ | 1, 2 |

2.3 Near-UV Photometry from GALEX
We extracted the near-UV (NUV) photometry of SCR 1848 and other red dwarfs from Henry et al. (2004) and, for comparison, white dwarfs from Bergeron et al. (2001) from the GALEX General Release 6. We converted the apparent magnitudes centered at 2271Å to the absolute values given in Table 3 using distances in Bergeron et al. (2001), van Altena et al. (1995) and our parallaxes from CTIOPI. SCR 1848 is 2.1–3.7 magnitudes brighter than other M4.5V or M5.0V stars in this band, indicating that at UV wavelengths, the red dwarf is probably not the primary contributor to the flux, and hence, the one source seen in both of the HST-STIS UV filters (discussed in section 2.5) is the blue companion, not the red dwarf (see section 2.5 for more details). SCR 1848 also has a brighter than most of the white dwarfs listed in Table 3. We note that SCR 1848 is undetected in the far-UV band at 1528Å in GALEX General Release 6.
| Object | Type/T | Parallax | ||
|---|---|---|---|---|
| /K | (mas) | (mag) | (mag) | |
| SCR 18486855 | M5.0V | 40.6 | 14.9 | 18.9 |
| GJ 1156 | M4.5V | 152.9 | 14.7 | 21.0 |
| GJ 1103 | M4.5V | 114.0 | 13.5 | 22.1 |
| GJ 1057 | M4.5V | 117.1 | 14.2 | 22.4 |
| LHS 3262 | M5.0V | 105.5 | 13.7 | 22.6 |
| Proxima | M5.0V | 774.3 | 15.6 | |
| WD 1300263 | DA/4320 | 28.4 | 16.0 | 16.2 |
| WD 1136286 | non-DA/4490 | 24.5 | 17.5 | 17.0 |
| WD 0222648 | non-DA/4520 | 31.4 | 15.8 | 20.0 |
| WD 2251070 | non-DA/4580 | 123.7 | 16.2 | 23.3 |
| WD 1345238* | DA/4590 | 82.9 | 15.3 | 21.9 |
| WD 2054050* | non-DA/4620 | 64.6 | 15.7 | 21.7 |
| WD 2316064 | non-DA/4720 | 32.2 | 15.7 | 21.3 |
| WD 0029032 | non-DA/4770 | 42.6 | 15.5 | 19.5 |
| WD 1820609* | non-DA/4780 | 78.2 | 15.2 | 21.8 |
| WD 2002110 | non-DA/4800 | 57.7 | 15.8 | 21.1 |
| WD 1444174 | non-DA/4960 | 69.0 | 15.6 | 21.3 |
| WD 0657320* | DA/4990 | 53.5 | 15.3 | 17.2 |
2.4 Red and Blue Spectra from CTIO, Gemini-S, and HST
Two red spectra of SCR 1848 covering 6000–9500Å were obtained on UT 2003 July 15 using the CTIO 1.5-m telescope and R-C Spectrograph with the Loral 1200800 CCD camera. Observations were made using a 2″ slit, order-blocking filter OG570, and grating #32 in first order with a tilt of 151. Bias frames, dome flats, and sky flats were taken at the beginning of the night for calibration, and these two exposures of SCR 1848 were taken to permit cosmic ray rejection. A 10 second NeHeAr arc lamp spectrum was recorded after the science exposures to enable wavelength calibration. The spectroscopic flux standard star HR7950 was observed that night. Reductions were carried out using reduction packages — in particular onedspec.dispcor for wavelength calibration and onedspec.calibrate for flux calibration. Comparison of this spectrum with the set of spectral dwarf standards discussed in Jao et al. (2008) results in a spectral type determination of M5.0V for SCR 1848, with the usual adopted error of half a sub-type. The final spectrum is shown in Figure 3 along with four other red dwarfs of similar type, all taken at the CTIO 1.5-m using the R-C Spectrograph. The overall spectral slope and features of SCR 1848 are similar to the M5.0V standards GJ 1061 and Proxima Centauri at wavelengths between 6900Å and 9300Å.
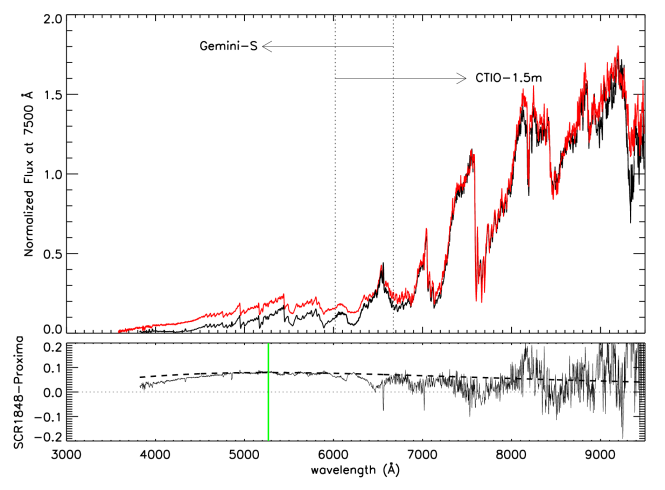
Blue spectra of SCR 1848 covering 3580–6670Å were obtained on the night of UT 2010 August 06 using the Gemini-South telescope and GMOS. Observations were made using a 2″ slit and grating B600_G5323. Two sets of three 600-second exposures were taken during sky conditions satisfying the 90-percentile image quality criterion, at an airmass of 1.35. The two sets of exposures were centered at 5000Å and 5250Å respectively, so that the CCD gaps on the GMOS chip could be removed. Three one-second dome flats were taken immediately after each set of exposures and used for flat-fielding. Wavelength calibration exposures of the CuAr arc lamp were part of Gemini baseline calibrations and were taken at the end of the night. A spectroscopic standard star, LTT7987, was observed with the exact same setups before observing SCR 1848. The final blue spectrum of SCR 1848 combined from all calibrated nodding spectra is shown in Figure 4. The long-slit spectra were reduced using instructions presented during the Gemini Data Reduction Workshop (www.noao.edu/meetings/gdw/).
Using an overlap region spanning 700Å, the red and blue spectra of SCR 1848 were merged and are shown with the red line in Figure 4. The black line is Proxima, an M5.0V spectral standard star. Proxima’s red spectra were obtained on UT June 6 2006 at the CTIO 1.5-m using the same R-C Spectrograph setup and procedures as for SCR 1848, whereas the blue spectra were obtained on UT 2011 May 7 at Gemini-South using the same GMOS setup discussed above, but under poor weather conditions. Because Proxima is very bright at optical wavelengths ( 11.13), the integration times were only 30 seconds on Gemini-South. The flux differences between SCR 1848 and Proxima (SCR1848Proximaground) are shown in the bottom panel of Figure 4.
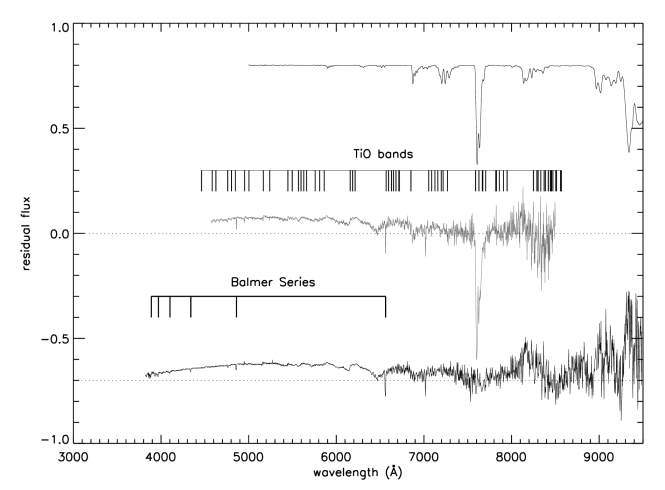
Spectroscopic observations of Proxima from HST/MAST were extracted to provide an additional comparison to our SCR 1848 spectra and to double-check our ground-based Proxima spectra. A blue spectral observation of Proxima (Y2WY0305T) was made in 1996 with HST’s Faint Object Camera (FOC) with an exposure time of 430 seconds in the G570H filter, with wavelength coverage of 4569–6817Å. A red spectral observation of Proxima (Y2WY0705T) was also made by the FOC in 1996, with an exposure time of 280 seconds in the G780H filter, with wavelength coverage of 6269–8498Å. As before, we use an overlap region spanning 500Å to merge the red and blue spectra from HST.
Shown in Figure 5 are the flux differences between SCR 1848 and Proxima using both the HST spectra for Proxima (gray line, SCR 1848ProximaHST) and our ground-based spectra (black line, SCR 1848Proximaground, same as in the bottom panel of Figure 4). The flux differences are virtually identical, other than in the telluric bands outlined in the spectrum at the top of the plot. Note that the Balmer lines appear as absorption features in the differential spectra because in Proxima those lines are in emission. These matching results give us confidence that our ground-based observations of Proxima, and presumably SCR 1848 as well given that it was observed using the same instrumental setup, are reliable. Mismatches redward of 6000Å are due primarily to differences in the precise strengths of the TiO bands between Proxima and SCR 1848. We see similar mismatches when comparing two M5.5V dwarfs. Blueward of 6500Å, the residual spectrum is evidently due to the unseen companion, and is effectively featureless.

2.5 Resolution of the Binary and Near-UV Photometry from HST
2.5.1 Matching sources on two HST-STIS images
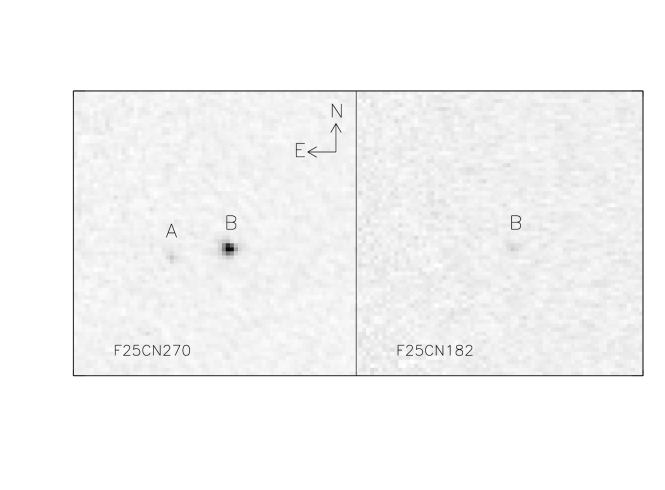
In an attempt to resolve the system, we imaged SCR 1848 on UT 2011 July 14 using HST-STISMAMA in two UV filters — F25CN270 at 2711Å and F25CN182 at 2004Å. The field of view was 25″25″ with a pixel scale of 24.6 mas/pixel. The observation logs, derived astrometry, and resulting photometry are given in Table 4. Figure 6 shows cropped images 17 on a side from HST-STISMAMA, revealing two sources in the F25CN270 filter, but only one very faint source in F25CN182. We note that there were no other sources detected in the full field in either filter.
Given the lack of other stars for reference in the field, we need to determine carefully which source is the M5.0V star and which is the previously unseen companion. First, we used the xy2rd task from the HST/STSDAS IRAF package to determine the coordinates of both sources in the F25CN270 image, yielding the results given in Table 4. The coordinates for the sources in the two F25CN270 images differ by 0.001 seconds in RA and 0004–0009 in DEC, where the differences come from a combination of the HST pointing accuracy, the image distortion correction and SExtractor’s centroiding accuracy. Because the separation between the two sources is 0349, which is much larger than the errors in the positions, and because the sole source in the F25CN182 image has a similar position as the bright source in the F25CN270 image, we conclude that the bright source is in both F25CN270 and F25CN182 images.
2.5.2 Identifying the red dwarf on HST-STIS images
To identify which source corresponds to which component, we explore what an M5.0 dwarf’s near-UV brightness is likely to be in the HST-STIS images. Proxima Centauri is an M5.0 dwarf similar to SCR 1848, and has IUE archived spectra covering 1851–3347Å that were extracted from the IUE/MAST archives. There are a total of 41 spectra of Proxima taken between 1979 and 1995. In this wavelength range, Proxima has no detected continuum flux, and the only prominent feature – the Mg II line at 2798Å – is stable throughout these 41 spectra. Buccino & Mauas (2008) indicate that both Mg II and Ca II H K lines are good indicators of the thermal structures of stellar atmospheres and Cincunegui et al. (2007) demonstrated a linear relation between Ca II and H. This implies a likely relation between Mg II and H lines. At optical wavelengths, Proxima exhibits a strong H emission feature and shows long-term variability in the band at a level of 29 milli-mags over 10.9 years333The variability of red dwarfs and cool subdwarfs using our astrometry frames is discussed in Jao et al. (2011).. This indicates that Proxima is active.
In contrast, we do not see strong H emission from SCR 1848 in its red spectrum so we expect SCR 1848 would have a weaker Mg II line than Proxima. The long-term variability of SCR 1848 in the band is only 9 millmags over 8.5 years, although this lower level might be expected because red dwarfs generally vary more in the band than in the band. However, four nights of photometry, which includes both internal (signal-to noise, variability) and external (extinction corrections, photometric standard star stability) errors for SCR 1848 show a variability of only 15 milli-mags in the band, only half that seen in Proxima’s long-term measurements. We conclude that SCR 1848 (a) has a quieter atmosphere than Proxima, (b) has weaker Mg II emission, and (c) should have less flux than Proxima from 1851–3347Å. Finally, as can be seen in Figure 4, the companion’s flux is significant blueward of 6500Å, and we anticipate that at the HST-STIS wavelengths, the blue component dominates the waning flux of the red dwarf. We therefore conclude that the source seen in both HST-STIS bands is the blue companion, and the fainter source seen in only the F25CN270 image is the red dwarf. The mean separation and position angle of companion measured from two F25CN270 images are 0349 and 2776 relative to the M5.0 dwarf at the mean epoch of 2011.5332. Also, it shows that faint background star discussed in section 2.1.1 observed in 2011 is not the same as this component because the background star is beyond the field of view of STISMAMA.
2.5.3 NUV Photometry from HST-STIS images
We performed aperture photometry on the HST-STIS images using SExtractor (Bertin & Arnouts, 1996). To determine photometry in the STMAG system, we calculated based on the detected counts and image exposure times, and used the equation () outlined in §5.3 of the STIS Data Handbook (Bostroem & Proffitt, 2011). Because the two sources are separated by only 14 pixels, we selected a standard 3-pixel radius aperture for the photometry and used the correction in Table 8 of the Instrument Science Report STIS 2003-001 (Proffitt et al., 2003) to derive aperture-corrected photometry. The mean values from the two F25CN270 images for A and B are 23.600.17 and 20.910.03, respectively, where A is the red dwarf. The mean for component B, the previously unseen companion and the sole object in the field, is 22.790.26.
| Image | UT | exposure | source | X | Y | separations | RA | Decl. | mag |
|---|---|---|---|---|---|---|---|---|---|
| (seconds) | (pixel) | (mas) | (mean) | ||||||
| F25CN270 | |||||||||
| 1 | 2011/07/14/20:26:00 | 3086 | B | 586.648 | 566.550 | 267/217 | 18:48:20.1958 | 68:55:48.705 | 20.910.03 |
| A | 575.812 | 557.713 | 18:48:20.2593 | 68:55:48.754 | 23.600.17 | ||||
| 2 | 2011/07/14/21:18:14 | 3349 | B | 596.849 | 566.372 | 278/219 | 18:48:20.1948 | 68:55:48.714 | |
| A | 585.552 | 557.481 | 18:48:20.2602 | 68:55:48.758 | |||||
| F25CN182 | |||||||||
| 1 | 2011/07/14/22:15:10 | 3330 | B | 588.237 | 567.504 | 18:48:20.1873 | 68:55:48.705 | 22.790.26 | |
| 2 | 2011/07/14/23:11:28 | 3349 | B | 597.885 | 567.686 | 18:48:20.1876 | 68:55:48.699 | ||
Note. — Pixel coordinates and RA and DEC for objects detected in the HST-STISMAMA images are given, as measured using SExtractor and the STSDAS xy2rd task. The separations in mas are given in the X and Y directions. The mean STMAG magnitudes of two sources in F25CN270 and the only source in F25CN182 are listed in the last column. The components are labelled as A and B in Figure 6.
3 Discussion
3.1 The Companion’s Temperature and Spectral Type
From the various observations of SCR 1848 outlined above, we have (1) detected a large perturbation on an M5.0V star at 24.6 pc caused by an unseen companion, (2) detected the excess band and NUV flux from the companion, (3) measured excess flux spectroscopically blueward of 6500Å, and (4) resolved the binary system. The next step is to determine the nature of the companion.
We simulated photometry for systems composed of the M5.0V red dwarf Proxima and various white dwarfs with from Bergeron et al. (2001). Basically, we move Proxima and white dwarfs to SCR 1848’s distance at 24.6 pc but keep the same absolute magnitudes. We calculate their combined flux and photometry in different filters to simulate unresolved M5.0VWD binaries. The results are shown in Figure 7. We found that to reproduce the combined photometry for SCR 1848, a white dwarf companion would need to have Teff5000K to have enough flux for the combined U photometry, but Teff4600K to match the flux indicated by the combined photometry. These results indicate that the blue companion could be a white dwarf with Teff4600–5000K444There are only five white dwarfs cooler than 5000K in Bergeron et al. (2001) having band photometry, which is from the White Dwarf Catalog (McCook & Sion, 1999)..

Given the resolution of the system via HST-STIS, we can estimate the temperature of the companion by generating a grid of model NUV colors () under the assumption that the secondary emits as a blackbody. To find the colors (observedmodeled) for given magnitudes, we used the calcphot task in the IRAF STSDAS/SYNPHOT package to generate synthetic photometry for the secondary. Based on the results shown in Figure 7, we explore temperatures of 4000K–5000K, and target magnitudes of 16–19 that correspond to the brightness anticipated at the distance of the SCR 1848 system. Our results indicate that the best match between the observed and modeled NUV colors (NUV0.03 mag) are for a blackbody with K, , and at the distance of SCR 1848. However, a known DA white dwarf with K, WD 1345238, would have 17.2 and 18.8, if it were moved to the distance of SCR 1848. It appears that the modeled white dwarf and magnitudes for SCR 1848 B are fainter than a typical field white dwarf with 4600K. To complicate matters further, as shown in the bottom panel of Figure 4, the residual flux peaks at 5300Å, corresponding to the peak of a 5500K blackbody curve, nearly 1000K hotter. So, the exact temperature and nature of the companion remains elusive and a blackbody curve may not be ideal to represent its spectrum, but its temperature is likely 4600–5500K.
The bottom panel of Figure 4 also shows that the companion’s spectrum appears to be featureless. According to McCook & Sion (1999), a DC white dwarf is defined to have a continuous spectrum with no lines deeper than 5% in any part of the electromagnetic spectrum. This definition appears to be consistent with the spectroscopic information we have for the companion. It implies a spectral type of DC if it is in fact a white dwarf. In the inferred temperature range (i.e., Teff 5500 K), the white dwarf will show different continuum features in the optical depending on atmospheric composition. The possible atmospheric compositions are 1) pure hydrogen, where collision induced absorption (CIA) occurs, 2) pure helium, where CIA is unimportant, or 3) mixed hydrogen and helium, where CIA occurs at hotter temperatures because of collisions with neutral helium (Bergeron & Leggett, 2002). Without knowing which model to apply, and how much the CIA affects its spectral energy distribution, the effective temperature remains uncertain, but is likely in the temperature range discussed above. Good S/N resolved photometry covering most of the SED of the companion is needed to best constrain the effective temperature (Kilic et al., 2010). For now, we estimate that the companion may be a DC type white dwarf.
3.2 The Companion’s Mass
The perturbation curve shown in Figure 1(a) maps the shift in position of the binary system’s photocenter and reveals information about the masses of the components. However, because our data do not yet cover a full orbital period for the system, we find that the perturbation curve is not stable, with a slope in the curve after 2006 that varies as more images are acquired. An additional caveat is available from the HST-STIS image, in which the B component is observed at a position angle of 2776 in mid-2011, where the position angle of the photocenter from our perturbation curve lies at 633. The position angle of the secondary should be 180∘ from the position of the photocenter offset, corresponding to 2433 rather than 2776, or a 343 difference. We could shift residuals or the photocenter to match the position angle from STIS images, but we would not be significantly more confident in the orbit. We expect this mismatch is because of the incomplete photocentric orbit from our astrometric observations.
| P | T0 | |||||
|---|---|---|---|---|---|---|
| (yr) | () | (∘) | (epoch) | () | () | |
| 15.17 | 0.2082 | 90.32 | 0.84 | 2004.58 | 280.74 | 248.08 |
| 3.25 | 0.0255 | 0.37 | 0.03 | 0.02 | 4.85 | 2.25 |
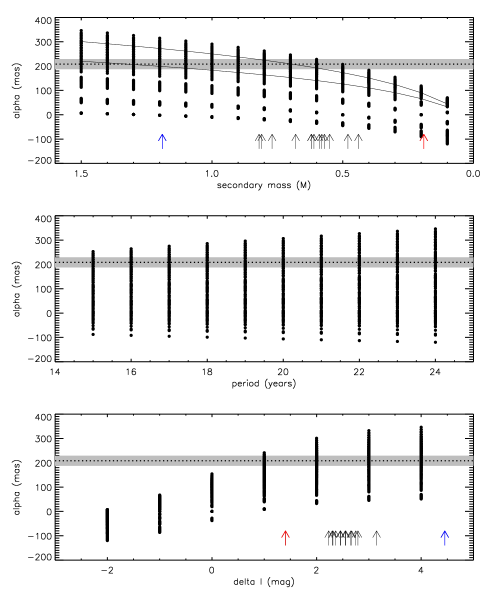
With these reservations in mind, we fit a photocentric orbit given in Table 5 using the methodology outlined in Hartkopf et al. (1989). Given the derived inclination is close to 90∘ or edge-on, these orbital elements are suspect. However, one thing is certain — the orbital period is longer than our observing sequence of 8.5 years, and is otherwise poorly constrained. From the preliminary fit to the data, we find that the semi-major axis of the photocentric orbit is at least 208 mas. We consider this a minimum semi-major axis given that the perturbation amplitude continues to grow as more frames are taken. We can use this value to constrain the mass of the companion by modeling using , where is the fractional mass (), is the relative luminosity (), and is the semi-major axis of the relative orbit of the two components (van de Kamp, 1967). is the magnitude difference in the band in this case, because we used the filter for the astrometric series. The modeled results are shown in Figure 8, in which possible secondaries have masses 0.1–1.5, are fainter by 0–4 mag at , and are in orbits with periods of 15–24 years. When constrained by 208 mas from our preliminary fit, we see that the secondary has and 1. This implies that the secondary is too massive to be brown dwarf, which is also consistent with our discovery that the secondary is bluer than the M5.0V primary at optical/UV wavelengths. The period, as expected, is poorly constrained, and of course limits our ability to measure the companion mass. For example, if the secondary has a period of 15 years and 2 (top solid line in the top panel of Figure 8), its mass is 0.7. If the secondary has a period of 24 years and 2 (bottom solid line in top panel of Figure 8), its mass is 1.3. As a final consideration of the companion’s mass, we compare 15 known cool white dwarfs with 4490–5000 K from Bergeron et al. (2001). Figure 8 shows most of these cool white dwarfs have masses of 0.4–0.9, and that their I magnitudes would be 2–3 magnitudes fainter than SCR 1848 after being placed at SCR 1848’s distance. Thus, we cannot constrain the mass at this time, so it is important that we continue to follow the system to determine an accurate mass for the companion, which would provide a rare mass measurement of a low-temperature white dwarf.
4 Conclusions
We present results of a nearby star system, SCR 1848, which has the largest perturbation among more than 700 targets observed in our long-term astrometry program at the CTIO 0.9-m. We present a suite of data from the CTIO 0.9-m, CTIO 1.5-m, Gemini-South Observatory, the NASA Galaxy Evolution Explorer, the International Ultraviolet Explorer, and Hubble Space Telescope, to study the nature of this intriguing system. Results show that this M5.0 dwarf has a blue excess that probably comes from a faint white dwarf with an effective temperature of 4600–5500K and a mass greater than 0.5. We have resolved the system using HST-STISMAMA, which provides hope that direct spectroscopic and photometric observations of the secondary are possible, and thereby a determination of its spectral type. Such low temperature and intrinsically faint white dwarfs are rarer than their hotter counterparts. For example, Rebassa-Mansergas et al. (2010) reported 1602 white-dwarf plus main-sequence star binaries from the Sloan Digital Sky Survey Data Release 6, but none of those white dwarfs nor main sequence stars is cooler than 6000K (see their Table 7). This work provides an alternative method for detecting low temperature white dwarfs. Given the large astrometric perturbation this type of system produces, it would be easy for astrometric programs like Pan-STARRS, Gaia or Large Synoptic Survey Telescope to detect such systems. Despite more than 8 years of astrometric observations, this system has not yet completed a full orbit, which limits our ability to determine accurate photocentric orbital elements and determine the component masses. We intend to continue observing SCR1848 until future efforts can provide crucial dynamical masses of a low temperature white dwarf and a low mass red dwarf.
5 Acknowledgments
The astrometric observations reported here began as part of the NOAO Surveys Program in 1999 and continued on the CTIO 0.9-m via the SMARTS Consortium starting in 2003. We gratefully acknowledge support from the National Science Foundation (grants AST 05-07711 and AST 09-08402), and NASA’s Space Interferometry Mission, which together have made this long-term effort possible. We also thank the members of the SMARTS Consortium, who enable the operations of the small telescopes at CTIO, as well as the members of the observing support team, specifically Edgardo Cosgrove, Arturo Gómez, Alberto Miranda, and Joselino Vásquez. We also thank Valery Suleimanov for discussions regarding the excess flux.
The NUV photometry is based on observations made with the NASA Galaxy Evolution Explorer. GALEX is operated for NASA by the California Institute of Technology under NASA contract NAS5-98034.
The Gemini observations were accomplished via the Gemini Observatory (GS-2010B-Q-15 and GS-2011A-Q-92), which is operated by the Association of Universities for Research in Astronomy, Inc., under a cooperative agreement with the NSF on behalf of the Gemini partnership: the National Science Foundation (United States), the National Research Council (Canada), CONICYT (Chile), the Australian Research Council (Australia), Ministério da Ciência, Tecnologia e Inovação (Brazil) and Ministerio de Ciencia, Tecnología e Innovación Productiva (Argentina).
The IUE data and archival spectra of Proxima presented in this paper were obtained from the Multimission Archive at the Space Telescope Science Institute (MAST). STScI is operated by the Association of Universities for Research in Astronomy, Inc., under NASA contract NAS5-26555. Support for MAST for non-HST data is provided by the NASA Office of Space Science via grant NAG5-7584 and by other grants and contracts.
The HST-STIS observations were supported for program number 12259 by NASA through a grant from the Space Telescope Science Institute, which is operated by the Association of Universities for Research in Astronomy, Inc., under NASA contract NAS5-26555.
This research has made use of the SIMBAD database, operated at CDS, Strasbourg, France. This work also has used data products from the Two Micron All Sky Survey, which is a joint project of the University of Massachusetts and the Infrared Processing and Analysis Center at California Institute of Technology funded by NASA and NSF.
References
- Bergeron et al. (2001) Bergeron, P., Leggett, S. K., & Ruiz, M. T. 2001, ApJS, 133, 413
- Bergeron & Leggett (2002) Bergeron, P., & Leggett, S. K. 2002, ApJ, 580, 1070
- Bertin & Arnouts (1996) Bertin, E. & Arnouts, S. 1996, A&AS, 117, 393
- Bostroem & Proffitt (2011) Bostroem, K. & Proffitt, C., STIS Data Handbook, Version 6.0, 2011, (Baltimore:STScI)
- Buccino & Mauas (2008) Buccino, A. P., & Mauas, P. J. D. 2008, A&A, 483, 903
- Cincunegui et al. (2007) Cincunegui, C., Díaz, R. F., & Mauas, P. J. D. 2007, A&A, 461, 1107
- Dieterich et al. (2012) Dieterich, S. B., Henry, T. J., Golimowski, D. A., Krist, J. E., & Tanner, A. M. 2012, AJ, 144, 64
- Hambly et al. (2004) Hambly, N. C., Henry, T. J., Subasavage, J. P., Brown, M. A., & Jao, W.-C. 2004, AJ, 128, 437
- Hartkopf et al. (1989) Hartkopf, W. I., McAlister, H. A., & Franz, O. G. 1989, AJ, 98, 1014
- Hawley et al. (1996) Hawley, S. L., Gizis, J. E., & Reid, I. N. 1996, AJ, 112, 2799
- Henry et al. (2004) Henry, T. J., Subasavage, J. P., Brown, M. A., et al. 2004, AJ, 128, 2460
- Henry et al. (2006) Henry, T. J., Jao, W.-C., Subasavage, J. P., Beaulieu, T. D., Ianna, P. A., Costa, E., & Méndez, R. A. 2006, AJ, 132, 2360
- Hinkle et al. (2003) Hinkle, K. H., Wallace, L., & Livingston, W. 2003, Bulletin of the American Astronomical Society, 35, 1260
- Jao et al. (2005) Jao, W.-C., Henry, T. J., Subasavage, J. P., Brown, M. A., Ianna, P. A., Bartlett, J. L., Costa, E., & Méndez, R. A. 2005, AJ, 129, 1954
- Jao et al. (2008) Jao, W.-C., Henry, T. J., Beaulieu, T. D., & Subasavage, J. P. 2008, AJ, 136, 840
- Jao et al. (2011) Jao, W.-C., Henry, T. J., Subasavage, J. P., et al. 2011, AJ, 141, 117
- Kilic et al. (2010) Kilic, M., Leggett, S. K., Tremblay, P.-E., et al. 2010, ApJS, 190, 77
- Koen et al. (2010) Koen, C., Kilkenny, D., van Wyk, F., & Marang, F. 2010, MNRAS, 403, 1949
- McCook & Sion (1999) McCook, G. P., & Sion, E. M. 1999, VizieR Online Data Catalog, 3210, 0
- Proffitt et al. (2003) Proffitt, C., Brown, T. M., Mobasher, B., and Davies J., 2003, Instrumental Science Report, 2003-001, (Baltimore:STScI)
- Rebassa-Mansergas et al. (2010) Rebassa-Mansergas, A., Gänsicke, B. T., Schreiber, M. R., Koester, D., & Rodríguez-Gil, P. 2010, MNRAS, 402, 620
- Reid et al. (1995) Reid, I. N., Hawley, S. L., & Gizis, J. E. 1995, AJ, 110, 1838
- Riedel et al. (2010) Riedel, A. R., Subasavage, J. P., Finch, C. T. et al. 2010, AJ, 140, 897
- Riedel et al. (2011) Riedel, A. R., Murphy, S. J., Henry, T. J., et al. 2011, AJ, 142, 104
- Skrutskie et al. (2006) Skrutskie, M. F., Cutri, R. M., Stiening, R. et al. 2006, AJ, 131, 1163
- Subasavage et al. (2009) Subasavage, J. P., Jao, W.-C., Henry, T. J., Bergeron, P., Dufour, P., Ianna, P. A., Costa, E., & Méndez, R. A. 2009, AJ, 137, 4547
- Turnshek et al. (1985) Turnshek, D. E., Turnshek, D. A., & Craine, E. R. 1985, An Atlas of Digital Spectra of Cool Stars, (Tucson: Western Research Company)
- van Altena et al. (1995) van Altena, W. F., Lee, J. T., & Hoffleit, D. 1995, The General Catalogue of Trigonometric Stellar Parallaxes (4th ed.; New Haven: Yale Univ. Obs.)
- van de Kamp (1967) van de Kamp, P., 1967, Principles of Astrometry (San Francisco: W. H. Freeman and company)
- Winters et al. (2011) Winters, J. G., Henry, T. J., Jao, W.-C., et al. 2011, AJ, 141, 21