11email: ducci@astro.uni-tuebingen.de 22institutetext: INAF, Istituto di Astrofisica Spaziale e Fisica Cosmica - Milano, Via E. Bassini 15, I-20133 Milano, Italy 33institutetext: INAF, Istituto di Astrofisica Spaziale e Fisica Cosmica - Palermo, Via U. La Malfa 153, I-90146 Palermo, Italy
Spectral and temporal properties of the supergiant fast X-ray transient IGR J18483–0311 observed by INTEGRAL
Abstract
Context. IGR J184830311 is a supergiant fast X-ray transient whose compact object is located in a wide (18.5 d) and eccentric () orbit, which shows sporadic outbursts that reach X-ray luminosities of 1036 erg s-1.
Aims. We investigated the timing properties of IGR J184830311 and studied the spectra during bright outbursts by fitting physical models based on thermal and bulk Comptonization processes for accreting compact objects.
Methods. We analysed archival INTEGRAL data collected in the period 2003–2010, focusing on the observations with IGR J184830311 in outburst. We searched for pulsations in the INTEGRAL light curves of each outburst. We took advantage of the broadband observing capability of INTEGRAL for the spectral analysis.
Results. We observed 15 outbursts, seven of which we report here for the first time. This data analysis almost doubles the statistics of flares of this binary system detected by INTEGRAL. A refined timing analysis did not reveal a significant periodicity in the INTEGRAL observation where a 21 s pulsation was previously detected. Neither did we find evidence for pulsations in the X-ray light curve of an archival XMM-Newton observation of IGR J184830311. In the light of these results the nature of the compact object in IGR J184830311 is unclear. The broadband X-ray spectrum of IGR J184830311 in outburst is well fitted by a thermal and bulk Comptonization model of blackbody seed photons by the infalling material in the accretion column of a neutron star. We also obtained a new measurement of the orbital period using the Swift/BAT light curve.
Key Words.:
X-rays: binaries – stars: individual: IGR J18483-0311 - stars: neutron – X-rays: stars1 Introduction
In the past decade a new generation of sensitive hard X-ray telescopes led to the discovery of a new class of high-mass X-ray binaries (HMXBs) with supergiant companions that are called supergiant fast X-ray transients (SFXTs; Smith et al. 2004; Sguera et al. 2005; Negueruela et al. 2006). The large majority of the members of this class were discovered thanks to the monitoring of the Galactic plane performed by INTEGRAL (INTErnational Gamma-Ray Astrophysics Laboratory). SFXTs show sporadic outbursts lasting a few days composed of flares lasting from minutes to hours (Romano et al. 2007; Sidoli et al. 2009). SFXTs are also characterized by a wide dynamic range, spanning three to five orders of magnitude, from a quiescent luminosity of erg s-1 to the outburst peak luminosity of erg s-1 (in’t Zand, 2005). The X-ray spectra of this class can be fitted with models used to describe the X-ray emission from HMXBs that host pulsars (e.g. Walter & Zurita Heras 2007). Currently, there are ten confirmed SFXTs, five of which have a detected periodic signal that has been interpreted as the spin period of an X-ray pulsar (see e.g. Sidoli 2013). Different accretion mechanisms have been proposed to explain the properties of SFXTs. These involve accretion from an inhomogeneous and anisotropic wind (see e.g. in’t Zand 2005; Sidoli et al. 2007; Negueruela et al. 2008), gating mechanisms (Grebenev & Sunyaev 2007; Bozzo et al. 2008), and intermittent accretion flow onto a neutron star (e.g. Lamb et al. 1977; Ducci et al. 2010).
IGR J184830311 is an SFXT discovered in 2003 April by Chernyakova et al. (2003) during an observation of the Galactic Centre field with the IBIS/ISGRI instrument onboard the INTEGRAL satellite. These authors observed a transient X-ray emission with a flux of 10 mCrab in the keV band that suddenly increased to 40 mCrab during a 30 minutes flare on 2003 April 26. After its discovery, Molkov et al. (2003, 2004) reported other INTEGRAL detections of IGR J184830311 in 2003 March-May, while in’t Zand et al. (2004) reported earlier detections of IGR J184830311 with the BeppoSAX Wide Field Cameras in 1997 April 26 and 1996 July-December. Chernyakova et al. (2003) suggested a possible association with the ROSAT/HRI source 1RXH J184817.3-031017. Two optical sources in the USNO-B1 catalogue (Monet et al., 2003), one of which was also detected at near-infrared wavelengths in the 2MASS catalogue (Skrutskie et al., 2006), were found within the X-ray positional uncertainty of the HRI instrument (Stephen et al., 2006). No significant radio emission was found within the error circle of IGR J184830311 (Pandey et al., 2006).
Levine & Corbet (2006) detected a periodicity of 18.55 d in the Rossi X-ray Timing Explorer (RXTE) All-Sky Monitor (ASM) X-ray light curve, interpreted as the orbital period of IGR J184830311 (Rahoui & Chaty, 2008). This measurement was refined by Levine et al. (2011) to d by using the RXTE/ASM light curve.
Sguera et al. (2007) reported the observation of five new outbursts and a periodicity of s in the keV INTEGRAL/JEM-X light curve during the outburst of 2006 April 19. They also searched for periodicities with the IBIS/ISGRI instrument onboard the INTEGRAL satellite, but no pulsations were detected. Sguera et al. (2007) attributed the 21 s periodicity to the spin period of an X-ray pulsar. Giunta et al. (2009) observed IGR J184830311 with XMM-Newton during a low-luminosity state ( erg s-1). They searched for the periodicity reported by Sguera et al. (2007) by computing a power spectrum of the XMM-Newton data, but did not find significant evidence for pulsations. Then, they searched for it in a small window centred on s by performing Rayleigh () analysis (Buccheri et al., 1983), and reported the detection of a periodicity at s as the most significant peak within the examined range.
Sguera et al. (2007) fitted the broad-band joint INTEGRAL spectrum (JEM-X + IBIS/ISGRI, keV) of IGR J184830311 during the outburst in 2006 April 19 with an absorbed cutoff power-law with , keV, and cm-2. Based on the X-ray spectral shape, the detected periodicities, the high intrinsic absorption, and the highly reddened optical counterpart, Sguera et al. (2007) proposed that IGR J184830311 is an HMXB with a neutron star.
Chaty et al. (2008) and Rahoui & Chaty (2008) performed optical and near-infrared photometry and spectroscopy of the donor star of IGR J184830311, showing that it is a B0.5a supergiant. The nature of the donor star together with the fast X-ray transient activity that characterizes IGR J184830311 led Rahoui & Chaty (2008) to the conclusion that the source is an SFXT. The spectral classification of the donor star was more recently refined by Torrejón et al. (2010). They found that the donor star is a B0.5-B1 Iab located at 2.8 kpc.
Romano et al. (2010) reported the results from a Swift monitoring of IGR J184830311 lasting 28 d, consecutively covering more than one orbital period. The orbital modulation of the Swift/XRT light curve was interpreted as wind accretion along a highly eccentric orbit (Romano et al., 2010). The dynamical range of IGR J184830311 observed during the Swift/XRT monitoring was wider than . Superimposed on the long-term orbital modulation, IGR J184830311 showed the typical variability of SFXTs on time scales of a few hours. Romano et al. (2010) interpreted the flaring activity of IGR J184830311 in terms of the accretion of an inhomogeneous wind, using the clumpy-wind model of Ducci et al. (2009). Grebenev (2009) proposed another interpretation based on gating mechanisms, where magnetic and centrifugal barriers (which depend on the spin period and magnetic field of the neutron star) influence the accretion rate, producing the observed flaring activity.
Swift, XMM-Newton, and INTEGRAL observations of IGR J184830311 spanning luminosities from 1033 erg s-1 to 1036 erg s-1 did not show an appreciable change in the spectral shape (Romano et al. 2010; Giunta et al. 2009; Sguera et al. 2007).
In this paper we present a spectral and timing analysis of the SFXT IGR J184830311. We used archival INTEGRAL data collected during the period 2003–2010 (corresponding to a total exposure time of 381 ks) with emphasis on the INTEGRAL pointings showing IGR J184830311 in outburst. Taking advantage of the high broadband observing capability of INTEGRAL, we applied phenomenological spectral models and, for the first time for this source, physical models typically used to describe the X-ray emission from accreting compact objects. We also performed a timing analysis of the INTEGRAL light curves of IGR J184830311 to search for periodic signals. For this purpose, we also reanalysed an archival XMM-Newton observation. The observations and data analysis methods are described in Sect. 2. We report on our results and discuss them in Sects. 3 and 4.
| No. | Obs. date | Orbital | ||
|---|---|---|---|---|
| (MJD) | revolution | (ks) | ||
| 1a | 52735.252735.5 | 0058 | 7.5 | |
| 2b | 52755.252755.4 | 0065 | 3.6 | |
| 3c | 52770.952772.1 | 0070 | 29.0 | |
| 4c | 53082.953083.4 | 0174 | 10.0 | |
| 5c | 53121.753122.6 | 0187, 0188 | 91.3 | |
| 6c | 53253.253253.6 | 0231 | 13.5 | |
| 7d | 53663.253663.8 | 0368 | 20.8 | |
| 8c | 53844.653846.0 | 0429 | 51.1 | |
| 9e | 54364.454365.2 | 0603 | 46.4 | |
| 10e | 54924.654925.0 | 0790 | 18.1 | |
| 11e | 54926.554928.2 | 0791 | 21.5 | |
| 12e | 55109.155109.3 | 0852 | 15.8 | |
| 13e | 55274.355274.8 | 0907 | 17.5 | |
| 14e | 55280.255281.8 | 0909 | 14.2 | |
| 15e | 55284.355284.9 | 0910 | 19.8 |
2 Observations and data analysis
2.1 INTEGRAL
The ESA satellite INTEGRAL, launched on 2002 October 17 (Winkler et al., 2003), carries three X-ray and gamma-ray instruments. In this paper we used the imager IBIS (Imager on Board INTEGRAL Satellite, Ubertini et al. 2003), and the X-ray monitors JEM-X (Joint European Monitor for X-ray; Lund et al. 2003), which are co-aligned with overlapping fields of view and operate simultaneously with IBIS.
IBIS is a coded-mask telescope composed of two detector arrays: ISGRI (INTEGRAL Soft Gamma-Ray Imager, Lebrun et al. 2003), operating in the 15400 keV band, and PICsIT (Pixellated Imaging CaeSium Iodide Telescope, Di Cocco et al. 2003), operating in the 1802000 keV band. IBIS has a fully coded field of view of , and a partially coded field of view of .
JEM-X consists of two coaligned coded mask telescopes, JEM-X1 and JEM-X2, which are switched on alternately during the mission. JEM-X allows imaging, spectral, and timing analyses in the energy range of keV. The fully illuminated JEM-X field of view has a diameter of .
INTEGRAL orbits Earth with a highly eccentric orbit with a revolution period of about 72 hours. Each orbital revolution consists of pointings of about 2000 s called science windows (ScWs).
We performed the reduction and analysis of IBIS/ISGRI and JEM-X data using the Off-line Science Analysis (OSA) 10.0 software (Goldwurm et al., 2003). We analysed the public data between 2003 January and 2010 December where IGR J184830311 was in the IBIS/ISGRI field of view. We only considered ScWs where IGR J184830311 was detected with at least significance in the energy 1850 keV (corresponding to an exposure time of about ks).
For the spectral analysis we only considered ScWs with IGR J184830311 within from the centre of the (IBIS/ISGRI) field of view. We introduced this filter because at larger off-axis angle the IBIS response is not well known111see the INTEGRAL data analysis documentation: http://www.isdc.unige.ch/integral/analysis#Documentation. We performed spectral analysis with XSPEC (ver. 12.7.0). Systematic uncertainties of 1% for IBIS/ISGRI and 3% for JEM-X were added to our data sets (according to the IBIS/ISGRI and JEM-X data analysis documentation).
We obtained JEM-X light curves with a time resolution of s in the energy range keV. For the timing analysis with IBIS/ISGRI data we used the ii_light routine222For a description of the tool ii_light, see http://www.isdc.unige.ch/integral/download/osa/doc/10.0/osa_um_ibis/Cookbook.html to obtain keV light curves with a time resolution of s. The bin times were corrected to the solar system barycentre.
2.2 XMM-Newton
IGR J184830311 has been observed with XMM-Newton on 2006 October 12 (ObsID 0406140201) with a single 19 ks exposure observation.
The data analysis was performed through the XMM-Newton Science Analysis System (SAS) software (version 13.0.0). We rejected time intervals affected by high background due to proton flares, obtaining a total good exposure time of 14.4 ks. We produced calibrated event lists for pn, MOS1, and MOS2 using the EPPROC (for pn) and EMPROC (for the two MOS cameras) tasks. We reproduced the data reduction of Giunta et al. (2009), hence we considered for timing analysis only the pn event file, because of the poor statistics in the MOS event files. We extracted a keV source light curve in a circular region with a radius of . The background light curve was extracted in a source-free circular region with radius of the same chip as the source. We selected events with PATTERN4 for the pn. We corrected the times of the light curves to the solar system barycentre with the BARYCEN task, using the ephemeris JPL DE405 (see e.g. Hobbs et al. 2006).
3 Timing analysis
We analysed archival INTEGRAL observations with IGR J184830311 in outburst, during the period 2003–2010. We report the detection of seven previously unknown outbursts and eight outbursts previously observed with INTEGRAL by Chernyakova et al. (2003), Molkov et al. (2003), Sguera et al. (2007), and Ducci et al. (2010). With this we almost double the number of outbursts detected with INTEGRAL. Table 1 shows the list of 15 outbursts detected with INTEGRAL with a significance in the energy range keV.
Seven outbursts were observed with JEM-X. The duration of the observations are of the order of hours to a few days. Since IGR J184830311 was not always in the IBIS field of view during the outbursts, we cannot constrain their total duration with our observations. A lower limit can be inferred from the observation date column of Table 1.
These observations show fast and transient flares, with durations of a few hours. These flares are the brightest part ( erg s-1) of a more complex flaring activity that characterizes SFXTs and extends to erg s-1 (Sidoli et al., 2008). Because of the sensitivity limit of INTEGRAL, we cannot study the flaring behaviour of IGR J184830311 as a whole, which, on the other hand, has been studied by Romano et al. (2010) using the X-ray monitoring along an entire orbital period performed by Swift/XRT.

3.1 Orbital X-ray modulation
We searched for the orbital period using the long-term Swift/BAT light curve (averaged over the Swift orbital period of 90 minutes in the energy band keV) of IGR J184830311 provided by the Swift/BAT team. We retrieved the Swift/BAT orbital light curve covering the data range from 2005 February 14 to 2013 May 6 (MJD range 5341556418) from the BAT Transient Monitor (Krimm et al., 2006, 2013) page333http://swift.gsfc.nasa.gov/docs/swift/results/transients/ . We excluded poor-quality points (quality flag 1, 2, and 3) and corrected the screened light curve for Earth’s motion using the earth2sun tool of the HEASARC software package FTOOLS v.6.12 (Blackburn, 1995). We obtained a first estimate of the orbital period by applying an epoch-folding period search (we used the FTOOL efsearch). We refined the period measurement by means of a phase-fitting technique (see e.g. Dall’Osso et al. 2003 for details). The resulting orbital period is ( confidence level. at confidence level). This measurement approaches the precision of the value determined by Levine et al. (2011) using RXTE/ASM data, and it is consistent with it within c.l. The folded Swift/BAT light curve of IGR J184830311 is shown in Fig. 1.
We also searched for the orbital period using the IBIS/ISGRI light curve of IGR J184830311 ( keV) provided by the online tool Heavens444http://www.isdc.unige.ch/integral/heavens of the INTEGRAL Science Data Centre. The light curve covers all publicly available IBIS/ISGRI data of this source between 2003 March 6 to 2010 November 18 (MJD range 5270455518). The resulting measurement of the orbital period of () is consistent with the orbital period measurement obtained with the Swift/BAT data. We used the measurement with Swift/BAT data of the orbital period and MJD to calculate the orbital phases of the outbursts (see Table 1).

3.2 Searching for X-ray pulsations
3.2.1 INTEGRAL
We carried out a search for periodicity with both JEM-X and IBIS/ISGRI data with the aim of monitoring the long-term evolution of the pulse period of IGR J184830311.
For each new outburst (Table 2), we extracted JEM-X ( keV) and IBIS/ISGRI ( keV) light curves. We applied the epoch-folding and the fast Lomb-Scargle periodogram techniques (Press & Rybicki 1989; Scargle 1982; Lomb 1976). The search for a timing feature was performed within 2 s and s. For each time series, we estimated the number of independent frequencies in the Lomb-Scargle periodograms using the formula (eq. 13) of Horne & Baliunas (1986).
Since no statistically significant periodicities were detected in the new outbursts, we performed a new timing analysis on the previously discovered outbursts of IGR J184830311 (Table 2). In particular, we focused our attention on outburst No. 8, where a periodic signal at 21 s was detected by Sguera et al. (2007) in the JEM-X light curve. We searched the 21 s signal in both JEM-X and IBIS/ISGRI light curves, but no statistically significant periodicity was detected.
We also performed a timing analysis on the JEM-X light curve by varying the bin time from to s and for three different energy ranges: keV, keV (the energy band adopted by Sguera et al. 2007), and keV.
Fig. 2 shows the Lomb-Scargle periodogram obtained with the keV JEM-X light curve (bin time 1 s) of outburst No. 8. The dashed red line corresponds to a false-alarm probability of 0.1%. We performed Monte Carlo simulations on this observation to set a 3 upper limit on the pulsed fraction between 15 and 25 s. We found an upper limit of 28% in the keV JEM-X light curve.
For each outburst, we also searched for periodicities on very short time-scales, up to milliseconds, in the IBIS/ISGRI and JEM-X event arrival times, both corrected to the solar system barycentre. To increase the signal-to-noise ratio we selected only events with a pixel illuminated fraction (PIF, pixel fraction illuminated by the source) equal to 1. Again, no statistically significant periodicity was detected.
We also repeated the data analysis for outburst No. 8 with the previous versions of the analysis software available to us (OSA 6.0 to 9.0). The results are compatible with those obtained using OSA 10.0. Since OSA 5.1, used by Sguera et al. (2007), was not available to us, we cannot completely reproduce their data analysis, hence we cannot establish the origin of the difference in results.

3.2.2 XMM-Newton
After extracting the pn event files, we searched for a periodic modulation in the keV barycentred event arrival times of IGR J184830311. The periodicity search was limited by the s time resolution of pn (in full-frame mode) and the total duration of the observation ( ks).
We performed the H-test (de Jager et al., 1989) in the frequency range Hz. No significant features appeared in the H-test periodogram. We confirm the presence of a peak in the periodogram at frequency 0.0475 Hz. By applying the test for 1 to 4 harmonics we found at 0.0475 Hz a significant contribution from the second harmonic (, ). Fig. 3 shows the periodogram obtained from the keV pn arrival times of IGR J184830311.
The probability to obtain a noise peak of in a single trial is , which corresponds to a detection of pulsations at a confidence level of %. The probability to obtain that noise peak in independent trials is (where 4 is the number of harmonics at which the test has been performed), which corresponds to a detection of a pulsation at a confidence level of %. Therefore, the signal at 21 s is most likely due to a statistical fluctuation. We used the highest observed peak in the periodogram and Monte Carlo simulations to set a limit to a true signal. The 3 upper limit on the pulsed fraction of a sinusoidal signal is 30% in the 0.5–10 keV band and for periods between 15 s and 25 s. We point out that our results are compatible with those of Giunta et al. (2009). The main difference lies in the size of the window of frequencies where the search was carried out. On the basis of the periodicity reported by Sguera et al. (2007), Giunta et al. (2009) searched for a periodicity in a small window centred on s. In light of the new results obtained in Sect. 3.2.1 from the analysis of the JEM-X data of the outburst No. 8, we selected a wider window of frequencies, which reduces the significance of the peak reported by Giunta et al. (2009).
| No. | keV peak flux | ISGRI spectral parameters | JEM-X ISGRI spectral parameters | |||||
|---|---|---|---|---|---|---|---|---|
| erg cm-2 s-1 | (keV) | (d.o.f.) | ( cm-2) | (keV) | (d.o.f.) | |||
| 1 | ||||||||
| 2 | ||||||||
| 3 | ||||||||
| 4 | ||||||||
| 5 | ||||||||
| 6 | ||||||||
| 7 | ||||||||
| 8 | ||||||||
| 9 | ||||||||
| 10 | ||||||||
| 11 | ||||||||
| 12 | ||||||||
| 13 | ||||||||
| 14 | ||||||||
| 15 | ||||||||
4 Spectral analysis
We fitted the IBIS/ISGRI spectra of the newly discovered outbursts of Table 1 with several spectral models. We also repeated the spectral analysis of outbursts Nos. 1-8 to benefit from the new energy calibration of IBIS/ISGRI that has been implemented in OSA 10 (see e.g. Caballero et al. 2013). We also simultaneously fitted IBIS/ISGRI and JEM-X spectra of the outbursts for which JEM-X data were available. We included constant factors in the spectral fitting to allow for normalization uncertainties between the instruments.
For each outburst, we obtained good fits with power-law or cutoff power-law models (see Table 2). Outbursts Nos. 5 and 8 have the longest exposure time. Their spectra are best reproduced with an absorbed cutoff power-law model. A power-law (absorbed when JEM-X data were available) is an adequate description of the observed spectrum for the remaining 13 outbursts, which have the poorest quality data sets. We point out that these spectra can be well fitted by a simple absorbed power-law because of their poor statistics coupled with the high e-folding energy (whose value is inversely proportional to the slope of the spectrum at energies above the energy cutoff) that we obtained from the average fit of the spectrum of IGR J184830311 with a high-energy cutoff component (highecut in XSPEC, see below). The spectral parameters we obtained agree with previous studies of the hard X-ray spectrum of IGR J184830311 (see Sect. 1).
We derived column densities in excess of the one along the line of sight ( cm-2; Kalberla et al. 2005). The measured varies from cm-2 (outburst No. 8) to cm-2 (outburst No. 14). However, all of the measured values of between observations are compatible within their associated errors. Similarly high and variable column densities have been observed in many INTEGRAL HMXBs (e.g. Tomsick et al. 2009). For IGR J184830311, there is no evidence (here and in previous works) for a correlation of the column density with the source flux (see Table 2).
We did not find evidence of variability in the X-ray spectrum between different outbursts and for different luminosities. Therefore, we extracted the average JEM-X1, JEM-X2, and IBIS/ISGRI spectra and fitted them with several phenomenological models.
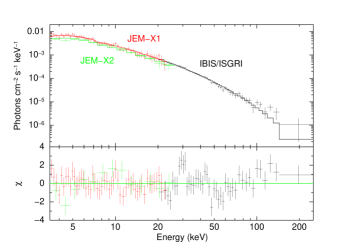
A simple absorbed power-law gave an unacceptable fit with a high , caused mostly by strong residuals at the lowest (below 5 keV) and highest energies (above 50 keV). Replacing the power-law with a cutoff power-law or a power-law modified at energies above the energy cutoff by , (where is called e-folding energy) improved the fit (see Table 3).
| Parameter | cutoff power-law | power-law with |
|---|---|---|
| high-energy cutoff | ||
| ( cm-2) | ||
| (keV) | ||
| (keV) | ||
| (d.o.f.) | () | () |
| Parameter | COMPTT | COMPMAG |
| ( cm-2) | ||
| (keV) | ||
| (keV) | ||
| normalization | ||
| (d.o.f.) | (100) | (100) |
The fit with a simple cutoff power-law has a better compared with the high-energy cutoff power-law model, which overfits the data with a of . The high-energy cutoff power-law model is typically used to describe the X-ray emission from accreting compact objects in HMXBs. We obtained , keV, and keV (see Fig. 4 and Table 3). The energy cutoff and the e-folding energy obtained from the fit show that the X-ray spectrum of IGR J184830311 is harder than the X-ray spectra of typical HMXBs. Indeed, typically ranges from keV to keV, and from keV to keV (see e.g. Coburn et al. 2002; White et al. 1983). Although the and residuals of the fit with an absorbed power-law with high-energy cutoff are acceptable, a positive trend above 50 keV, ascribable to a poorly modelled hard excess, is present in the residuals.
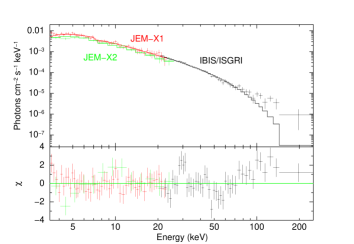
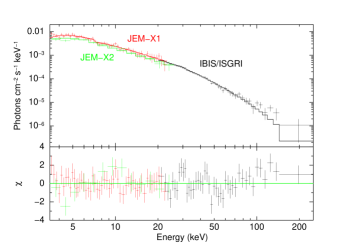
To better reproduce the shape of the observed spectrum we also fitted the spectrum with the physical models COMPTT (Titarchuk, 1994) and COMPMAG (Farinelli et al., 2012a).
COMPTT is an analytic model developed by Titarchuk (1994), which can reproduce the spectrum emerging from the Comptonization of soft photons with temperature by a hot plasma of electrons with temperature and optical depth . The input spectrum for the seed photons is a Wien law. The origin of the seed photons is often associated with the accretion disc or the neutron star.
COMPMAG (Farinelli et al., 2012a) is designed to reproduce the spectrum of a magnetized accreting pulsar, in the case of cylindrical accretion on to the polar cap of the neutron star. The authors considered a blackbody spectrum of seed photons Comptonized by the plasma. Both thermal and bulk Comptonization were considered. The parameters of the model are the temperature of the blackbody seed photons, the electron temperature , the vertical optical depth of the comptonization plasma, the radius of the accretion column , and the albedo at the star surface . The blackbody photons are produced by the accreted matter throughout the accretion column. The COMPMAG model also allows one to select the velocity profile of the infalling material in the accretion column between two options: a velocity increasing towards the neutron star surface (where is also a parameter that controls the steepness of the vertical velocity profile, and is the altitude above the surface of the neutron star) or, following Becker & Wolff (2007), a decelarating profile . If the first option is selected, and the parameter , which governs the terminal velocity of the accreting matter at the neutron star surface, are also introduced as spectral parameters.
Following the procedure applied by Farinelli et al. (2012b) to the Swift spectra of the SFXTs XTE J1739302 and IGR J175442619, we assumed an increasing velocity of the infalling material towards the neutron star surface and set and or . We also set (in units of the neutron star Schwarzschild radius) and .
We obtained acceptable fits with either COMPTT (with both spherical and disc geometry) or COMPMAG models (Fig. 5; Table 3). The spectral fits with the absorbed COMPTT (Fig. 5) shows a hard excess at energies above 80 keV. To a lesser extent, the absorbed COMPMAG also shows a positive trend in the residuals that could indicate a hard excess above 80 keV. We noticed that a positive trend in the residuals above 50 keV was also present in the spectral fits of the outbursts with the highest quality data sets (outbursts 5 and 8). To determine whether the hard excess observed in the average spectrum was not solely due to the data sets of outbursts 5 and 8, we produced an average JEM-X and IBIS/ISGRI spectrum without these two outbursts. We found that the hard excess was still present in the spectral fit. We tested for a hard excess above 80 keV using the F-test. We added a power-law with a pegged normalization (pegpwrlw in XSPEC) component to the absorbed COMPMAG spectral model and obtained an acceptable fit with (98 d.o.f.) without the hard excess in the residuals. The photon index of the power-law is , and we set the energy ranges of the power-law to keV. The F-test gives a % probability of a chance improvement of the , which is not significant at the 3 level.
We compared the spectral parameters resulting from the fit of the IGR J184830311 spectrum with COMPMAG with previously reported uses of this model. With the exception of the electron temperature , the best-fit parameters of IGR J184830311 agree with the values from the joint XRT/BAT spectra of the SFXTs XTE J1739302 and IGR J175442619 (Farinelli et al., 2012b). The obtained value of in IGR J184830311 (23 keV) is significantly higher than those obtained by Farinelli et al. (2012b) for XTE J1739-302 and IGR J17544-2619 ( keV, keV respectively). The high electron temperature resulting from the fit of the IGR J184830311 spectrum is appropriate to account for the relatively hard X-ray emission observed by INTEGRAL.
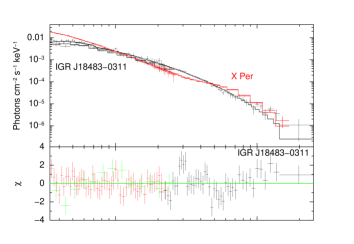
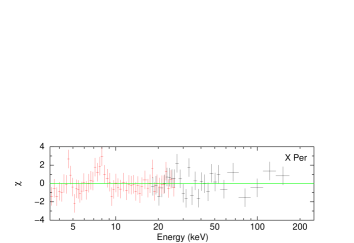
The hard X–ray spectrum of IGR J184830311 during outbursts is not typical of HMXBs. However, the HMXB X Persei shows an extremely hard X-ray spectrum (Doroshenko et al. 2012 and references therein). It is a persistent accreting pulsar with a spin period of about s, which orbits around a Be star in 250 days in an eccentric orbit (). Recently, Doroshenko et al. 2012 extracted an average spectrum using data from ISGRI, the spectrometer on INTEGRAL (SPI; Vedrenne et al. 2003), and JEM-X1 instruments ( ks). They modelled the keV INTEGRAL spectrum of X Persei with a model with two Comptonization components with independent electron temperatures and optical depths, where the component at lower energies describes the thermal Comptonization and the component at higher energies describes the bulk Comptonization in the accretion flow of the soft photons emerging from the polar cap.
5 Conclusions
We analysed archival INTEGRAL data of the SFXT IGR J184830311, covering the data range 2003–2010 (corresponding to an exposure time of 381 ks). We detected 15 outbursts, seven of which are reported for the first time.
A timing analysis performed on the IBIS/ISGRI, JEM-X, and XMM-Newton light curves of IGR J184830311 did not reveal a significant periodicity. In particular, we did not find the pulsation at 21 s in the JEM-X and XMM-Newton observations where it was previously detected by Sguera et al. (2007) and Giunta et al. (2009). In light of the results reported here and in previous works (see Sect. 1), the lack of detecting a periodic signal attributable to the spin period of a pulsar may be due to the low statistics of the available data sets, a weak magnetic field of the neutron star, or an alignment of the spin and magnetic-field axes. Alternatively, the compact object may be a black hole. We point out that there are no confirmed black holes in SFXTs to date. Therefore, such an identification would be particularly important.
We also performed spectral studies on each outburst and on the average broadband spectrum. For the first time we applied physical models based on thermal and bulk Comptonization processes to describe the hard X-ray emission of IGR J184830311. We obtained a good fit when modelling the X-ray emission with an absorbed COMPMAG model. We also obtained acceptable fits with the phenomenological models of a cutoff power-law or a power-law with high-energy cutoff. The relatively high values of , , and obtained from these fits suggest that the spectrum of IGR J184830311 is harder than the X-ray spectra of typical HMXBs. The spectral residuals of Figs. 4 and 5 show a positive trend above 80 keV that could indicate a hard excess. However, when we added a power-law with pegged normalization component to the absorbed COMPMAG spectral model, the F-test gave a % probability of a chance improvement of the , which is not significant at the 3 level (Sect. 4). More sensitive observations may be able to verify whether there is such an excess.
Acknowledgements.
We thank the anonymous referee for his/her useful and constructive comments, which helped to improve the paper. This paper is based on data from observations with INTEGRAL, XMM-Newton, and Swift. INTEGRAL is an ESA project with instruments and science data centre funded by ESA member states (especially the PI countries: Denmark, France, Germany, Italy, Spain, and Switzerland), Czech Republic and Poland, and with the participation of Russia and the USA. XMM-Newton is an ESA science mission with instruments and contributions directly funded by ESA Member States and NASA. This work made use of the results of the Swift/BAT hard X-ray transient monitor: http://swift.gsfc.nasa.gov/docs/swift/results/transients/ . This research is funded by the Deutsche Forschungsgemeinschaft through the Emmy Noether Research Grant SA 2131/1. L.D. thanks Vito Sguera for his helpful advice.References
- Becker & Wolff (2007) Becker, P. A. & Wolff, M. T. 2007, ApJ, 654, 435
- Blackburn (1995) Blackburn, J. K. 1995, in Astronomical Society of the Pacific Conference Series, Vol. 77, Astronomical Data Analysis Software and Systems IV, ed. R. A. Shaw, H. E. Payne, & J. J. E. Hayes, 367
- Bozzo et al. (2008) Bozzo, E., Falanga, M., & Stella, L. 2008, ApJ, 683, 1031
- Buccheri et al. (1983) Buccheri, R., Bennett, K., Bignami, G. F., et al. 1983, A&A, 128, 245
- Caballero et al. (2013) Caballero, I., Zurita Heras, J. A., Mattana, F., et al. 2013, ArXiv e-prints: 1304.1349
- Chaty et al. (2008) Chaty, S., Rahoui, F., Foellmi, C., et al. 2008, A&A, 484, 783
- Chernyakova et al. (2003) Chernyakova, M., Lutovinov, A., Capitanio, F., Lund, N., & Gehrels, N. 2003, The Astronomer’s Telegram, 157, 1
- Coburn et al. (2002) Coburn, W., Heindl, W. A., Rothschild, R. E., et al. 2002, ApJ, 580, 394
- Dall’Osso et al. (2003) Dall’Osso, S., Israel, G. L., Stella, L., Possenti, A., & Perozzi, E. 2003, ApJ, 599, 485
- de Jager et al. (1989) de Jager, O. C., Raubenheimer, B. C., & Swanepoel, J. W. H. 1989, A&A, 221, 180
- Di Cocco et al. (2003) Di Cocco, G., Caroli, E., Celesti, E., et al. 2003, A&A, 411, L189
- Doroshenko et al. (2012) Doroshenko, V., Santangelo, A., Kreykenbohm, I., & Doroshenko, R. 2012, A&A, 540, L1
- Ducci et al. (2009) Ducci, L., Sidoli, L., Mereghetti, S., Paizis, A., & Romano, P. 2009, MNRAS, 398, 2152
- Ducci et al. (2010) Ducci, L., Sidoli, L., & Paizis, A. 2010, MNRAS, 408, 1540
- Farinelli et al. (2012a) Farinelli, R., Ceccobello, C., Romano, P., & Titarchuk, L. 2012a, A&A, 538, A67
- Farinelli et al. (2012b) Farinelli, R., Romano, P., Mangano, V., et al. 2012b, MNRAS, 424, 2854
- Giunta et al. (2009) Giunta, A., Bozzo, E., Bernardini, F., et al. 2009, MNRAS, 399, 744
- Goldwurm et al. (2003) Goldwurm, A., David, P., Foschini, L., et al. 2003, A&A, 411, L223
- Grebenev (2009) Grebenev, S. 2009, in The Extreme Sky: Sampling the Universe above 10 keV
- Grebenev & Sunyaev (2007) Grebenev, S. A. & Sunyaev, R. A. 2007, Astronomy Letters, 33, 149
- Hobbs et al. (2006) Hobbs, G. B., Edwards, R. T., & Manchester, R. N. 2006, MNRAS, 369, 655
- Horne & Baliunas (1986) Horne, J. H. & Baliunas, S. L. 1986, ApJ, 302, 757
- in’t Zand et al. (2004) in’t Zand, J., Heise, J., Ubertini, P., Bazzano, A., & Markwardt, C. 2004, in ESA Special Publication, Vol. 552, 5th INTEGRAL Workshop on the INTEGRAL Universe, ed. V. Schoenfelder, G. Lichti, & C. Winkler, 427
- in’t Zand (2005) in’t Zand, J. J. M. 2005, A&A, 441, L1
- Kalberla et al. (2005) Kalberla, P. M. W., Burton, W. B., Hartmann, D., et al. 2005, A&A, 440, 775
- Krimm et al. (2006) Krimm, H. A., Barthelmy, S. D., Markwardt, C. B., et al. 2006, in BAAS, Vol. 38, BAAS, 374
- Krimm et al. (2013) Krimm, H. A., Holland, S. T., Corbet, R. H. D., et al. 2013, ArXiv e-prints: 1309.0755
- Lamb et al. (1977) Lamb, F. K., Fabian, A. C., Pringle, J. E., & Lamb, D. Q. 1977, ApJ, 217, 197
- Lebrun et al. (2003) Lebrun, F., Leray, J. P., Lavocat, P., et al. 2003, A&A, 411, L141
- Levine et al. (2011) Levine, A. M., Bradt, H. V., Chakrabarty, D., Corbet, R. H. D., & Harris, R. J. 2011, ApJS, 196, 6
- Levine & Corbet (2006) Levine, A. M. & Corbet, R. 2006, The Astronomer’s Telegram, 940, 1
- Lomb (1976) Lomb, N. R. 1976, Ap&SS, 39, 447
- Lund et al. (2003) Lund, N., Budtz-Jørgensen, C., Westergaard, N. J., et al. 2003, A&A, 411, L231
- Molkov et al. (2003) Molkov, S., Lutovinov, A., & Grebenev, S. 2003, A&A, 411, L357
- Molkov et al. (2004) Molkov, S. V., Cherepashchuk, A. M., Lutovinov, A. A., et al. 2004, Astronomy Letters, 30, 534
- Monet et al. (2003) Monet, D. G., Levine, S. E., Canzian, B., et al. 2003, AJ, 125, 984
- Negueruela et al. (2006) Negueruela, I., Smith, D. M., Reig, P., Chaty, S., & Torrejón, J. M. 2006, in ESA Special Publication, Vol. 604, The X-ray Universe 2005, ed. A. Wilson, 165
- Negueruela et al. (2008) Negueruela, I., Torrejón, J. M., Reig, P., Ribó, M., & Smith, D. M. 2008, in American Institute of Physics Conference Series, Vol. 1010, A Population Explosion: The Nature & Evolution of X-ray Binaries in Diverse Environments, ed. R. M. Bandyopadhyay, S. Wachter, D. Gelino, & C. R. Gelino, 252–256
- Pandey et al. (2006) Pandey, M., Manchanda, R. K., Rao, A. P., Durouchoux, P., & Ishwara-Chandra. 2006, A&A, 446, 471
- Press & Rybicki (1989) Press, W. H. & Rybicki, G. B. 1989, ApJ, 338, 277
- Rahoui & Chaty (2008) Rahoui, F. & Chaty, S. 2008, A&A, 492, 163
- Romano et al. (2010) Romano, P., Sidoli, L., Ducci, L., et al. 2010, MNRAS, 401, 1564
- Romano et al. (2007) Romano, P., Sidoli, L., Mangano, V., Mereghetti, S., & Cusumano, G. 2007, A&A, 469, L5
- Scargle (1982) Scargle, J. D. 1982, ApJ, 263, 835
- Sguera et al. (2005) Sguera, V., Barlow, E. J., Bird, A. J., et al. 2005, A&A, 444, 221
- Sguera et al. (2007) Sguera, V., Hill, A. B., Bird, A. J., et al. 2007, A&A, 467, 249
- Sidoli (2013) Sidoli, L. 2013, ArXiv e-prints: 1301.7574
- Sidoli et al. (2009) Sidoli, L., Romano, P., Mangano, V., et al. 2009, ApJ, 690, 120
- Sidoli et al. (2008) Sidoli, L., Romano, P., Mangano, V., et al. 2008, ApJ, 687, 1230
- Sidoli et al. (2007) Sidoli, L., Romano, P., Mereghetti, S., et al. 2007, A&A, 476, 1307
- Skrutskie et al. (2006) Skrutskie, M. F., Cutri, R. M., Stiening, R., et al. 2006, AJ, 131, 1163
- Smith et al. (2004) Smith, D. M., Negueruela, I., Heindl, W. A., Markwardt, C. B., & Swank, J. H. 2004, in Bulletin of the American Astronomical Society, Vol. 36, AAS/High Energy Astrophysics Division #8, 954
- Stephen et al. (2006) Stephen, J. B., Bassani, L., Malizia, A., et al. 2006, A&A, 445, 869
- Titarchuk (1994) Titarchuk, L. 1994, ApJ, 434, 570
- Tomsick et al. (2009) Tomsick, J. A., Chaty, S., Rodriguez, J., Walter, R., & Kaaret, P. 2009, ApJ, 701, 811
- Torrejón et al. (2010) Torrejón, J. M., Negueruela, I., Smith, D. M., & Harrison, T. E. 2010, A&A, 510, A61
- Ubertini et al. (2003) Ubertini, P., Lebrun, F., Di Cocco, G., et al. 2003, A&A, 411, L131
- Vedrenne et al. (2003) Vedrenne, G., Roques, J.-P., Schönfelder, V., et al. 2003, A&A, 411, L63
- Walter & Zurita Heras (2007) Walter, R. & Zurita Heras, J. 2007, A&A, 476, 335
- White et al. (1983) White, N. E., Swank, J. H., & Holt, S. S. 1983, ApJ, 270, 711
- Winkler et al. (2003) Winkler, C., Courvoisier, T. J.-L., Di Cocco, G., et al. 2003, A&A, 411, L1