SQUID-based multichannel system for Magnetoencephalography
Abstract
Here we present a multichannel system based on superconducting quantum interference devices (SQUIDs) for magnetoencephalography (MEG) measurements, developed and installed at Istituto di Cibernetica (ICIB) in Naples. This MEG system, consists of 163 full integrated SQUID magnetometers, 154 channels and 9 references, and has been designed to meet specifications concerning noise, dynamic range, slew rate and linearity through optimized design. The control electronics is located at room temperature and all the operations are performed inside a Magnetically Shielded Room (MSR). The system exhibits a magnetic white noise level of approximatively 5 fT/Hz1/2. This MEG system will be employed for both clinical and routine use.
pacs:
74.81.Fa, 85.25.Hv, 07.20.Mc, 85.25.Dq, 87.19.le, 87.85.NgSQUIDs, Magnetoencephalography (MEG), superconductivity
1 Introduction
Magnetoencephalography (MEG) is a non-invasive functional imaging
technique that measures the magnetic fields generated by neuronal
activity of the brain using Superconducting Quantum Inference
Devices (SQUIDs). Among the available brain imaging methods, MEG
uniquely features both a good spatial and an excellent temporal
resolution, thus allowing the investigation of key questions in
neuroscience and neurophysiology
[1], [2], [3], [4], [5].
MEG measurements reflect intracellular electric current flow in the
brain and so they provide direct information about the dynamics of
evoked and spontaneous neural activity. Unlike electroencephalogram
(EEG), MEG is not subject to interferences due to the tissues and
fluids lying
between the cortex and the scalp [6], [7].
As magnetic fields are not distorted by the different
conduction of the skull, MEG is an excellent localization tool for
subcortical sources of brain activity. It is worth noting that
measured magnetic fields are due exclusively to electric current
components tangential to the skull surface. Therefore the measured
signals are generated mainly in the cerebral sulci and there are only
minimal contributions due to neurons that present a different orientation.
MEG is a useful tool to investigate both
spontaneous and evoked activities. MEG can be employed to investigate
the dynamic neuronal processes as
well as to study cognitive processes such as language
perception, memory encoding and retrieval and higher level tasks.
Moreover concerning clinical
applications, it has been proved that MEG is a useful diagnostic
tool in the identification, prevention and treatment of numerous
disease and illnesses as it allows to study various cerebral
functions. So MEG has different applications, as for example
stroke, epileptic spike localization, presurgical functional
mapping, and Alzheimer disease.
2 Multichannel system
Multichannel MEG systems take advantage of improvements in SQUID
technology, such as reproducibility, compact readout electronics,
and coil configuration. The MEG system described in this paper has
been developed at Istituto di Cibernetica in Naples in cooperation
with the Advanced Technologies Biomagnetics (AtB) and it is located
in our laboratory inside a clinic.
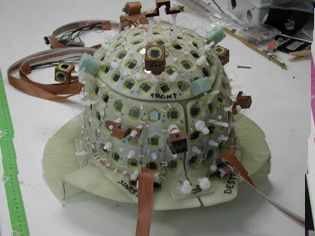
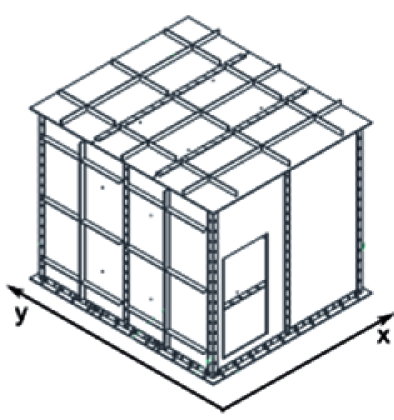
This MEG consists of 163 full
integrated SQUID magnetometers. A helmet shaped array hosts 154
magnetometer SQUIDs, located in a suitable way to cover the whole
head of the subject, and 3 vector magnetometers (consisting of 9
SQUIDs), located 6 cm above the helmet, and used as references
(Fig.2). The reference magnetometers are perfectly
orthogonal and oriented along the coordinate axes.
2.1 SQUIDs
SQUID magnetometers are very sensitive low frequency magnetic field
sensors and present a spectral density of magnetic noise of a few
fT/Hz1/2 [8], [9]. Due to their
excellent performances, SQUID sensors are widely employed in several
applications ranging from biomagnetism, to magnetic microscopy, quantum computing, non
destructive evaluation test and geophysics [9]. For
the MEG system described here SQUID sensors have been realized using
a standard trilayer technology, that ensures good performances
during time and a good signal to noise ratio, even at low
frequencies. Each SQUID magnetometer includes an integrated
superconducting flux transformer working as a magnetic flux pickup,
to increase the magnetic field sensitivity [10].
The design of the sensor is based on a Ketchen-type magnetometer
[11]. The SQUID loop is a square planar washer with an
inductance of 260 pH, coupled to a 12-turn thin film input coil with
33 nH inductance connected in series with a square single turn
pickup coil of 64 mm2 area presenting an inductance of 27 nH. The
Additional Positive Feedback (APF) [12] circuit and the
feedback coil for Flux-Locked-Loop (FLL) operation [13] are
fully integrated on chip to avoid any additional noise due to an
external APF circuit. In order to obtain a high effective
flux-capture area of 3 mm2, corresponding to a flux-field
conversion factor of 0.7 nT/, the mutual inductance between
the input coil and the SQUID has been
increased by a much higher SQUID inductance [14].
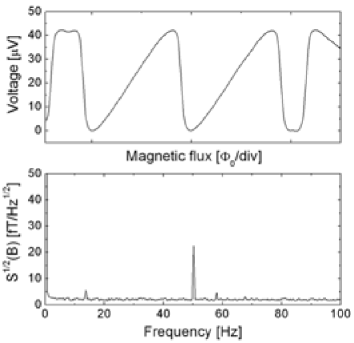
In
Fig.3 we report an experimental measurement of
the voltage as a function of the magnetic flux (V-) for a
SQUID magnetometer and magnetic flux noise spectral density measured
at K.
2.2 Dewar
For proper operation SQUIDs have to work at a temperature of 4.2 K,
reached immersing them in liquid helium. The dewar enclosing the
SQUIDs is an important component and must satisfy severe
requirements [3].
In our system the dewar has been realized in fibreglass as this
material shows both excellent magnetic properties and optimal
thickness. This choice has allowed to minimize the distance between
head and SQUIDs, so that the sensors are located only 2 cm
away from the scalp. Furthermore, to reduce the radiation losses,
several layers of mylar have been enclosed inside the inner portion
of the dewar.
The dewar has a capacity of 74 liters and a helium refill
interval of 7 days, thanks also to a mold realized in foam that
minimizes the heat transfer, as described in section 4.
2.3 Technical equipment
The readout electronics is placed at room temperature and is based
on the FLL configuration [13] with direct coupling to the
preamplifier and an APF circuit [12]. The contribution of
electronic noise due to preamplifier has been limited by increasing
the gain of the SQUIDs [12], [15]. Each SQUID is
connected to the room temperature electronics through four shielded
wires. Furthermore a suitable feedback coil integrated on the the
SQUID magnetometer chip, prevents the cross-talk phenomenon between
adjacent channels and allows the integration of a large number of
channels [16]. In this configuration the SQUIDs are
directly coupled to the amplifiers at room temperature and work in
optimal conditions.
Continuous data can be acquired simultaneously from
all channels in the bandwidth DC-400
Hz. The measured signals are then A/D converted at a sampling
frequency of 8.2 kHz and sent to a group of digital signal
processors (DSP). The DSP group is controlled through the console
and is used to apply digital filters. Furthermore it guarantees that
all SQUID channels are sampled simultaneously at 1.025 kHz with
22-bit ADCs (Analog to Digital Converter). SQUIDs’ parameters can be
changed through the acquisition console by the operator.
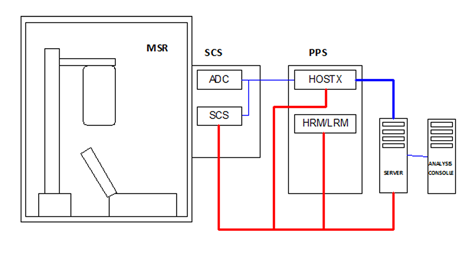
A block
diagram of our MEG system is shown in Fig.4. SCS is the
Sensor Controller System, while the PPS is the Pre Processing
System, HRM and LRM are respectively the High Resolution Monitor and
the Low Resolution Monitor, HOSTX indicates computers that contain
DSP cards.
Using filters
ensures that the digital signal processing is the same for each
channel, so that there are no delays between different channels and
that there are no jitters.
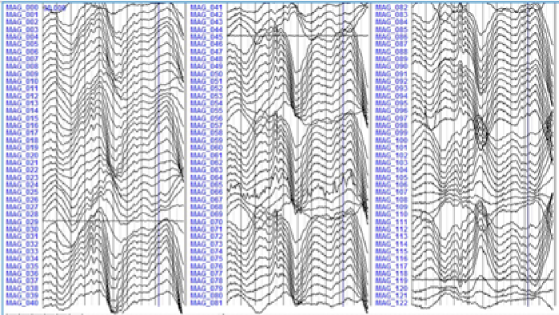
In Fig.5 a
preliminary measurement of the spontaneous activity
recorded by the MEG system on a healthy voluntary subject is shown.
2.4 EEG system
The MEG system is also equipped with a 32 integrated non-magnetic
EEG-channels cap, with ultra-thin wires and low profile of
electrodes, that is optimal for usage inside a MEG helmet
[17], [18] and sintered Ag/AgCl electrodes guarantee an
optimal EEG signal quality and do not need for re-chloriding.
Data are transmitted at 24-bit resolution via optical cable to
USB. This system allows to digital store the data and analyze them
by using both commercial and open source programs.
There is also the possibility to record EOG and ECG using additional electrodes. Scalp EEG can be inspected visually in real time.
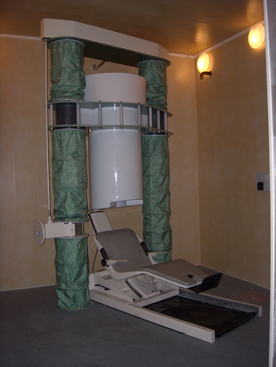
3 MSR
Since the magnetic signals emitted by the brain are about eight-nine
orders of magnitude smaller than the magnetic disturbances arising
from earth magnetic field and urban noise, it is necessary to shield
from external magnetic signals. The most straightforward noise
reduction method is to place the MEG system within a Magnetically
Shielded Room (MSR), that allows to physically reduce the
environmental noise.
A block diagram of the MEG system is illustrated in
Fig.4 while a sketch of our system is reported in
Fig.6.
The MSR has been realized in aluminium and -metal to reduce
respectively high-frequency and low-frequency noise. Our MSR
consists of three nested main layers: a pure aluminum layer (1.5 cm)
and two -metal layers (1.5 mm). Magnetic continuity is
maintained by overlay strips. The external dimensions of our MRS are
m3 (l w h), and the
inner dimensions are m3. All the
electric connections have been designed to not introduce any
magnetic noise. The floor is independently suspended.
The low noise dewar and the MRS have allowed us to obtain a white noise level of a white noise spectrum of approximately 5 fT/Hz1/2 that is good if compared to the average intrinsic noise of SQUIDs realized at ICIB-CNR, that is around 2 fT/Hz1/2 (Fig.3).
3.1 MSR attenuation
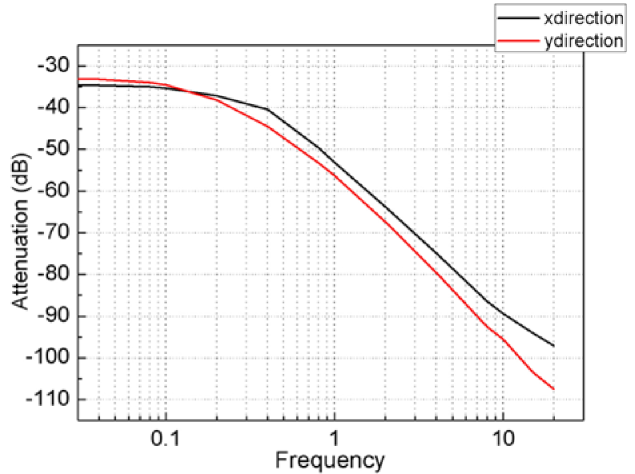
Here we report the measurements
made to characterize the performance of the shielded chamber. We
have measured the response of MSR to an external applied field
produced by a pair of coils for the x and y
component, in the frequency
range 0.01 Hz-20 Hz (Fig.7).
Passive shielding factors of 17266 and 2200 at 0,1 Hz and 1 Hz
respectively have been reported. Results are summarized in Table
1.
We have observed that when a triangular waveform is injected inside
the coils, the output of SQUIDs is a sinusoidal waveform. This
behaviour is explained considering that MSR filters high frequency
components. It has been observed also that the attenuation in the
y direction is slightly lower than in x
direction, probably due to the presence of the door.
| Frequency | Amplitude | Attenuation x | Attenuation y |
|---|---|---|---|
| (Hz) | (pT) | (dB) | (dB) |
| 0,01 | 18700 | -34,56 | -32,80 |
| 0,02 | 18900 | -34,47 | -32,99 |
| 0,04 | 18533 | -34,64 | -33,17 |
| 0,08 | 17900 | -34,94 | -33,96 |
| 0,1 | 17266 | -35,26 | -34,56 |
| 0,2 | 14000 | -37,08 | -38,20 |
| 0,4 | 9500 | -40,45 | -44,46 |
| 0,8 | 3300 | -49,63 | -53,19 |
| 1 | 2200 | -53,15 | -56,29 |
| 2 | 650 | -63,74 | -67,34 |
| 4 | 180 | -74,89 | -79,48 |
| 8 | 48 | -86,38 | -92,55 |
| 10 | 34 | -89,37 | -95,47 |
| 15 | 20 | -93,98 | -103,43 |
| 20 | 14 | -97,08 | -107,51 |
4 System thermogram
We have used a thermal imaging camera to detect radiation in the infrared range of the electromagnetic spectrum and produce thermal images (thermograms) of the MEG system. In fact, as infrared radiation is emitted by all objects above absolute zero according to the black body radiation law, thermography allows to see and to measure variations in temperature [19], [20].
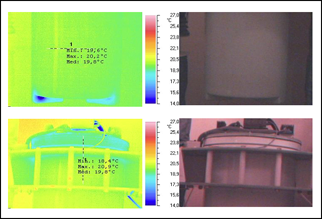
From the thermograms shown in Fig.8 it is evident that
this system has an excellent thermal resistance. Major variations are
observed on the joints and in the proximity of the helmet, due to
the reduced thickness of the dewar at those points. It is worth noting
that the temperature variations are within 1∘C.
As a consequence
of these measures a mold in foam has been realized. When the system
is not performing measurements, it is placed inside the dewar, where
usually the head of the subject is placed, it allows to minimize the
thermal swapping.
5 Spectral And Seismic Noise Analysis
We have studied the Power Spectral Density (PSD) in the MEG
laboratory environment by the means of seismic noise analysis
techniques [21].
Seismic instrumentation has been used to measure the effective
motion inside the MEG laboratory. In fact before installing a MEG
system is also necessary to perform a careful analysis of seismic
noise as large mechanical vibrations can induce a low-frequency
noise that affect the proper functioning of the SQUIDs.
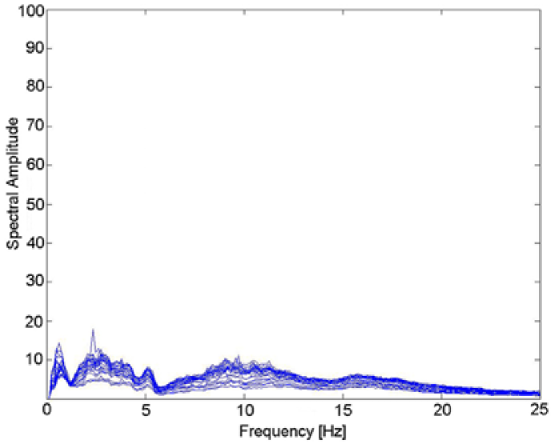
Data were collected along 4 days, including a week-end, to study the noise in different conditions [21]. Data analysis has shown that noise inside the MEG laboratory is present especially at really low frequencies, as shown in Fig.9. We plan to introduce antivibration pads below the MSR to avoid undesired mechanical oscillations and to use noise reduction techniques, as for example active compensation and off-line software methods.
6 Conclusion
We showed main characteristics, the technical equipment and the
performance of our MEG system, consisting of 163 full integrated
SQUIDs developed at Istituto di Cibernetica and located in a
clinical environment.
The presented MEG system presents good characteristics for clinical and routine
use. The noise floor is about 5 fT/Hz1/2 and sensor performances are stable during operation. This guarantees that high-quality MEG recordings are possible with this system.
Acknowledgment
This work was partially supported by Italian MiUR under the Project
”Sviluppo di componentistica superconduttrice avanzata e sua
applicazione a strumentazione biomedica” (L. 488/92, Cluster 14 -
Componentistica Avanzata).
References
References
- [1] A I Ahonen, M. S. Hamaliainen, M. J. Kajola, J. E. T. Knuutila, O. V. Lounasmaa, J. T. Simola, C. D. Tesche, and V. A. Vilkman. IEEE Trans. Magn., MAG-27:2793, 1991.
- [2] R T Johnson, W C Black, and D S Buchanan. Biomag 96: Proceedings of the Tenth International Conference on Biomagnetism. Springer, 1996.
- [3] Matti Hamalainen, Riitta Hari, Risto J Ilmoniemi, Jukka Knuutila, and Olli V Lounasma. Magnetoencephalography theory, instrumentation, and applications to noninvasive studies of the working human brain. Rev. Mod. Phys., 65:413–497, 1993.
- [4] J Vrba, K Betts, M Burbank, T Cheung, G Haid A A Fife, and P R Kubik et al. IEEE Trans. Appl. Superconductivity, 3:1878, 1993.
- [5] P C Hansen, M L Kringelbach, and R salmelin, editors. MEG an introduction to methods. Oxford, 2010.
- [6] D Cohen and BN Cuffin. Demonstration of useful differences between the magnetoencephalogram and electroencephalogram. Electroencephalogr Clin Neurophysiol, 56:38–51, 1983.
- [7] DF Rose and E Ducla Soares. Comparison of electroencephalography and magnetoencephalography. Adv Neurol, 54:33–37, 1990.
- [8] The squid handbook: Fundamentals and technology of squids and squid systems. Wiley-VCH Weinheim GmbH and Co, 2004.
- [9] The squid handbook: Fundamentals and technology of squids and squid systems. Wiley-VCH Weinheim GmbH and Co, 2006.
- [10] C Del Gratta, V Pizzella, F Tecchio, and GL Romani. Rep. Prog. Phys., 64:1759, 2001.
- [11] MB Ketchen and JM Jaycox. Appl. Phys. Lett., 40:736, 1982.
- [12] D Drung. Advanced squid read-out electronics, in squid sensors: fundamentals, fabrication and application. pages 63–116. Dordrecht: Kluwer Academic Publisher, 1996.
- [13] John Clarke. Squid fundamentals, in squid sensors: fundamentals, fabrication and application,. pages 1–62. Dordrecht: Kluwer Academic Publisher, 1996.
- [14] R Cantor. dc-squid: design, optimization and pratical application, in squid sensors: Fundamentals, fabrication and applications, nato advanced studies institute, series e: Applied science. pages 179–233. Kluwer, Dordrecht, 1996.
- [15] C Granata, A Vettoliere, and M Russo. Appl Phys Lett., 88:212506, 2006.
- [16] C Granata, A Vettoliere, M Luiso, and M Russo. Integrated squid sensors for low cross-talk multichannel system. Journal of Physics: Conference Series 43 (2006) 1235 1238.
- [17] L. Koessler, L. Maillard, A. Benhadid, J. P. Vignal, M. Braun, and H. Vespignani. Proc. Natl. Acad. Sci. USA, 37(2):97–102, 2007.
- [18] M Gratkowski, J Haueisen, L Arendt-Nielsen, AC Chen, and F Zanow. J Physiol Paris, 99(1):47–57, 2006.
- [19] XPV Maldague, TS Jones, H Kaplan, S Marinetti, and M Prystay. Nondestructive Handbook: Infrared and Thermal Testing. ASNT Press, 2001.
- [20] M Rippa, L Petti, and P Mormile. Measurement Science and Technology, 20(9):095706, 2009.
- [21] P. Cusano, S. Petrosino, A. Bobbio, F. Bianco, G. Festa, and A. Zollo. Analisi del rumore sismico di fondo all interno della cappella della clinica hermitage. Technical report, Istituto Nazionale di Geofisica e Vulcanologia, sezione Osservatorio Vesuviano, Napoli and Universita’ degli Studi di Napoli.