Techniques for Profile Binning and Analysis of Eigenvector Composite Spectra: Comparing H and Mgii2800 as Virial Estimators 111Invited talk presented on May 12, 2013 at the 9th SCSLSA held in Banja Koviliača, Serbia.
Abstract
We review the basic techniques for extracting information about quasar structure and kinematics from the broad emission lines in quasars. We consider which lines can most effectively serve as virial estimators of black hole mass. At low redshift the Balmer lines,particularly broad H, are the lines of choice. For redshifts greater than 0.7 – 0.8 one can follow H into the IR windows or find an H surrogate. We explain why UV Civ1549 is not a safe virial estimator and how Mgii2800 serves as the best virial surrogate for H up to the highest redshift quasar known at . We show how spectral binning in a parameter space context (4DE1) makes possible a more effective comparison of H and Mgii. It also helps to derive more accurate mass estimates from appropriately binned spectra and, finally, to map the dispersion in and Eddington ratio across the quasar population. FWHM MgII is about 20 smaller than FWHM H in the majority of type 1 AGN requiring correction when comparing estimates from these two lines. The 20 of sources showing narrowest FWHM H ( km s-1) and strongest FeII () emission (we call them bin A3-4 sources) do not show this FWHM difference and a blueshift detected in MgII for these sources suggests that FWHM H is the safer virial estimator for these extreme Eddington emitters.
keywords:
line:formation; line: profile; quasars: emission lines; quasars: general1 Introduction
Quasars were discovered in 1963 as radio-loud blue-stellar sources showing very broad emission lines in their high redshifted spectra. Fifty years later we know that most quasars are radio-quiet and show a wide diversity of spectroscopic properties united under the umbrella of Active Galactic Nuclei (AGN). The large population of AGN showing broad emission lines can be viewed as a luminous high-accreting parent population extending from local Seyfert galaxies like NGC1068 to the quasar with highest known redshift at 7.03. Spectroscopy is the fundamental method we employ to “resolve” the central structure of line emitting gas (broad line region: BLR; see the review by Gaskell 2010) surrounding the supermassive black hole thought to lie at the center of each AGN. We study the broad emission lines to infer BLR structure and kinematics. More recently we have begun using the width of select broad lines to estimate the mass of the black hole and which also gives us an estimate of the source Eddington ratio.
Broad emission lines characterise an important and dominant spectroscopic class of high accreting active galactic nuclei (AGN). Most are accreting at a high enough rate to fuel a reasonably stable broad line emitting region (BLR). The (likely) lowest accreting sources among them e.g. NGC 1097 (Storchi-Bergmann et al., 1993) and NGC 4151 (Bon et al., 2012) are less stable and show broad lines only part of the time. Some are obscured (by a torus?) and show broad lines only in polarized light e.g. NGC 1068 (Antonucci and Miller, 1985). At low redshift, where a host galaxy can be seen, they are called Seyfert 1 galaxies and at higher redshift, where they are largely unresolved point sources, we call them Type 1 quasars. Seyferts 1’s were long ago identified by Carl Seyfert (Seyfert, 1943) while discovery of the quasars occured fifty years ago (Schmidt, 1963). Broad lines alone cannot define the AGN phenomenon because many subtypes lacking them are now known (e.g. BL Lacs, Type 2 AGN and LINERs). Our focus in this paper will be exclusively on Type 1 AGN.
Whether hosted in a detectable galaxy or not, the region producing the broad emission lines is spatially unresolved. Such source compactness, and associated short variability timescales, are consistent with the hypothesis that the broad lines are produced in a region no larger than a fraction of a light year in diameter and connected with gas accreting onto a supermassive black hole (e.g. Gaskell and Sparke, 1986; Padovani and Rafanelli, 1988). Spectroscopy therefore is, and will likely remain, the means by which we “resolve” this broad line region (BLR). Broad line widths and shapes then provide the most direct clues about BLR geometry and kinematics.All broad lines in an individual source do not necessarily show the same properties and any specific line can as well show striking diversity in different quasars. The latter fact offers an immediate motivation for attempts to systematize measures of specific broad lines.
In addition to providing clues about BLR structure and kinematics, broad lines are now used increasingly to estimate the mass of the central black hole which measure is of great importance both for models of BLR structure and (potentially) for cosmology (see contribution by Marziani & Sulentic in this proceeding). Which lines can we use for black hole mass estimation and over what redshift range is a particular line useful? We seek lines that arise in a virialized medium which leads us to the Balmer lines at low redshift. H is the most useful Balmer line for such studies because it usually shows only small shifts and asymmetries – it thus appears to be a “safe” virial estimator for most Type 1 AGN. If it arises from a flattened distribution of emitting clouds or, even from a Keplerian accretion disk, as is often assumed, then the virial assumption is not unreasonable. H suffers from contamination by nearby lines of Feii, Heii4686 and (narrow) [Oiii]4959,5007 but these can be reasonably modeled and subtracted to facilitate evaluation of line properties. H is lost to optical spectroscopy in the redshift range . It can be followed through the JHK infrared windows out to using suitably large telescopes although this approach is still rather costly in terms of telescope time. Estimates of black hole masses for large high redshift samples require an H surrogate. Two lines, Civ1549 and Mgii2800 (e.g., McLure & Jarvis, 2002), are the best candidates in terms of line strength and low levels of contamination.
High ionization Civ1549 is so dangerous that many prefer to avoid it entirely (Sulentic et al., 2007; Netzer et al., 2007). Yes ironically, various studies suggest that it is virialized (Gaskell, 1988; Peterson and Wandel, 1999). CIV often shows profile blueshifts and asymmetries interpreted as signatures of winds or outflows (Gaskell, 1982; Gaskell and Goosmann, 2013). These Civ1549 distortions are often seen in quasars where H is most symmetric and well behaved. The problem with CIV is therefore not the issue of virialization but the likelyhood that the line emission arises highly anisotropically in a structure with unknown geometry. FWHM Civ1549 does not show a clear correlation with FWHM H the low virial estimator of choice and this precludes a simple geometric relation between Civ1549 and H as well as Mgii2800 emissions (Shen et al., 2008). Thus Civ1549 is falling from (actually it was never in) favor, and Mgii2800 is replacing it, as the preferred high redshift virial estimator. This paper compares H with Mgii2800 and presents evidence in support of the latter line as a virial estimator for 80-90% of high redshift quasars–all except the highest accretors. This paper, and the emergence of Mgii2800, are largely due to the advent of the SDSS which provides Mgii2800 spectra for thousands of quasars. Most importantly for 500+ sources where both H and Mgii2800 can be measured in the same spectra. Low ionization Mgii2800 is reasonably symmetric and unshifted like H making it the best candidate as a surrogate. Mgii2800 has even been measured (K band) in the quasar with highest current redshift ( 7.035; Mortlock et al. 2011).
2 Estimating Black Hole Mass
When estimating black hole mass one requires both a velocity dispersion and a radius of the BLR. If the virial assumption is valid then . is a parameter that accounts for line-of-sight effects on the line profile due to geometry and kinematics. It may impose the ultimate limitation on the accuracy of estimates. We do not know the correct value of and, more importantly, how much it changes across the quasar population. The value of (the effective BLR radius) can be directly estimated using reverberation techniques as it simply involves the delay time in the response of an emission line to continuum changes. Reverberation mapping is prohibitively expensive in terms of required telescope time meaning that only about 60 of the brightest nearby (and hence predominantly low luminosity) sources have been reverberation mapped. The reverberation radii tend to correlate with measures of source luminosity leading to a radius – luminosity relation (Dibai, 1977; Koratkar and Gaskell, 1991; Kaspi et al., 2005) (0.5) which can provide, via extrapolation, estimates for all sources where can be reliably measured. Note that we have only a vague notion of what means since the BLR is unlikely to be a shell surrounding the central continuum source (Negrete et al., 2013, and Alenka Negrete’s contribution in this proceedings).
Measures of (the virial velocity dispersion) come from direct measurement of a line that is considered a reliable virial estimator. If a given broad line is reasonably symmetric and unshifted we adopt FWHM H (or FWHM Mgii2800?) as the virial estimator. We do this because a symmetric line without inflections implies a reasonably coherent single source of line emission involving motions centered around the quasar rest frame (usually inferred from the redshift of narrow lines like [Oiii]4959,5007). This is the simplest expectation for a bound virialized emitting region. If the line profile shows inflections we do not know what to do because inflections imply spectroscopic resolution of the BLR. The spatially unresolved source could involve multiple kinematically distinct emitting components –a binary black hole comes to mind – if each black hole is surrounded by a BLR. This is perhaps less likely than such profile complexities indicating stratification of the emitting region and/or radial motions of all or part of the line emitting gas (winds, outflows or infall). Line profile inflections are a valuable clue telling us that multiple emitting components are present and that all or part of the line cannot be safely regarded as a virial estimator. The study of profile inflections is still in its infancy because they require high resolution (like SDSS) and high s/n ( like only a few hundred SDSS) spectra.
Three broad line components have been identified in H (Marziani et al., 2010) and presumably only one of them is/might be a virial estimator. The situation is not so bad because many sources show only a single component (50% of quasars in the case of H). Naturally for the other 50% we adopt the least shifted broad component for black hole mass estimation. The larger blueshifts and asymmetries observed in Civ1549 represent a more serious problem–in this case we are not even sure if any part of the line can be trusted. Another problem with Civ1549 involves the difficulty of subtracting a narrow line component which if uncorrected will cause underestimation of the black hole mass (Sulentic and Marziani, 1999; Sulentic et al., 2007). Civ1549 is not the road to more accurate black hole masses. Note that we do not want to use many different lines for virial mass estimation because this simply adds uncertainty when we compare them and try to tie them together over different redshift ranges. That is why it is likely that H and Mgii represent the best and safest set of virial estimators that can cover the full redshift range. In other words we do not need or want Civ1549 especially as a (more uncertain) third estimator.
3 FWHM H vs. as the Virial Estimator?
The second moment of the line profile (also called the line dispersion) has sometimes been favored over profile width as a more physical and/or reliable virial measure. The relative merits of the two measures as virial estimators were discussed in Collin et al. (2006). Both FWHM and are simply numbers (albeit one in units of line-of-sight velocity) and 1) if the line profile of the adopted virial estimator were similar from source-to-source and 2) if a uniform range of profile width was observed, then the two numbers should be fully equivalent (allowing only for the possibility that one might be measured more accurately than the other, Peterson et al. 2004) Unfortunately broad lines sometimes show inflections indicating 2 or 3 emitting components. Since they cannot all be virial estimators neither a FWHM nor measure for the full profile should be used. The line profile can at least be used to model the line components (Marziani et al., 2010) while is of no use and has no meaning. If one models the individual line components and isolates a FWHM measure for the component most likely to be a virial estimator then there seems little additional value in computing and using it instead of FWHM as the virial measure. Profile modeling is the road to more accurate black hole mass estimates in the future but it can only be applied if spectral S/N is high enough. A S/N20 computed in the continuum near, but not including, the adopted virial estimator is a useful rule of thumb.
In addition to broad line inflections there is often the well known inflection between broad and narrow line components. This is especially important when using H as the virial estimator. When the inflection is clear–especially for sources where broad H shows FWHM 3000 km s-1 – it can be used to guide subtraction of the narrow component. Black hole mass estimates from a broad line without correction for the narrow component will be underestimates. Again reasonable spectra S/N is desirable if one wishes to obtain an estimate with less than 1dex uncertainty.
4 Contextualization of Broad Line Properties: 4DE1
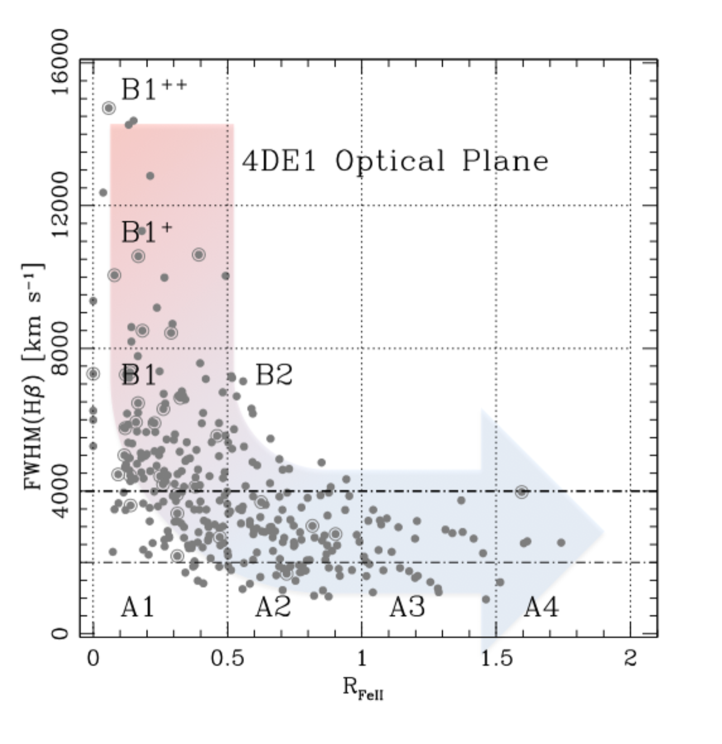
Fortunately narrow line and broad line inflections do not occur randomly but show trends. What we need is a context in which to interpret broad line spectra. The PCA analysis of high S/N PG spectra (Boroson and Green, 1992) opened the door to a new era of source contextualization. These results provided the first hints that all quasar spectra are not self similar and that indiscriminate averaging of quasar spectra (Vanden Berk et al., 2001) – no matter how tempting – is not the path to progress. We have built upon the PG results using larger samples of quasars and have proposed a 4D Eigenvector 1 (4DE1) parameter space (Sulentic et al., 2000a) involving correlations between: 1) FWHM H (the virial estimator of choice), 2) Feii4570/I(H), 3) soft X-ray photon index see also (Wang et al., 1996) and 4) velocity shift of the Civ1549 centroid at FWHM. Results so far are consistent with the assumption that source occupation in 4DE1 has a physical basis with source Eddington ratio as the principal driver (Marziani et al., 2001).
How can a context involving diagnostic measures help us derive more accurate black holes masses? Can it also help us to compare the relative merits of H and Mgii2800 as virial estimators? Figure 1 shows the optical plane of 4DE1 which plots source FWHM H vs. measures. It is shown here for a large magnitude limited sample of bright SDSS quasars (Zamfir et al., 2010) where a clear sequence of source occupation is observed. Sources with FWHM H4000 km s-1 (population A) usually show a symmetric unshifted H profile while sources with FWHM H4000 km s-1 (population B) require a double Gaussian model to describe the line. Pop A sources show Lorentz-like profiles so FWHM H derived from Gaussian fits to the line will result in overestimation of . Pop B sources fit with a single function and FWHM (or ) measured from the fit, will result in serious overestimation of . Pop. B includes the majority of radio-loud quasars so this overestimation often affects comparisons of for radio-quiet and radio-loud quasars. The double Gaussian required to fit Pop. B sources involve a broad relatively unshifted BLR component (BC) plus a very broad (FWHM10000km s-1) and redshifted (=1000 – 2000 km s-1) VBC component. We have no choice but to adopt the unshifted component as the virial estimator – but FWHM of this component is often broadened by the VBC if the profile is not modelled.
Most spectra lack high enough S/N to allow modelling or even recognition of the composite profiles for the almost half of quasars that show pop B characteristics. This is where the 4DE1 formalism can help. We know where the sources with simple and complex spectra are located in 4DE1 space. We can bin the optical plane of 4DE1 as shown in Figure 1 allowing us to generate median composite spectra for quasars in each bin. We thus avoid binning together dissimilar spectra which might be reflecting different BLR physics. The resultant composite spectra show much higher S/N facilitating modeling of line profiles and more accurate measures of black hole mass and Eddington ratio. We can map median and for sources across the 4DE1 optical plane. Binned median spectra also open the door to a more refined comparison between H and Mgii2800 as virial estimators.
5 Comparing H and Mgii2800 as Virial Estimators
H is well established as the virial estimator of choice at 0.7 – 0.9. There is no suitable low redshift alternative except for H which can only be used for sources below . Of course both can be followed into the IR, H can be used up to z=3.7. Suitably high S/N single spectra and luminosity binned composite spectra suggest that the effect of nonvirial components becomes more serious at high redshift (Sulentic et al., 2006). has likely been overestimated for a large fraction of high quasars. Such IR spectra are sufficiently costly in telescope time that they are not likely to provide measures for more than modest handfuls of sources (Marziani et al., 2009). Mgii2800 is a low ionization resonance doublet that might reasonably be expected to show similar propertied to H (Grandi & Phillips, 1979; Netzer, 1980) but with the added difficulty of narrow and broad-line absorption in an unknown fraction of sources – possibly more common in Pop. A quasars.
SDSS has opened the door to detailed statistical studies of Mgii2800 and to comparison with H (e.g., Trakhtenbrot and Netzer, 2012). We find 680 sources in SDSS DR8 with spectra that provided high resolution line profiles for both H and Mgii2800. They are observed in the redshift range from = 0.4 – 0.75. There are more sources in this redshift range but their spectra are too noisy to permit reliable 4DE1 spectral bin assignments. Bright sources in this redshift range cover a limited range of source luminosity. This means that median composite spectra that we compute for this bright quasar sample will reflect properties of sources within 1 dex of 46. This is not bad because it represents typical intermediate luminosity sources. The composites trace a supposedly stable profile that is shared by most sources. They are conceptually different from rms spectra computed for single sources in reverberation studies. Our assumption is that a large numbers of sources scatter around a well defined median/average in each 4DE1 bin. Using this procedure we are able to generate composite spectra for the 8 most occupied bins in the 4DE1 optical plane.
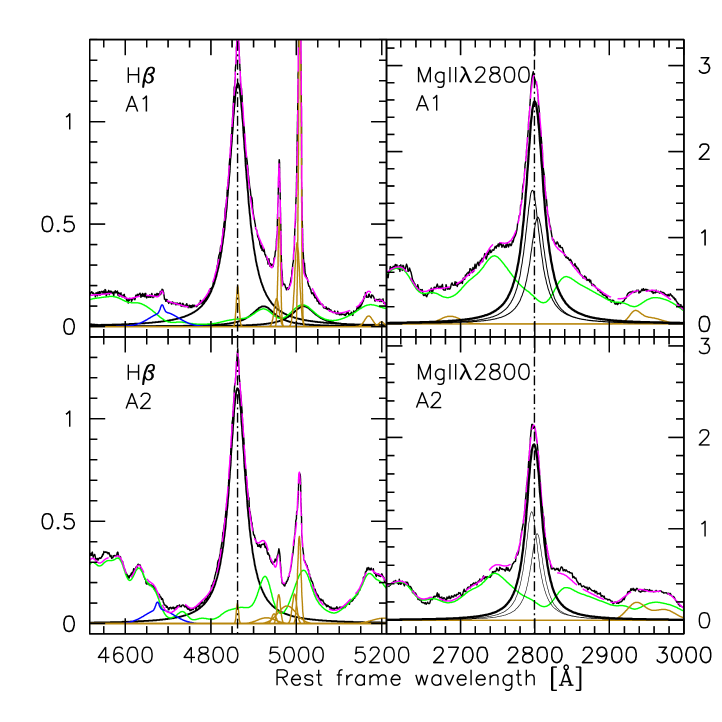
6 Comparison for Spectral Bins A1 and A2
Figure 2 shows median composite spectra for H and Mgii2800 in bins A1 and A2. A2 is the most populated bin in Population A (48% of the sample) with 50% of the Pop. A sample. The A bins are largely a sequence of increasing that subsumes the region formally defined for NLSy1 sources. Given the 1 Å resolution of SDSS spectra we are forced to model Mgii2800 as a 2793/2806 doublet of fixed ratio 1.25. The composites in Figure 2 show iraf specfit results superimposed including: 1) Feii modelling, 2) fits to narrow [Oiii]4959,5007 and H, 3) He4686 and 4) broad H. When we use iraf specfit we must specify what the program should look for or it will never find a reasonable solution with so many free parameter lines and components present. In this case we assume that both components of Mgii2800 are unshifted Lorentz profiles. This provides a good fit judging from the residuals shown at the bottom of the fits in Fig. 2. Gaussian models provide an inferior fit consistent with what we always find for H. The main result of this comparison indicates that FWHM Mgii2800 is 20% smaller than FWHM H meaning that Mgii2800 used as the virial estimator will yield systematically smaller black holes masses than H (in agreement with the BLR self-shielding model of Gaskell et al., 2007). In general if one employs Mgii2800 one must pay attention to the resolution of the spectra being measured relative to the separation of the Mgii2800 doublet. Otherwise one will overestimate and one will find less than a 20% FWHM difference relative to H (e.g. in bin A1 FWHM H=3180 while for Mgii2800 the full profile FWHM 3040 km s-1 while individual multiplets show FWHM Mgii2800 2710 km s-1). Note that in this comparison a black hole mass estimation also requires a value of which is obtained from extrapolation of the Kaspi relation. The luminosities used to derive will not be the same for the two lines. is derived from the continuum near each line: 3100 Å and 5100 Å for Mgii2800 and H respectively. Best estimate median log values for bins A1/A2 are 8.67/8.57 and 8.62/8.45 for H and Mgii2800 respectively (solar units). Best log Eddington ratio estimates for A1/A2 are -0.60/-0.53 and -0.56/-0.40 for H and Mgii2800 respectively. It is assumed that the smaller of the two FWHM values (e.g. FWHM Mgii2800 BC which is a single VBC corrected term of the doublet) is the best estimate with 0.5 dex uncertainty.
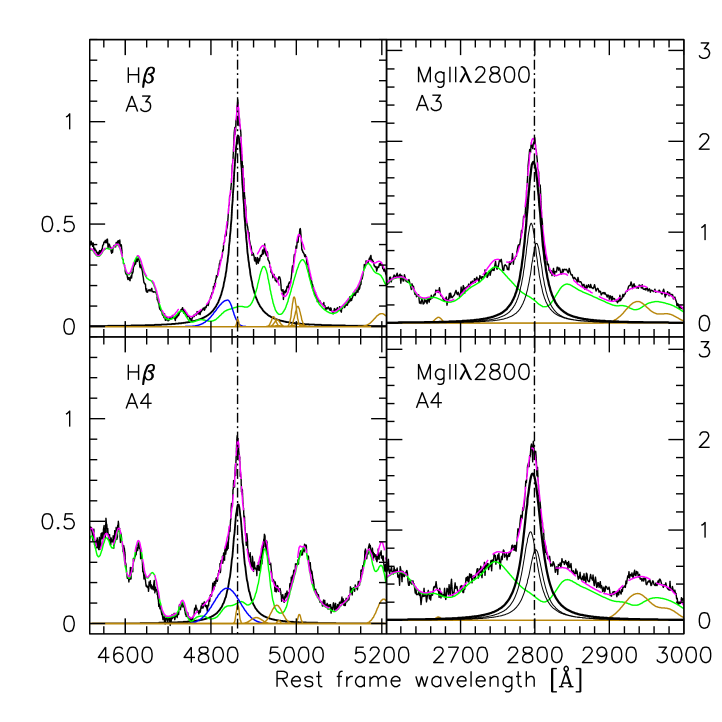
7 Comparison for spectral bins A3 and A4
Figure 3 shows composite spectra for bins A3 and A4 which involve 43 and 15 sources respectively. Results of best specfit models are superimposed with residuals displayed below. In many ways these bins represent the most extreme quasars in a low redshift sample. They show the strongest Feii emission (1.0), a Civ1549 blueshift/asymmetry with some shift amplitudes exceeding 1000km s-1 and a soft X-ray excess ( 2.7). The well known NLSy1 quasar I Zw 1 is found in bin A3. Computed values for these sources A3/A4 (8.33/8.27 and 8.41/8.56 for H and Mgii2800 respectively) coupled with source luminosities lead us to infer that these sources are radiating closest to the Eddington limit (A3/A4 –0.28/–0.18 and –0.37/–0.47 for H and Mgii2800 respectively). See Marziani et al. (2003, 2006) and communication in this proceeding for the cosmological potential of such sources. These sources show surprisingly large scatter in a FWHM Mgii2800 vs FWHM H plot and gave the impression that the difference between FWHM H and FWHM Mgii2800 was converging towards zero at low FWHM values (see e.g. Wang et al. 2009). In fact they show anomalous properties and are sources where Mgii2800 cannot be trusted as a virial estimator. We find that indeed FWHM Mgii2800 is equal too or even slightly greater than FWHM H – the only bins where this is observed. In additional the median Mgii2800 profiles for these two bins show a systematic blueshift that is largest in bin A4 (–265km s-1). The blueshift is attributed to a wind or outflow associated with the high values for these sources. The profile of H for these two bins also shows a small blueshifted component perhaps related to the same outflow process. Since it can be well modeled and does not affect H at the FWHM level we conclude that H can be trusted as a virial estimator.
8 Comparison for spectral B bins
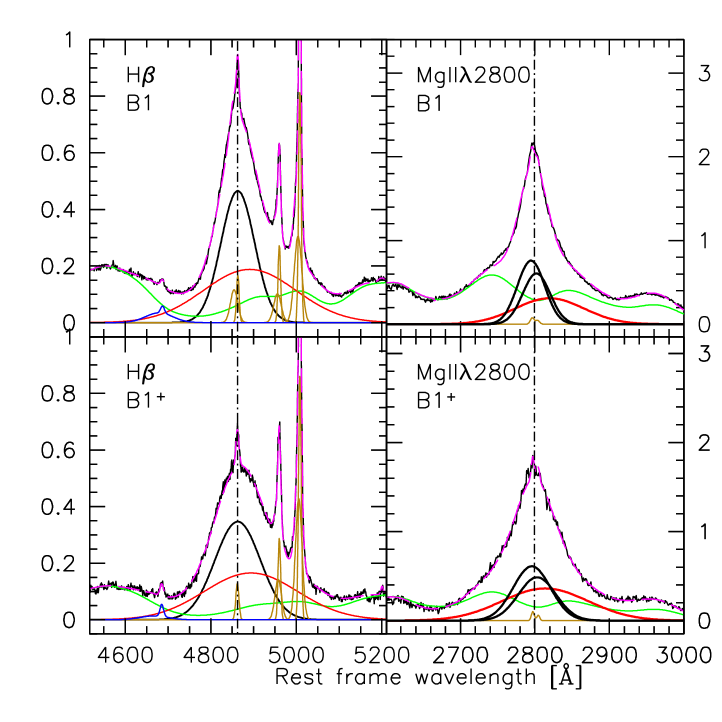
Figure 4 shows composite spectra for bins B1 and B1+ with associated specfits and residuals superposed and displayed below, respectively. Population B represents a series of bins (52% of our sample) with increasing FWHM H. They share a constant range of 0.5 except for bin B2 which shows a mean . Only results for Bins B1 and B1+ are shown. With 218 and 115 sources, respectively, they represent 90% of the population B sample. These sources require a double Gaussian (BC+VBC) fit to both H and Mgii2800. Given the large uncertainies about: 1) the widths of both components, 2) the BC/VBC intensity ratio and 3) the amplitude of the VBC redshift, these fits are the least well constrained. We know that the BC/VBC intensity ratio can show a wide range (Marziani et al., 2009). Some sources in fact show a ratio near to zero (e.g. PG1416-129, Sulentic et al. 2000b and 3C110 Marziani et al. 2010). While compiling our SDSS sample for the H – Mgii2800 comparison we found additional examples of what we call super VBC quasars. Figure 5 shows the H and Mgii2800 profiles for PG1201+436 which is clearly a case where the BC/VBC ratios for H and Mgii2800 profiles are very different. Bins B1 and B1+ show values B1/B1+ of 9.15/9.29 and 8.98/9.06 for H and Mgii2800 respectively. The estimated Eddington ratios are -1.13/-1.44 and -0.96/-1.21 for H and Mgii2800 respectively. Since the Mgii2800 VBC is weaker in the Mgii2800 composites we consider the and values for that line to be more reliable.

9 Conclusions
We are still struggling with (and consequently ) estimates largely with 1dex uncertainties. However we are laying the foundation for estimations with uncertainties of a few 0.1dex–especially bin-to-bin uncertainties which are almost as valuable as absolute ones. The path towards more accurate estimates lies within a context like 4DE1 where spectral binning can greatly increase S/N of the line measures. The latest bin results (for log 0.5 –a typical quasar luminosity) ) show a trend in the 4DE1 optical plane of decreasing from bins B1+/B1++ (9.1) to bin A4 (8.3). Resultant values increase from –1.5 to –0.2. The full range is likely 7.0 – 9.5 (with range from –2.0 to 0.0 in logarithm) but smaller bins and a larger range in source luminosity is needed to explore it. If grows with time via merging and accretion then the 4DE1 trend may also represent an evolutionary sequence with quasars in this sample middle-aged and the youngest sources in bins A3/A4 radiating at or near the Eddington limit.
Acknowledgements
Funding for the SDSS and SDSS-II has been provided by the Alfred P. Sloan Foundation, the Participating Institutions, the National Science Foundation, the U.S. Department of Energy, the National Aeronautics and Space Administration, the Japanese Monbukagakusho, the Max Planck Society, and the Higher Education Funding Council for England. The SDSS Web Site is http://www.sdss.org/.
The SDSS is managed by the Astrophysical Research Consortium for the Participating Institutions. The Participating Institutions are listed on the webpage http://www.sdss.org/collaboration/credits.html.
References
- Antonucci and Miller (1985) R.R.J. Antonucci, J.S. Miller, Spectropolarimetry and the nature of NGC 1068, Astroph. J. 297 (1985) 621–632.
- Bon et al. (2012) E. Bon, P. Jovanović, P. Marziani, A.I. Shapovalova, N. Bon, V. Borka Jovanović, D. Borka, J. Sulentic, L.Č. Popović, The First Spectroscopically Resolved Sub-parsec Orbit of a Supermassive Binary Black Hole, Astroph. J. 759 (2012) 118–126.
- Boroson and Green (1992) T.A. Boroson, R.F. Green, The emission-line properties of low-redshift quasi-stellar objects, ApJS 80 (1992) 109–135.
- Collin et al. (2006) S. Collin, T. Kawaguchi, B.M. Peterson, M. Vestergaard, Systematic effects in measurement of black hole masses by emission-line reverberation of active galactic nuclei: Eddington ratio and inclination, A&Ap 456 (2006) 75–90.
- Dibai (1977) E.A. Dibai, Mass of the central bodies of active galaxy nuclei, Soviet Astronomy Letters 3 (1977) 1–3.
- Gaskell (1982) C.M. Gaskell, A redshift difference between high and low ionization emission-line regions in QSOs - Evidence for radial motions, ApJ 263 (1982) 79–86.
- Gaskell (1988) C.M. Gaskell, Direct evidence for gravitational domination of the motion of gas within one light-week of the central object in NGC 4151 and the determination of the mass of the probable black hole, Astroph. J. 325 (1988) 114–118.
- Gaskell (2010) Gaskell, C. M., Close supermassive binary black holes. Nature 463 (2010), E1.
- Gaskell and Goosmann (2013) C.M. Gaskell, R.W. Goosmann, Line Shifts, Broad-line Region Inflow, and the Feeding of Active Galactic Nuclei, Astroph. J. 769 (2013) 30–40.
- Gaskell et al. (2007) C.M. Gaskell, E.S. Klimek, L.S. Nazarova, NGC 5548: The AGN Energy Budget Problem and the Geometry of the Broad-Line Region and Torus, ArXiv e-prints (2007).
- Gaskell and Sparke (1986) C.M. Gaskell, L.S. Sparke, Line variations in quasars and Seyfert galaxies, Astroph. J. 305 (1986) 175–186.
- Grandi & Phillips (1979) Grandi, S. A. & Phillips, M. M., Astroph. J., 232 (1979), 659–669.
- Kaspi et al. (2005) S. Kaspi, D. Maoz, H. Netzer, B.M. Peterson, M. Vestergaard, B.T. Jannuzi, The Relationship between Luminosity and Broad-Line Region Size in Active Galactic Nuclei, ApJ 629 (2005) 61–71.
- Koratkar and Gaskell (1991) A.P. Koratkar, C.M. Gaskell, Structure and kinematics of the broad-line regions in active galaxies from IUE variability data, Astroph. J. Suppl. 75 (1991) 719–750.
- Marziani et al. (2006) P. Marziani, D. Dultzin-Hacyan, J.W. Sulentic, Accretion onto Supermassive Black Holes in Quasars: Learning from Optical/UV Observations, Accretion onto Supermassive Black Holes in Quasars: Learning from Optical/UV Observations, in New Developments in Black Hole Research, New York: Nova Science, 2006, p. 123–183.
- Marziani et al. (2010) P. Marziani, J.W. Sulentic, C.A. Negrete, D. Dultzin, S. Zamfir, R. Bachev, Broad-line region physical conditions along the quasar eigenvector 1 sequence, Mon. Not. Royal Astr. Soc. 409 (2010) 1033–1048.
- Marziani et al. (2009) P. Marziani, J.W. Sulentic, G.M. Stirpe, S. Zamfir, M. Calvani, VLT/ISAAC spectra of the H region in intermediate-redshift quasars. III. H broad-line profile analysis and inferences about BLR structure, A&Ap 495 (2009) 83–112.
- Marziani et al. (2003) P. Marziani, J.W. Sulentic, R. Zamanov, M. Calvani, M. Della Valle, G. Stirpe, D. Dultzin-Hacyan, Using Quasars for Cosmology, Memorie della Societa Astronomica Italiana Supplement 3 (2003) 218–221.
- Marziani et al. (2001) P. Marziani, J.W. Sulentic, T. Zwitter, D. Dultzin-Hacyan, M. Calvani, Searching for the Physical Drivers of the Eigenvector 1 Correlation Space, ApJ 558 (2001) 553–560.
- McLure & Jarvis (2002) McLure, R. J. & Jarvis, M. J., Mon. Not. Royal Astr. Soc. 337 (2002), 109–116.
- Mortlock et al. (2011) D.J. Mortlock, S.J. Warren, B.P. Venemans, M. Patel, P.C. Hewett, R.G. McMahon, C. Simpson, T. Theuns, E.A. Gonzáles-Solares, A. Adamson, S. Dye, N.C. Hambly, P. Hirst, M.J. Irwin, E. Kuiper, A. Lawrence, H.J.A. Röttgering, A luminous quasar at a redshift of z = 7.085, Nature 474 (2011) 616–619.
- Negrete et al. (2013) C.A. Negrete, D. Dultzin, P. Marziani, J.w. Sulentic, Reverberation and photoionization estimates of the Broad Line Region Radius in Low-z Quasars, Astroph. J. 771 (2013) 31–48.
- Netzer (1980) Netzer, H., Astroph. J. 236 (1980), 406–418.
- Netzer et al. (2007) H. Netzer, P. Lira, B. Trakhtenbrot, O. Shemmer, I. Cury, Black Hole Mass and Growth Rate at High Redshift, Astroph. J. 671 (2007) 1256–1263.
- Padovani and Rafanelli (1988) P. Padovani, P. Rafanelli, Mass-luminosity relationships and accretion rates for Seyfert 1 galaxies and quasars, Astron. Astroph. 205 (1988) 53–70.
- Peterson et al. (2004) B.M. Peterson, L. Ferrarese, K.M. Gilbert, S. Kaspi, M.A. Malkan, D. Maoz, D. Merritt, H. Netzer, C.A. Onken, R.W. Pogge, M. Vestergaard, A. Wandel, Central Masses and Broad-Line Region Sizes of Active Galactic Nuclei. II. A Homogeneous Analysis of a Large Reverberation-Mapping Database, Astroph. J. 613 (2004) 682–699.
- Peterson and Wandel (1999) B.M. Peterson, A. Wandel, Keplerian Motion of Broad-Line Region Gas as Evidence for Supermassive Black Holes in Active Galactic Nuclei, Astroph. J. Lett. 521 (1999) L95–L98.
- Schmidt (1963) M. Schmidt, 3C 273 : A Star-Like Object with Large Red-Shift, Nature 197 (1963) 1040–1042.
- Seyfert (1943) C.K. Seyfert, Nuclear Emission in Spiral Nebulae., Astroph. J. 97 (1943) 28–40.
- Shen et al. (2008) Shen, Y., Greene, J. E., Strauss, M. A., Richards, G. T., & Schneider, D. P., Astroph. J. 680 (2008), 169–190.
- Storchi-Bergmann et al. (1993) T. Storchi-Bergmann, J.A. Baldwin, A.S. Wilson, Double-peaked broad line emission from the LINER nucleus of NGC 1097, Astroph. J. Lett. 410 (1993) L11–L14.
- Sulentic et al. (2007) J.W. Sulentic, R. Bachev, P. Marziani, C.A. Negrete, D. Dultzin, C IV 1549 as an Eigenvector 1 Parameter for Active Galactic Nuclei, ApJ 666 (2007) 757–777.
- Sulentic and Marziani (1999) J.W. Sulentic, P. Marziani, The Intermediate-Line Region in Active Galactic Nuclei: A Region “Præter Necessitatem”?, ApJL 518 (1999) L9–L12.
- Sulentic et al. (2000a) J.W. Sulentic, P. Marziani, D. Dultzin-Hacyan, Phenomenology of Broad Emission Lines in Active Galactic Nuclei, ARA&A 38 (2000a) 521–571.
- Sulentic et al. (2000b) J.W. Sulentic, P. Marziani, T. Zwitter, D. Dultzin-Hacyan, M. Calvani, The Demise of the Classical Broad-Line Region in the Luminous Quasar PG 1416-129, ApJL 545 (2000b) L15–L18.
- Sulentic et al. (2006) J.W. Sulentic, P. Repetto, G.M. Stirpe, P. Marziani, D. Dultzin-Hacyan, M. Calvani, VLT/ISAAC spectra of the H region in intermediate-redshift quasars. II. Black hole mass and Eddington ratio, A&Ap 456 (2006) 929–939.
- Trakhtenbrot and Netzer (2012) Trakhtenbrot, B., Netzer, H. 2012. Black hole growth to z = 2 - I. Improved virial methods for measuring MBH and L/LEdd. Monthly Notices of the Royal Astronomical Society 427, 3081-3102.
- Vanden Berk et al. (2001) Vanden Berk, D. E., and 61 colleagues 2001. Composite Quasar Spectra from the Sloan Digital Sky Survey. Astrono. J. 122, 549-564.
- Wang et al. (2009) J. Wang, X. Dong, T. Wang, L.C. Ho, W. Yuan, H. Wang, K. Zhang, S. Zhang, H. Zhou, Estimating Black Hole Masses in Active Galactic Nuclei Using the Mg II 2800 Emission Line, ApJ 707 (2009) 1334–1346.
- Wang et al. (1996) T. Wang, W. Brinkmann, J. Bergeron, X-ray properties of active galactic nuclei with optical FeII emission., A&Ap 309 (1996) 81–96.
- Zamfir et al. (2008) S. Zamfir, J.W. Sulentic, P. Marziani, New insights on the QSO radio-loud/radio-quiet dichotomy: SDSS spectra in the context of the 4D eigenvector1 parameter space, MNRAS 387 (2008) 856–870.
- Zamfir et al. (2010) S. Zamfir, J.W. Sulentic, P. Marziani, D. Dultzin, Detailed characterization of H emission line profile in low-z SDSS quasars, Mon. Not. Royal Astr. Soc. 403 (2010) 1759–1786.