Trapped-ion decay spectroscopy towards the determination of ground-state components of double-beta decay matrix elements
Abstract
A new technique has been developed at TRIUMF’s TITAN facility to perform in-trap decay spectroscopy. The aim of this technique is to eventually measure weak electron capture branching ratios (ECBRs) and by this to consequently determine GT matrix elements of decaying nuclei. These branching ratios provide important input to the theoretical description of these decays. The feasibility and power of the technique is demonstrated by measuring the ECBR of 124Cs.
Keywords:
Nuclear matrix element, neutrinoless double-beta decay, Penning trap, in-trap decay spectroscopypacs:
37.10.Ty and 29.30.Kv and 23.40.-s and 14.60.Lm and 14.60.St1 The decay matrix element
Measuring the neutrino properties poses great challenges in modern physics. Despite numerous efforts, the character of the neutrino still remains a mystery, i.e., whether it is a Dirac or Majorana particle Hax84 ; Doi85 . A powerful approach to shed light on this question is through -decay experiments Hir05 ; Avi08 ; Zub12 . Double-beta decay is a rare, second-order weak process, which is expected to happen in at least two modes, the zero-neutrino () and the two-neutrino () mode. The decay has been observed in various isotopes with half-lives greater than years Bar10 . The mode is forbidden in the Standard Model of particle physics as it violates lepton-number conservation. Moreover, the existence of the neutrinoless mode uniquely establishes the Majorana character of the neutrino Sch82 ; Tak84 , and if the mass term is the leading contribution, one can deduce the effective Majorana neutrino mass from the half-life of the decay:
| (1) |
Here, is the phase-space factor and is the nuclear matrix element (NME). Currently, several models provide values for (see for example Hax84 ; Geh07 ; Eng09 ; Bar09 ; Rod10 ; Rat12 ; Cha09 ; Men11 ). In order to extract a value of , must be known with reasonable precision. Frequently, theoretical approaches use the decay to test their models (see for example Sim04 ). Recent experiments have shown that the NME is rather sensitive to the ground-state properties of the nuclear wave function Thi12a ; Thi12 ; Eji09 ; Eji12 . An experimental access to probe these ground-state nuclear wave functions and thus part of the Gamow-Teller matrix element is through spectroscopic measurements (see Ref. Fre07 and references therein). They can be obtained from measurements of the branching ratios of the intermediate nucleus, i.e., the electron capture (EC) and branching ratios (BRs) of the ground-state decay of the intermediate nucleus. For all intermediate nuclei in decays the ECBRs are small and the EC signature is the emission of X-rays by the daughter atom. This poses a formidable experimental challenge for ECBR measurements. In addition, the short-lived intermediate nucleus has to be produced at a radioactive isotope facility, which almost always delivers isobaric contamination.
In previous ECBR measurements such as the one of 100Tc, the ECBR has been measured by the implantation of radioactive 100Tc onto a tape Gar93 . This tape was then moved in front of several X-ray and -particle detectors. The difficulties of this method arise from contaminations in the sample, the -particle background from dominating branches, and possible X-ray attenuation in the implantation material. Improvements of this measurement were accomplished by applying the technique of trap-assisted decay spectroscopy at Jyväskylä Sju09 . Here, the sample was isobarically purified in a Penning trap by means of a mass-selective buffer-gas cooling technique Sav91 . The purified sample was then implanted onto an Al foil in front of a X-ray detector. The Al foil was embedded into a plastic scintillator used to veto particles. This technique improved the uncertainty of the previous ECBR measurement of 100Tc by a factor of two Sju09 . However, it still suffers from a large background due to secondary radiation and X-ray attenuation by the implantation material. In order to overcome these drawbacks a novel technique has been proposed Fre07 and developed at TITAN using an open-access Penning trap to perform in-trap decay spectroscopy. In this scheme the strong magnetic field of the trap guides particles away from the X-ray detectors and thereby reduces their contribution to the X-ray spectrum. Furthermore, established ion-trap techniques available at TITAN allow for isobaric purification of the sample in the future. Ion traps are nowadays well established tools for precision experiments at radioactive beam facilities Bla13 , however, this in-trap application is unique to the TITAN set-up. In this paper the feasibility of this technique is demonstrated by measuring the ECBR of 124Cs.
2 TITAN-EC Setup
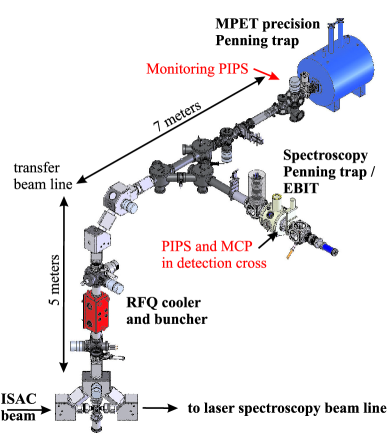
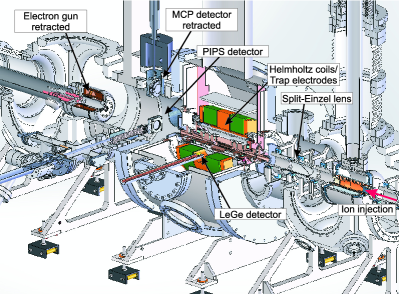
TITAN Dil03 ; Dil06 is TRIUMF’s Ion Trap facility for Atomic and Nuclear science which currently consists of the Radio-Frequency Quadrupole (RFQ) Smi06 ; Bru10b , the Electron Beam Ion Trap (EBIT) Sik05 ; Lap10 and the mass Measurement Penning Trap (MPET) Bro11c . An engineering model of the experimental setup is given in Fig. 1.
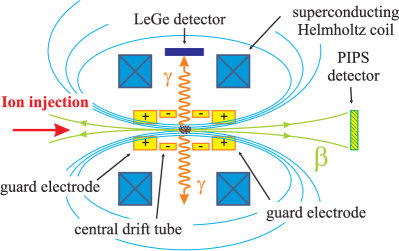
For this ECBR measurement at TITAN, the EBIT is operated as a spectroscopy-Penning trap without the electron beam. During in-trap decay spectroscopy measurements radioactive ions are stored at the center of the trap. Gamma- and X-rays following an EC event are emitted isotropically, while particles are guided out of the trap along the axis of the magnetic field (up to 5 T in the present experiment, see Fig. 2). These particles are detected by a Passivated Implanted Planar Silicon (PIPS) detector placed at one side of the trap Bru11 labeled PIPS in Fig. 1 and Fig. 2. The radial confinement provided by the magnetic field prevents electrons from reaching the X-ray detector. This spatial separation between X-ray and -particle detection constitutes the significant advantage of this technique compared to conventional ones. A schematic illustration of the setup of the spectroscopy trap is presented in Fig. 2.
The radially confining magnetic field of the trap is generated by a pair of superconducting coils arranged in a Helmholtz-like configuration Lap10 . This configuration allows for visible access to trapped ions owing to radial openings in the magnet assembly and the central trap electrode. This electrode is eight-fold segmented with slit apertures between each segment. In total, seven of these view ports towards the trap center are available for in-trap decay spectroscopy Lap10 . The measurements presented here were obtained with only one low-energy planar Ge detector (LeGe, Canberra model GUL 0110P, ø11.3 mm, 10 mm thick) used for - and X-ray detection. It was installed inside the vacuum vessel and positioned between the coils at a distance of 10 cm from the trap center.
3 In-Trap Decay Spectroscopy
The feasibility of measuring electron-capture branching ratios with a Penning trap has been demonstrated by measuring the ECBR of 124Cs within this work. This isotope was chosen due to its relatively large EC branch of 10.0(7)%. During this measurement in-trap decay spectroscopy of 126Cs has been performed as well. Cesium-126 has been used to calibrate the efficiency of the detector. Both isotopes were produced as singly charged ions at the TRIUMF ISOL-type facility ISAC Dom02 by bombarding a tantalum target with a 50 A proton beam at 500 MeV delivered by the TRIUMF cyclotron. Radioactive cesium atoms were surface-ionized and then passed through a high-resolution dipole magnet (resolving power ) to reduce isobaric contamination. Production yields were s for 124Cs, s for Cs, and s for 126Cs measured at the ISAC-I yield station Kunz09 . At TITAN, the radioactive ions were cooled and bunched by the RFQ Smi06 ; Bru10b . To identify the dominating isotope in the beam and to estimate the ion bunch intensity, 10 bunches were extracted from the RFQ at a rate of 10 Hz and transported to a surface-barrier detector assembly in front of the MPET. This detector assembly consisted of an Al foil in front of a Passivated Implanted Planar Surface-barrier detector (Canberra PIPS detector Bru08 ). The ions were implanted onto the Al foil. This detector is indicated as monitoring PIPS in Fig. 1. The isotopes 124Cs and 126Cs were identified by their half-lives. The half life of 124Cs was determined as 30.9(1) s which is in agreement with the literature value of 30.8(5) s Kat08 , however with a slightly improved uncertainty. Assuming a -detection efficiency of ion bunch intensities at 10 Hz were estimated, with exponential fits to their decay times, to be ions/bunch for 124Cs and ions/bunch for 126Cs. The efficiency is the product of intrinsic efficiency and geometric acceptance of the detector. The latter is the main contributor to the uncertainty of the total efficiency due to the uncertainty of the distance of mm between detector and Al foil. The intrinsic detection efficiency was calculated by integrating the spectrum Krane . Based on this, an intrinsic detection efficiency of was determined assuming that electrons below 250 keV were stopped by the 20 m thick Al foil and the detector’s dead layer, and thus not detected. The decay rate spectra were analyzed in order to investigate the possibility of isobaric Ba contamination. No significant contribution was found.
3.1 Measurement Cycle and Data Acquisition
During an ECBR measurement radioactive ions lost inside the RFQ and along the TITAN beam lines contribute to the photon background Bru11a . In order to correct the in-trap decay spectrum for this background in-trap decay and background spectra were recorded successively. During the measurement period , - and X-rays following radioactive decays were detected with the LeGe detector. After this measurement, the trap was emptied by extracting the remaining ions. About ms after each ion bunch was extracted from the trap, a background measurement was started for . Typically, storage and background-measurement time intervals of ms were used. A cycle with ms was also applied for a measurement period of one hour during the measurement of the calibrant 126Cs.
The energy of the - and X-rays deposited in the crystal of the low-energy Ge detector was amplified by a transistor/reset amplifier. This amplifier provided an output voltage signal with a rising edge between 0 and 5 V, which was proportional to the deposited energy. The amplifier also provided a transistor-reset signal, which was used to disable the data acquisition while the voltage signal was reset to its initial value. Both the energy and transistor-reset signals were split and fed into two ORTEC DSPEC units, called 319 and 321. These two units were then gated to record data during the time intervals (DSPEC 321) or (DSPEC 319).
3.2 Influence of the Magnetic Field on the LeGe Detector
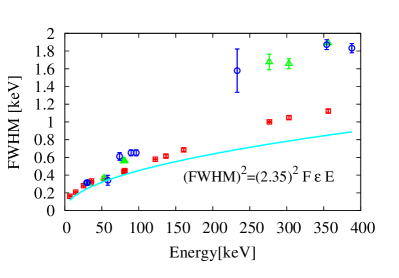
The LeGe detector, which is installed on one of the EBIT’s radial ports, was inserted between the two Helmholtz coils at a position close to the trap center. During the experiment the magnetic field at the trap center was 5 T resulting in a calculated residual field at the position of the LeGe detector of about 2 T with its orientation parallel to the surface of the crystal. It was observed that this magnetic field strength broadens the photopeaks. Figure 4 shows the full width at half maximum (FWHM) of photopeaks recorded with the LeGe detector in a no-field and 2 T field environment, respectively. No-field (0 T) refers to a residual field dominated by the earth’s magnetic field. No change of detection efficiency was observed within the uncertainty. This experimental finding necessitates further investigations.
3.3 Spectroscopic Measurements
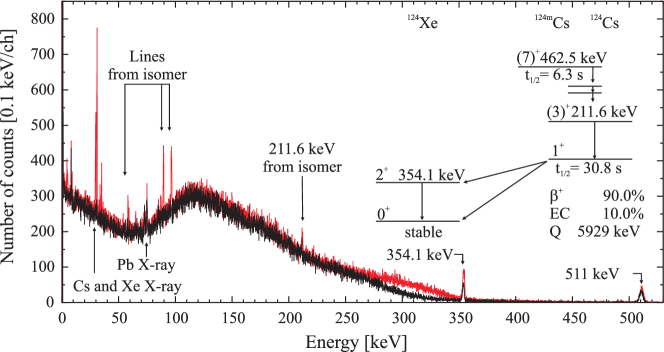
The summed decay spectrum of the 124Cs EC-process is presented in Fig. 5. The red spectrum was recorded while ions were stored in the ion trap and the black spectrum shows the background spectrum obtained after each ion bunch was extracted from the trap. Indicated in these spectra are the most prominent photopeaks and their origins. Clearly present are signatures of the isomer Cs, i.e., the Cs -shell X-ray lines of the electron conversion process and the photopeak at 211.6 keV from the depopulation of the level in Cs. Also present in the spectrum are the Pb X-ray lines which appear in both background and in-trap decay spectra. It cannot be excluded that solder containing Pb was used to contact the Ge crystal, where Pb acts as an X-ray radiator. The Pb photopeaks do not overlap with any of the X-ray peaks of interest. In the in-trap decay spectrum a shoulder is observed between 250 keV and 350 keV. This shoulder occurs in the 124Cs and 126Cs spectra. Calibration spectra with 133Ba show that the efficiency with which both DSPEC units record events degrades at energies above keV. In particular, a drop in efficiency is observed at 250 keV for DSPEC 321 (background DSPEC) and 300 keV for DSPEC 319 (in-trap measurement DSPEC). This artifact does, however, not affect the analysis of the data presented in this publication.
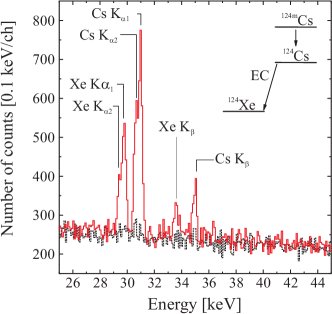
A focused view of the X-ray region is presented in Fig. 6 showing the advantage of the new in-trap decay spectroscopy technique. The dominating decay did not contribute significant background to the X-ray spectrum. Positrons reaching the LeGe detector would have resulted in a drastically increased background in the in-trap decay spectrum (solid, red line). When ions are stored in the trap a clear xenon -shell X-ray signature is visible originating from electron-capture decays of 124Cs. Also present are the cesium -shell X-ray lines that originate from the de-excitation of Cs. Note that no -shell X-ray peaks are observed in the background spectrum (dashed, black line). Comparing these two spectra one can conclude that no significant ion losses occurred radially and within the line of sight of the detector.
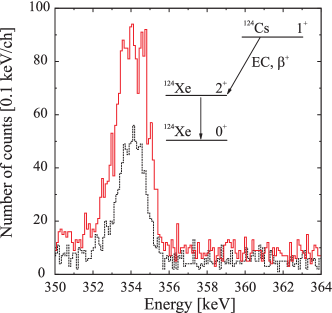
The clear distinction between in-trap decay and background spectra worsens in the higher energy range. This is evident in the 211.6 keV photopeak of the isomeric state and the 354 keV photopeak originating from the level in 124Xe. The latter peak is presented in Fig. 7 with solid, red and dashed, black line being the in-trap decay and background spectra, respectively. In this figure the photopeak is present in both spectra. In the background spectrum it originates from 124Cs ions that were lost along the beam line during injection and ejection as well inside the RFQ. The material surrounding the LeGe detector does not provide sufficient shielding. This agrees with previous observations where 126Cs was deposited in the RFQ and the 354 keV peak was present in the LeGe detector spectrum Bru11a . It is therefore essential to measure both in-trap decay and background spectra immediately after each other.
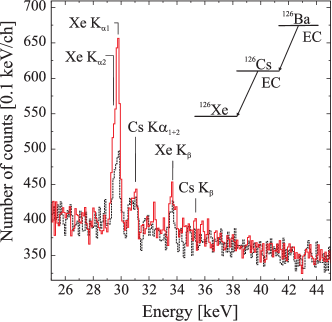
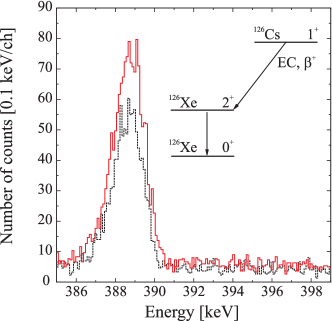
The 126Cs spectra that are used for calibration are presented in Fig. 8 and Fig. 9 for X-ray and region, respectively. During this measurement ions were lost inside the trap center and contributed to the X-ray background spectrum presented in Fig. 8. The 388 keV photopeak also has a stronger contribution in the background spectrum as compared to the 354 keV photopeak of 124Cs shown in Fig. 7. Ion beam intensity as well as injection parameters were different for 124Cs and 126Cs. These effects need to be investigated in future developments of this technique in order to improve the signal-to-background ratio.
3.4 Data Analysis
The electron capture branching ratio is defined as the number of decays by electron captures divided by the total number of decays . The quantity accessible in our experiment is the number of detected -shell X-rays emitted following an electron capture defined as . The total number of decays is extracted from the photopeak counts of the lowest state of the daughter nucleus of the branch. The photopeak intensity was taken from literature Kat08 and the ECBR can then be written as
| (2) |
with being the total intensity of the -shell conversion electrons, being the fluorescence yield, and the probability that an EC event creates a vacancy in the -shell. Since both, X-ray and photons are recorded with the same detector the geometrical acceptance cancels out. The detection efficiency describes the intrinsic detection efficiency at X-ray and energies and , respectively. The latter equation simplifies to
| (3) |
using the total -shell intensity
| (4) |
and subtracting the -shell X-ray intensity due to conversion electrons
Sch96a Kat08 .
The detector efficiency term in the X-ray energy region cancels out if another isotope of the same element with a well-known X-ray intensity is measured under the same experimental conditions. This known X-ray intensity can be expressed as
| (5) |
One can re-write Eq. 4 as
| (6) |
if the X-ray energies are identical, as for isotopes of the same element. Therefore, only the ratio needs to be known. For photon energies above keV the detector response is well known and the self-shielding of the calibration sources is less of a concern than in the X-ray region. Typically, and are above 120 keV. The ECBR of 124Cs was determined by applying the described method using 126Cs for calibration.
3.5 Results
The photopeak counts and of the 124Cs, 126Cs and calibration spectra have been determined by the method of maximum likelihood. In the fit of X-ray spectra the relative -shell intensities and energies were constrained to their known values XRDB .
The measurement periods of 25 ms and 50 ms were short compared to the half-lives of 30.8(5) s and 1.64(2) min for 124Cs and 126Cs, respectively. Therefore, the decay rate was considered constant throughout both measurement periods. This assumption is valid to a level of the order of . Based on this assumption, the peak intensity of the background measurement recorded during was subtracted from the peak intensity measured during . The measurement was divided into time slices. Within each time slice all settings were kept constant. Cesium-126 was measured in five time slices for a total of 12 hours while 124Cs was measured in two time slices for a total of 6 hours. The resulting 124Cs and 126Cs photopeak intensities are presented in Table 1 and Table 2, respectively.
| TS | X-ray peak | peak | corr. peak | |
|---|---|---|---|---|
| Xe & | 354.1 keV | 354.1 keV | ||
| 4 | 94(43) | 549(28) | 837(158) | BGND |
| 1074(66) | 1152(40) | storage | ||
| 2 | 0(10) | 285(19) | 434(84) | BGND |
| 490(42) | 534(27) | storage |
| TS | X-ray peak | peak | corr. peak | |
|---|---|---|---|---|
| Xe & | 388 keV | 354.1 keV | ||
| 3 | 399.67(67) | 704(31) | 843(125) | BGND |
| 1218.91(69) | 1038(42) | storage | ||
| 1 | 164(45) | 382(22) | 271(43) | BGND |
| 591(53) | 479(26) | storage | ||
| 2 | 494.89(62) | 730(30) | 874(128) | BGND |
| 864.67(68) | 896(34) | storage | ||
| 3 | 513.75(62) | 667(29) | 798(118) | BGND |
| 1055.45(74) | 947(35) | storage | ||
| 3 | 480.26(58) | 603(27) | 722(107) | BGND |
| 963.81(68) | 799(32) | storage |
After the experiment was performed it was discovered that the DSPEC units truncate the energy signal, i.e., the number of recorded counts in the spectrum does not correspond to the number of expected counts. Comparison with Monte-Carlo simulations shows that both DSPEC units attenuated energy signals of photon energies above keV. At photopeak energies of keV this truncation amounts to more than two orders of magnitude. During the experiment 133Ba calibration spectra were recorded to identify possible drifts in the data acquisition. However, the number of counts in these spectra are low hence it is difficult to use them for calibration. The ratio of photopeak counts recorded with DSPECs 319 and 321 was calculated for all peaks in the 133Ba spectrum. The ratio in the X-ray region agrees with unity within uncertainty. However, the ratio at photopeak energies 276.3 keV, 302.9 keV, and 356.0 keV is energy dependent following a linear curve. This curve determines how efficient DSPEC 319 records photons at the energies of 354 keV (124Cs) and 388 keV (126Cs) with respect to DSPEC 321. The extrapolated ratio was then used to correct the photopeaks recorded with DSPEC 321 at 354 keV and 388 keV. The corrected values as well as all extracted photopeak counts are listed in Table 1 and Table 2 for 124Cs and 126Cs, respectively. The corrected counts in the background spectrum were then subtracted from the counts of the spectroscopy spectrum and the ratios of and were determined. These ratios were calculated independently for each time slice. The weighted average of this ratio was then calculated for each isotope. The ratio was determined with the 133Ba calibration spectrum recorded with DSPEC 319. The 133Ba photopeaks at energies of 276.3 keV, 302.9 keV and 356.0 keV Kha11 were used to extract the ratio of efficiencies at 354 keV and 388 keV.
The ECBR of 124Cs was calculated according to Eq. 3 and Eq. 6 to be and is based on the measured ratios (124Cs), (126Cs), and , Kat08 , Sch96a , , and Kat02 . Our value agrees with the literature value of 10.0(7)% Kat08 ; logft2001 . However, the truncated detection efficiency of the DSPEC units reduced the counts in the photopeak that was used for normalization. The inefficiency in detection of these photons artificially increases the ECBR and is accounted for in the large systematic uncertainty. This systematic uncertainty arises from the different efficiencies of DSPEC 319 and 321. Nevertheless, the presented measurement proves that these decay-spectroscopy experiments are feasible.
The use of detected particles at the PIPS detector mounted at one side of the trap for normalization has been investigated. In detailed SIMION Dahl:2000lr simulations it was found that the number of electrons or positrons reaching the PIPS detector strongly depends on various parameters Bru11 ; Bru11a . Among those, the position of the decaying ions (i.e. the ion cloud size and density distribution inside the trap) has the largest impact. The probability of a particle reaching the PIPS detector also depends on the value of the decay. Since the trap is cryogenic it is almost impossible to place a calibration source inside the trap center and map the detection efficiency for various source locations. Hence the concept of using particles for normalization purposes has been discarded.
The X-ray photopeak areas of 124Cs and 126Cs, and the 89.5 keV and 96.6 keV lines of Cs were used to estimate the number of ions that were injected into the trap. Only decays of stored ions were considered, i.e., the peak area recorded during the background measurement was subtracted from the decay measurement. The detection efficiency was extracted from PENELOPE simulations of the experimental setup. The extracted intensities are presented in Table 3. The intensities of 126Cs were extracted for each time slice separately throughout the experiment. They varied over time due to slight changes in beam tune and delivered isotope intensity. The RFQ cycle that was applied during these measurements differs from the 10 Hz rate presented in Section 3. Furthermore, before being captured in the Penning trap the ion bunches had to pass two additional electrostatic bender where ions could have been lost. This could explain the lower ion bunch intensities listed in Table 3 compared to the PIPS measurement presented earlier.
| Isotope | TS | TS | Ion bunch intensity |
|---|---|---|---|
| Cs | 6 | ||
| Cs | |||
| 126Cs | 1 | 3 | |
| 126Cs | 2 | 1 | |
| 126Cs | 3 | 2 | |
| 126Cs | 4 | 3 | |
| 126Cs | 5 | 3 |
4 Future ECBR measurement
After the ECBR measurement described in this work the detection setup has been upgraded. The single LeGe detector has been replaced by seven custom-made lithium-drifted Silicon (Si(Li)) detectors installed at all available view ports of the trap. This increases the geometrical acceptance from Bru11c to %. The detectors are placed outside the vacuum vessel behind thin Be windows. This increased distance to the trap center reduces the magnetic field at the position of the crystal to less than 1 T. To further enhance the sensitivity of the setup towards smaller ECBRs passive low-activity Copper-Lead sandwich shields have been added to the Si(Li) detectors. Moreover, the addition of BGO crystals as active Compton-suppression shielding has been studied, and a prototype is being constructed. The data acquisition system has been upgraded by replacing the DSPECs with sampling analog-to-digital converters (Struck SIS3302) Len12 , effectively eliminating any rate or energy dependent biases. These upgrades significantly reduce the background while increasing acceptance and mitigate the presented issues with the DSPEC DAQ.
5 Conclusion
A new technique has been developed at the TITAN facility to measure the ground-state transition strength of intermediate nuclei in decays utilizing an open-access Penning trap. The feasibility and power of this in-trap decay spectroscopy technique have been demonstrated and various systematic studies have been performed. Within these studies an electron-capture decay of ions stored in a Penning trap has been observed for the first time Bru11c ; Ett09 . During the ECBR measurement of 124Cs it was observed that ion losses along the beam line also contribute to the recorded photon spectrum, dominantly for photopeak energies above keV. A measurement cycle has been developed and applied to record background spectra immediately after the ions were extracted from the trap. With this technique and the upgraded experimental setup the determination of ECBRs as low as is within reach.
6 Acknowledgment
TRIUMF receives federal funding via a contribution agreement with the National Research Council of Canada (NRC). This work was partly funded by NSERC and by the Deutsche Forschungsgemeinschaft (DFG) under grant FR 601/3-1. T.B. acknowledges support by evangelisches Studienwerk e.V. Villigst, A.G. acknowledges support from NSERC PGS-M program, V.V.S from the Studienstiftung des Deutschen Volkes and S.E. from the Vanier CGS program. We acknowledge the great support of TRIUMF and ISAC operations. We thank I. Ostrovskiy for fruitful discussions on data analysis and statistics. Also thanked are C. Pearson, S. Williams, S. Daviel, and P.-A. Amaudruz for their help with the DAQ system. We would especially like to thank TITAN’s technologist M. Good for his help in setting up this experiment.
References
- (1) W. C. Haxton, G. J. Stephenson, Progress in Particle and Nuclear Physics 12, 409 (1984)
- (2) M. Doi, T. Kotani, E. Takasugi, Progress of Theoretical Physics Supplement 83, 1 (1985)
- (3) H. Ejiri, Journal of the Physical Society of Japan 74, 8, 2101 (2005)
- (4) F. T. Avignone, S. R. Elliott, J. Engel, Review of Modern Physics 80, 481 (2008)
- (5) K. Zuber, Journal of Physics G: Nuclear and Particle Physics 39, 124009 (2012)
- (6) A. S. Barabash, Physical Review C 81, 035501 (2010)
- (7) J. Schechter, J. W. F. Valle, Physical Review D 25, 11, 2951 (1982)
- (8) E. Takasugi, Physics Letters B 149, 372 (1984)
- (9) V. M. Gehman, S. R. Elliott, Journal of Physics G: Nuclear and Particle Physics 34, 4, 667 (2007)
- (10) J. Engel, G. Hagen, Physical Review C 79, 6, 064317 (2009)
- (11) J. Barea, F. Iachello, Physical Review C 79, 4, 044301 (2009)
- (12) T. R. Rodríguez, G. Martínez-Pinedo, Physical Review Letters 105, 252503 (2010)
- (13) P. K. Rath, R. Chandra, P. K. Raina, et al., Physical Review C 85, 014308 (2012)
- (14) R. Chandra, K. Chaturvedi, P. K. Rath, et al., Europhysics Letters 86, 3, 32001 (2009)
- (15) J. Menéndez, D. Gazit, A. Schwenk, Phys. Rev. Lett. 107, 062501 (2011)
- (16) F. Šimkovic, L. Pacearescu, A. Faessler, Nuclear Physics A 733, 321 (2004)
- (17) J. H. Thies, T. Adachi, M. Dozono, et al., Phys. Rev. C 86, 044309 (2012)
- (18) J. H. Thies, D. Frekers, T. Adachi, et al., Phys. Rev. C 86, 014304 (2012)
- (19) H. Ejiri, Journal of the Physical Society of Japan 78, 7, 074201 (2009)
- (20) H. Ejiri, Journal of the Physical Society of Japan 81, 3, 033201 (2012)
- (21) D. Frekers, I. Tanihata, J. Dilling, Canadian Journal of Physics 85, 57 (2007)
- (22) A. García, Y.-D. Chan, M. T. F. da Cruz, et al., Physical Review C 47, 6, 2910 (1993)
- (23) S. K. L. Sjue, D. Melconian, A. García, et al., Physical Review C 78, 6, 064317 (2008)
- (24) G. Savard, S. Becker, G. Bollen, et al., Physics Letters A 158, 5, 247 (1991)
- (25) K. Blaum, J. Dilling, W. Nörtershäuser, Physica Scripta 2013, 014017 (2013)
- (26) J. Dilling, P. Bricault, M. Smith, et al., Nuclear Instruments and Methods in Physics Research Section B 204, 0, 492 (2003)
- (27) J. Dilling, R. Baartman, P. Bricault, et al., International Journal of Mass Spectrometry 251, 198 (2006)
- (28) M. Smith, L. Blomeley, P. Delheij, et al., Hyperfine Interactions 173, 0304 (2006)
- (29) T. Brunner, M. Smith, M. Brodeur, et al., Nuclear Instruments and Methods in Physics Research Section A 676, 0, 32 (2012)
- (30) G. Sikler, J. C. López-Urrutia, J. Dilling, et al., The European Physical Journal A - Hadrons and Nuclei 25, 63 (2005)
- (31) A. Lapierre, M. Brodeur, T. Brunner, et al., Nuclear Instruments and Methods In Physics Research Section A 624, 1, 54 (2010)
- (32) M. Brodeur, V. Ryjkov, T. Brunner, et al., International Journal of Mass Spectrometry 310, 0, 20 (2012)
- (33) T. Brunner, M. Brodeur, S. Ettenauer, et al., Journal of Physics: Conference Series 312, 072006 (2011)
- (34) M. Dombsky, P. Bricault, T. Hodges, et al., Nuclear Physics A 701, 486 (2002)
- (35) P. Kunz, ISAC-I yield measurements - ISAC e-log entry July 21, 2009 at 1:10am (2009)
- (36) T. Brunner, M. Brodeur, C. Champagne, et al., Nuclear Instruments and Methods In Physics Research Section B 266, 19-20, 4643 (2008)
- (37) J. Katakura, Z. Wu, Nuclear Data Sheets 109, 7, 1655 (2008)
- (38) K. Krane, Introductory Nuclear Physics (Wiley, 1987)
- (39) T. Brunner, In-Trap Decay Spectroscopy for Decays, Ph.D. thesis, Technische Universität München, Munich, Germany (2011)
- (40) G. F. Knoll, Radiation Detection and Measurement (Wiley, 2000)
- (41) National Nuclear Data Center, LOGFT version 7.2 (2001)
- (42) E. Schönfeld, H. Janßen, Nuclear Instruments and Methods In Physics Research Section A 369, 2-3, 527 (1996)
- (43) A. C. Thompson, D. T. Attwood, E. M. Gullikson, et al., The X-Ray Data Booklet (2009), URL http://xdb.lbl.gov/
- (44) Y. Khazov, A. Rodionov, F. Kondev, Nuclear Data Sheets 112, 4, 855 (2011)
- (45) J. Katakura, K. Kitao, Nuclear Data Sheets 97, 3 4, 765 (2002)
- (46) D. A. Dahl, Int. J. Mass Spectrom. 200, 1-3, 3 (2000)
- (47) T. Brunner, M. Brodeur, P. Delheij, et al., Hyperfine Interactions 199, 191 (2011)
- (48) A. Lennarz, A. Grossheim, F. Jang, et al., Hyperfine Interactions submitted (2012)
- (49) S. Ettenauer, T. Brunner, M. Brodeur, et al., AIP Conference Proceedings 1182, 1, 100 (2009)