Direct Imaging Detection of Methane in the Atmosphere of GJ 504 b
Abstract
Most exoplanets detected by direct imaging so far have been characterized by relatively hot (1000 K) and cloudy atmospheres. A surprising feature in some of their atmospheres has been a distinct lack of methane, possibly implying non-equilibrium chemistry. Recently, we reported the discovery of a planetary companion to the Sun-like star GJ 504 using Subaru/HiCIAO within the SEEDS survey. The planet is substantially colder (600 K) than previously imaged planets, and has indications of fewer clouds, which implies that it represents a new class of planetary atmospheres with expected similarities to late T-type brown dwarfs in the same temperature range. If so, one might also expect the presence of significant methane absorption, which is characteristic of such objects. Here, we report the detection of deep methane absorption in the atmosphere of GJ 504 b, using the Spectral Differential Imaging mode of HiCIAO to distinguish the absorption feature around 1.6 m. We also report updated photometry based on new -band data and a re-analysis of the existing data. The results support the notion that GJ 504 b has atmospheric properties distinct from other imaged exoplanets, and will become a useful reference object for future planets in the same temperature range.
1 Introduction
Several companions to stars in or near the planetary regime have been discovered through direct imaging in recent years (e.g. Marois et al., 2010; Lagrange et al., 2010; Carson et al., 2013), which has provided the opportunity for characterization of their atmospheres. The HR 8799 system in particular has been the subject of several studies using spectroscopy and multi-band photometry. These observations have provided indications of atmospheric properties such as non-equilibrium chemistry (e.g. Janson et al., 2010; Hinz et al., 2010; Bowler et al., 2010) and thick clouds (e.g. Barman et al., 2011; Currie et al., 2011; Skemer et al., 2012). The latter implies that there may be a difference in cloud retention between 1000 K planets and more massive brown dwarfs in the same temperature range. Brown dwarfs undergo the so-called L/T transition (e.g. Kirkpatrick, 2005) at these temperatures, which is thought to indicate a transition from cloudy (L-type) to clear (T-type) photopheres (e.g. Leggett et al., 2000; Chabrier et al., 2000; Allard et al., 2001). The apparent difference between planets and brown dwarfs in this regard can be theoretically justified through a dependence of the transitional temperature on surface gravity (Metchev & Hillenbrand, 2006; Marley et al., 2012).
Recently, we presented the discovery of GJ 504 b (Kuzuhara et al., 2013), a planetary companion to a nearby G0-type star, made with direct imaging as part of the ‘Strategic Exploration of Exoplanets and Disks with Subaru’ program (SEEDS; Tamura, 2009). With an age of 100 myr and a temperature of less than 600 K, GJ 504 b allows for study of a new class of planetary atmospheres, where the clouds have largely disappeared from the photosphere, more clearly revealing the molecular contents of the atmospheres. In this paper, we present new data in intermediate-band methane filters within -band and re-analyze the broad-band photometry from Kuzuhara et al. (2013) in order to acquire a uniformly reduced data set. In the following, we first describe the new observations that have been acquired, and the reduction procedure for the acquired data, as well as the re-reduction of the previous broad-band data. We then summarize the results, and compare them to a grid of models in order to constrain physical parameters, and finally we discuss the broader implications of our results.
2 Observations and Data Reduction
Here, we discuss the and -band observations that have already been presented by Kuzuhara et al. (2013), new observations in and , and a re-observation in -band. and are intermediate-band methane filters ranging from 1.486 m to 1.628 m for the former and from 1.643 m to 1.788 m for the latter. These filters are designed to capture both sides of the 1.6 m methane bandhead expected in cool giant planet atmospheres under chemical equilibrium. If strong methane absorption is present, there should be significantly more flux in the band, which is outside of the methane absorption feature, than in the band, which is inside of it. The and images were acquired on 15 May 2012 using the HiCIAO camera (Suzuki et al., 2010) with the AO188 adaptive optics system (Hayano et al., 2008) in the 2-channel SDI (simultaneous spectral differential imaging) mode, in which the incoming beam is split into two beams using a Wollaston prism. One beam is passed through the filter and one through the filter, and the resulting two images are placed side by side on the detector. As with all the other observations of GJ 504, the Angular Differential Imaging (ADI; Marois et al., 2006) mode was used, where the image rotator is used to keep the orientation of the telescope pupil fixed on the detector (pupil tracking). An exposure time of 20 seconds was used for each frame, without co-adding. During the continuous sequence of 106 minutes (including overheads), 219 frames were acquired with these settings, spanning a field rotation of 94.4o. In addition, non-saturated images were acquired interspersed with the ADI sequence (50 frames in total) for photometric referencing. These used 1.5 s exposures (without co-adding) and a neutral density (ND) filter. The ND filter has a transmission of 0.859% across the broad -band, but varies across wavelength such that the transmission is 0.714% in and 0.929% in . The -band observation was acquired on 11 May 2012 in the same way as for the previous -band measurement of Kuzuhara et al. (2013) from 28 Feb 2012, using HiCIAO in the ADI mode. Each co-added exposure consisted of 10 co-adds with individual integration times of 10.0 s. A total of 38 co-added exposures were acquired, spanning a field rotation of 68.1o. All observations used a circular occulting mask with a diameter of 04.
Since the Wollaston prism splits up the beam based on polarization state, there is in principle a risk that either instrumental polarization or polarizated light from the planet itself could impact the apparent photometry in the SDI imaging. However, these effects are small (note that the planetary flux is emitted light rather than reflected light), particularly as the field rotation during the observation was more than 90o, which means that any polarization effect should be efficiently averaged out across the observation. Hence, we treat these effects as negligible in this analysis.
Data reduction was performed using the ACORNS-ADI pipeline in a uniform manner, described in Brandt et al. (2013). In addition to the , , and -band data, the and -band data from Kuzuhara et al. (2013) were re-reduced as well, since the discovery paper used a different pipeline and different reduction parameters and we wanted a uniform procedure. We also wished to examine whether uncertainties in the centroiding could have led to slightly higher photometric uncertainties than had previously been accounted for. Consequently, particular attention was committed to the registration procedure, which was applied after standard de-striping and flat fielding of the data. Errors in image centroiding and registration propagate into the derived companion photometry, and always result in a lower measured companion flux. An incorrect absolute centroid will dilute the companion flux in a de-rotated and collapsed image. The impact of this effect scales with the amount of field rotation during the observation. Errors in image registration reduce the measured companion photometry as shown in Figure 6 of Brandt et al. (2013); for example, root-mean-square errors of one HiCIAO pixel in both the horizontal and vertical directions reduce the measured near-IR photometry by 20%.
The images of GJ 504 were nearly all taken with an opaque mask covering the central star, making registration and centroiding difficult: a positional shift by the star relative to the mask does not simply appear as a positional shift in the image on the detector. We therefore started out by not attempting to register the raw masked images, nor attempting to fit an absolute centroid directly. Instead, we initially assumed the frame-to-frame pointing stability to be perfect, estimated the centroid by eye, and then performed LOCI (Locally Optimized Combination of Images; Lafrenière et al., 2007). We then de-rotated the image sequence around many possible absolute centroids and co-added each resulting sequence. In this way, it becomes possible to find the centroid offset that maximizes GJ 504 b’s signal-to-noise ratio in the final, reduced frame.
Our method partially compensates for a real, stable drift of the stellar centroid, by also fitting for the drift speed and direction that maximizes the companion signal-to-noise ratio. Typical centroid drifts over a long observation are generally not more than 1–2 pixels (Brandt et al., 2013), with a 2–3 pixel drift observed over a multi-hour observation at very high airmass (Thalmann et al., 2011). We therefore expect the uncorrected bias from a stable drift to be much less than the 20% that would have been introduced by positional fluctuations of 1 pixel, as mentioned above (Brandt et al., 2013). Likewise, the actual frame-to-frame positional fluctuations in SEEDS images are small, 0.3 pixels (Brandt et al., 2013) and will have little effect on our photometry.
Major variations in atmospheric conditions and AO performance over the course of an observing run present another photometric difficulty. While it is possible to estimate the data quality from the diffraction pattern on masked frames, HiCIAO does not introduce an unsaturated central peak (as would a semitransparent mask) for a more precise calibration. Unsaturated photometric frames were sometimes taken only before and after an observing sequence and sometimes interspersed within a sequence. While most observations had stable conditions and consistent photometry across the sequences, the May 2011 -band data presented a more difficult case. The unsaturated photometric frames taken before and after the sequence of masked science frames showed a remarkable uniformity in AO performance, and the science data themselves seemed to show no major AO failures or changes in observing conditions. However, using only the first half of the sequence yielded a planet flux 50% higher than that derived from the latter half of the sequence. This discrepancy corresponds to a 2 significance level. None of the other data sets showed any differences of this magnitude for companion photometry in subgroups of science frames.
All frames were subjected to a LOCI-based PSF (Point Spread Function) modeling and subtraction with standard ACORNS-ADI parameters (, ). We also tried varying the parameters, but since the final image is not strongly dominated by PSF residuals at the location of the companion, this had a negligible effect. All the PSF-subtracted data were de-rotated to a common field orientation and co-added to form the final image of each filter. The primary flux (rescaled from the neutral density filter images in the case of and ) as well as the secondary flux were calculated in circular apertures with a diameter equal to the 75% of the FWHM. Partial subtraction as a function of angular separation imposed by LOCI was accounted for when determining the contrasts.
3 Results and Discussion
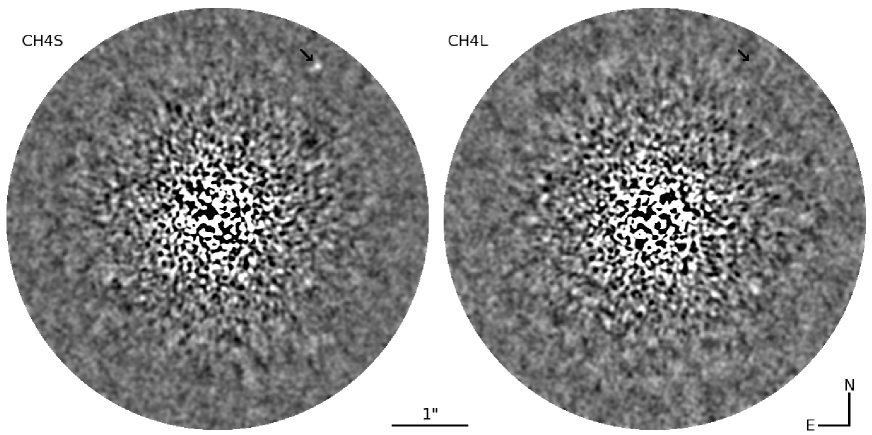
The final and images resulting from the reduction are shown in Fig. 1, and the photometric values are shown in Table 1. It can be immediately seen from the images that the planet is bright in but disappears in . This corresponds exactly to the behavior expected from an atmosphere with methane absorption, given that encompasses the methane aborption feature, whereas represents the continuum flux. Apparent magnitudes for the companion were calculated as the measured contrast to the primary plus the magnitude of the primary in the given filter. Since there are no literature values for the primary’s and magnitudes, we translated the -band magnitude into these bands by relating the stellar flux to the Vega flux in the relevant passbands, assuming blackbody radiation with a of 6234 K for GJ 504 (G0V) and 9602 K for Vega (A0V). As expected, the corrections were very small, with mag and mag. Apparent magnitudes were translated into absolute magnitudes using the parallax distance of 17.560.08 pc from Hipparcos (van Leeuwen, 2007).
| Band | GJ 504 A | GJ 504 b |
|---|---|---|
| 4.110.01 mag | 19.760.10 mag | |
| 3.860.01 mag | 19.990.10 magaaThere is an apparent systematic difference between the first and second
halves of the data set, see text for discussion. |
|
| 3.810.01 mag | 19.380.11 mag | |
| 3.880.01 mag | 19.590.12 mag | |
| 3.850.01 mag | 20.62 mag (3) |
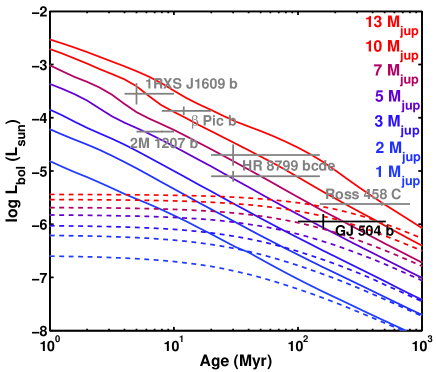
The updated and photometry is 0.1 mag brighter than the previous photometry. This is consistent within the error bars, but we adopt the new photometry as it more accurately represents the full set of flux losses possible in the reduction procedure. Our -band photometry based on the newer (May 2012) data point alone is 0.3 mag fainter than previously, which is again consistent given the larger scatter in the Feb 2012 data. The -band photometry presented here is based on a weighted mean of the two epochs111We note here that the newer (May 2013) -band image has in fact already been plotted in Kuzuhara et al. (2013).. We note that the changes in values of this order correspond to changes of a small fraction of 1 in inferred mass (0.1–0.2 ) regardless of the choice of mass-luminosity model, hence there is no significant change to the mass estimation presented in Kuzuhara et al. (2013). On this topic, it is also worth noting that the uncertainties in physical quantities from these observational uncertainties are strongly dominated by model uncertainties, as could also be seen in Kuzuhara et al. (2013). For instance, comparing the old and the new measurements within the context of the Spiegel & Burrows (2012) models, the differences in inferred temperature and luminosity are 1% and 6%, respectively. By contrast, the difference for equal measurements between the Baraffe et al. (2003) models and the Spiegel & Burrows (2012) models are 14% in temperature and 51% in luminosity. This is simply because the Spiegel & Burrows (2012) models generally predict fainter magnitudes for a given effective temperature and luminosity. We use the dominating span between the models as the uncertainties when we plot the luminosity and temperature in Figs. 2 and 3.
Using the full range in luminosity, we show in Fig. 2 that the mass estimate remains well constrained to the planetary mass range, irrespective of initial conditions. The agreement between the photometry of our new -band observation with the previous one also demonstrates the general robustness of the photometry. However, one issue that should be kept in mind is that the -band observation displays a puzzling behavior, where the companion appears to have a 2 different brightness in the first and second halves of the data set, apparently irrespective of calibration issues. It may be that something (e.g., temporary cloud coverage) occurred during some part of the observation such that it should not be trusted. However, there are no visual or quantitative clues in the data to support such an assessment. In general, it should be recalled that the difference of the two halves of the data set could simply be a statistical fluctuation, as 2 is not a statistically unreasonable deviation. We note that, as was mentioned by (Kuzuhara et al., 2013), the average -band photometry of the May 2011 epoch is consistent with the photometry from the March 2011 discovery epoch, which may support the statistical fluctuation interpretation. Future observations will be necessary to conclusively settle this issue.
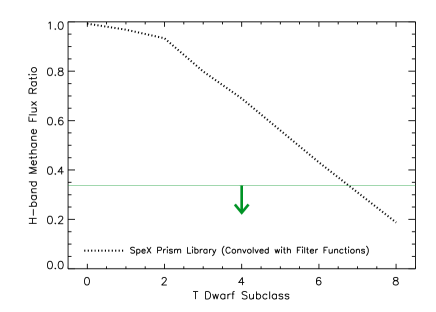
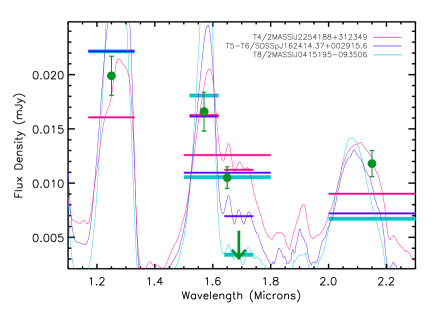
With the and observations taken simultaneously, the methane detection is robust to any photometric calibration uncertainties. The absorption is deep and appears consistent with late T-dwarfs in the field. In order to quantify this, we calculated spectral indices from brown dwarfs in the SpeX prism library222Maintained by Adam Burgasser at http://pono.ucsd.edu/ adam/browndwarfs/spexprism using and filter functions. A comparison to GJ 504 b is shown in Fig. 3. It can be seen that the methane absorption of the planet is consistent with spectral types later than T6. To further check how GJ 504 b compares to empirical spectra, we also calculated photometry from the SpeX library in addition to and , and derived after applying a best-fit scaling factor and penalizing spectra predicting a detection (Currie et al., 2011). Examples from the comparison are shown in Fig. 4. This analysis again suggests a late spectral type, with T8 providing a better fit than earlier spectral types, although the best fit still is not impressive, due to the excess brightness at -band of GJ 504 b relative to field dwarfs already noted in Kuzuhara et al. (2013).
Methane has otherwise remained elusive in exoplanetary atmospheres thus far. While indications of methane have been suggested for the transiting planets HD 189733 b and WASP-12 b, these interpretations are ambiguous (e.g. Swain et al., 2008; Gibson et al., 2011; Mandell et al., 2011; Stevenson et al., 2013). Also for the case of directly imaged planets, there has been a trend of CO/CO2 being the dominant carbon-bearing species, rather than CH4 as is expected under chemical equilibrium (e.g. Lodders & Fegley, 2002; Konopacky, 2013; Lee et al., 2013, and references above). Methane absorption has been identified in the atmosphere of HR 8799 b (Barman et al., 2011), though at modest strength. A stronger case of methane absorption has been reported in Ross 458 C (Burgasser et al., 2010), which is a very wide (1000 AU) companion to an M-dwarf binary with an inferred mass near the deuterium-burning limit. In Kuzuhara et al. (2013), we noted that the colors of GJ 504 b are similar to those of GJ 758 B (Thalmann et al., 2009), which is a similarly cold brown dwarf companion to a Sun-like star. Our current detection of methane further underlines this similarity, as GJ 758 B also features strong methane absorption (Janson et al., 2011). This strengthens the indications that GJ 504 b belongs to a different class of atmospheres than most of the previously imaged planets. The latter share similarities with L-type or L/T transition brown dwarfs, while GJ 504 b appears to have more in common with the T spectral type range. However, like GJ 758 B, it is anomalously bright in the -band range, which could be a signature of high metallicity or possibly low surface gravity. Indeed, this feature of high -band brightness relative to field brown dwarfs of similar temperature is a feature that is also present in other objects with indications of very low gravity, such as CFBDSIR J214947.2-040308.9 (Delorme et al., 2012) and Ross 458 C (Goldman et al., 2010; Burningham et al., 2011, e.g.).
The similarity of GJ 504 b to late T-type objects, implying relatively little cloud coverage (although remnant clouds cannot be excluded, see e.g. Burgasser et al., 2010; Morley et al., 2012), is particularly interesting in the context that thick clouds have been inferred even for HR 8799 b, whose temperature may be as low as 800 K (e.g. Barman et al., 2011), significantly colder than the temperature of 1400 K at which brown dwarfs lose their thick clouds (e.g. Allard et al., 2001). This implies that the transition from a more to a less cloudy regime may occur somewhere in the temperature range of 600–800 K for objects in the planetary mass range, and is consistent with the predictions of Marley et al. (2012). Future detections of planets in this intermediate range would be critical to test this hypothesis. The necessary quantity of such objects may be delivered by near-future facilities such as GPI (Macintosh et al., 2008), SPHERE (Beuzit et al., 2008), or CHARIS (Peters et al., 2012). Similarly, it will be useful to study planetary mass companions to very low-mass stars and brown dwarfs (e.g. Chauvin et al., 2005), or even free-floating objects in this mass range (e.g. Delorme et al., 2012) in order to test for possible similarities or distinctions between these different populations, and thus to clarify mutual trends with surface gravity, or divergent trends from formation scenarios.
References
- Allard et al. (2001) Allard, F., Hauschildt, P., Alexander, D.R., Tamanai, A., & Schweitzer, A. 2001, ApJ, 556, 357
- Baraffe et al. (2003) Baraffe, I., Chabrier, G., Barman, T.S., Allard, F., & Hauschildt, P. 2003, A&A, 402, 701
- Barman et al. (2011) Barman, T., Macintosh, B., Konopacky, Q., & Marois, C. 2011, ApJ, 733, 65
- Beuzit et al. (2008) Beuzit, J. et al. 2008, Proc. SPIE, 7014, 41
- Bowler et al. (2010) Bowler, B., Liu, M., Dupuy, T., & Cushing, M. 2010, ApJ, 723, 850
- Brandt et al. (2013) Brandt, T. et al. 2013, ApJ, 764, 183
- Burgasser et al. (2010) Burgasser, A. et al. 2010, ApJ, 725, 1405
- Burningham et al. (2011) Burningham, B. et al. 2011, MNRAS, 414, 3590
- Carson et al. (2013) Carson, J. et al. 2013, ApJ, 763, L32
- Chabrier et al. (2000) Chabrier, G., Baraffe, I., Allard, F., & Hauschildt, P. 2000, ApJ, 542, 464
- Chauvin et al. (2005) Chauvin, G., Lagrange, A.-M., Zuckerman, B, Mouillet, D., Song, I., Beuzit, J.-L., & Lowrance, P. 2005, A&A, 438, L29
- Currie et al. (2011) Currie, T. et al. 2011, ApJ, 729, 128
- Delorme et al. (2012) Delorme, P. et al. 2012, A&A, 548, 26
- Gibson et al. (2011) Gibson, N.P., Pont, F., & Aigrain, S. 2011, MNRAS, 411, 2199
- Goldman et al. (2010) Goldman, B., Marsat, S., Henning, T., Clemens, C. & Greiner, J. 2010, MNRAS, 405, 1140
- Hayano et al. (2008) Hayano, Y. et al. 2008, Proc. SPIE, 7015E, 701510
- Hinz et al. (2010) Hinz, P., Rodigas, T., Kenworthy, M., Sivanandam, S., Heinze, A., Mamajek, E., & Meyer, M. 2010, ApJ, 716, 417
- Janson et al. (2010) Janson, M., Bergfors, C., Goto, M., Brandner, W., & Lafrenière, D. 2010, ApJ, 710, L35
- Janson et al. (2011) Janson, M. et al. 2011, ApJ, 728, 85
- Kirkpatrick (2005) Kirkpatrick, J.D. 2005, ARA&A, 43, 195
- Konopacky (2013) Konopacky, Q., Barman, T.S., Macintosh, B.A., & Marois, C. 2013, Science, 339, 1398
- Kuzuhara et al. (2013) Kuzuhara, M. et al. 2013, ApJ, 774, 11
- Lafrenière et al. (2007) Lafrenière, D., Marois, C., Doyon, R., Nadeau, D., & Artigau, E. 2007, ApJ, 660, 770
- Lafrenière et al. (2010) Lafrenière, D., Jayawardhana, R., & van Kerkwijk, M. 2010, ApJ, 719, 497
- Lagrange et al. (2010) Lagrange, A.-M., et al. 2010, Science, 329, 57
- Lee et al. (2013) Lee, J.-M., Heng, K., & Irwin, P.G.J. 2013, ApJ, accepted, arXiv:1307.1404
- Leggett et al. (2000) Leggett, S.K., Geballe, T.R., Fan, X. et al. 2000, ApJ, 536, L35
- Lodders & Fegley (2002) Lodders, K. & Fegley, B. 2002, Icarus, 155, 393
- Macintosh et al. (2008) Macintosh, B. et al. 2008, Proc. SPIE, 7015, 43
- Mandell et al. (2011) Mandell, A., Drake, D.L., Blake, G.A., Knutson, H.A., Mumma, M.J., Villanueva, G.L., & Salyk, C. 2011, ApJ, 728, 18
- Marley et al. (2012) Marley, M.S., Saumon, D., Cushing, M., Ackerman, A.S., Fortney, J.J., & Freedman, R. 2012, ApJ, 754, 135
- Marois et al. (2006) Marois, C., Lafrenière, D., Doyon, R, Macintosh, B., & Nadeau, D. 2006, ApJ, 641, 556
- Marois et al. (2008) Marois, C., Macintosh, B., Barman, T., Zuckerman, B., Song, I., Patience, J., Lafrenière, D., & Doyon, R 2008, Science, 322, 1348
- Marois et al. (2010) Marois, C., Zuckerman, B., Konopacky, Q., Macintosh, B., Barman, T. 2010, Nature, 468, 1080
- McLean et al. (2003) McLean, I.S., McGovern, M.R., Burgasser, A.J., Kirkpatrick, J.D., & Kim, S.S. 2003, ApJ, 596, 561
- Metchev & Hillenbrand (2006) Metchev, S.A. & Hillenbrand, L.A. 2006, ApJ, 651, 1166
- Morley et al. (2012) Morley, C.V., Fortney, J.J., Marley, M.R., Vissher, C., Saumon, D., & Leggett, S.K. 2012, ApJ, 756, 172
- Peters et al. (2012) Peters, M.A. et al. 2012, Proc. SPIE, 8446, 7
- Skemer et al. (2012) Skemer, A.J. et al. 2012, ApJ, 753, 14
- Spiegel & Burrows (2012) Spiegel, D.S. & Burrows, A. 2012, ApJ, 745, 174
- Stevenson et al. (2013) Stevenson, K., Bean, J.L., Seifahrt, A., Desert, J.-M., Madhusudhan, N., Bergmann, M., Kreidberg, L., & Homeier, D. 2013, ApJ, submitted, arXiv:1305.1670
- Suzuki et al. (2010) Suzuki, R. et al. 2010, Proc. SPIE, 7735, 101
- Swain et al. (2008) Swain, M.R., Vasisht, G., & Tinetti, G. 2008, Nature, 452, 329
- Tamura (2009) Tamura, M. 2009, in AIP Conf. Ser. 1158, Exoplanets and Disks: Their Formation and Diversity, ed. T. Usuda, M. Tamura, & M. Ishii (Melville, NY: AIP), 11
- Thalmann et al. (2009) Thalmann, C., et al. 2009, ApJ, 707, L123
- Thalmann et al. (2011) Thalmann, C., et al. 2011, ApJ, 743, L6
- Tokunaga et al. (1998) Tokunaga, A.T. et al. 1998, Proc. SPIE, 3354, 512
- van Leeuwen (2007) van Leeuwen, F. 2007, A&A, 474, 653