The suppression of star formation by powerful active galactic nuclei
M.J. Page,1 M. Symeonidis,1 J.D. Vieira,2 B. Altieri,3 A. Amblard,4 V. Arumugam,5 H. Aussel,6 T. Babbedge,7 A. Blain,8 J. Bock,2,9 A. Boselli,10 V. Buat,10 N. Castro-Rodríguez,11,12 A. Cava,13 P. Chanial,6 D.L. Clements,7 A. Conley,14 L. Conversi,3 A. Cooray,15,2 C.D. Dowell,2,9 E.N. Dubois,16 J.S. Dunlop,5 E. Dwek,17 S. Dye,18 S. Eales,19 D. Elbaz,6 D. Farrah,16 M. Fox,7 A. Franceschini,20 W. Gear,19 J. Glenn,21,14 M. Griffin,19 M. Halpern,22 E. Hatziminaoglou,23 E. Ibar,24 K. Isaak,25 R.J. Ivison,24,5 G. Lagache,26 L. Levenson,2,9 N. Lu,2,27 S. Madden,6 B. Maffei,28 G. Mainetti,20 L. Marchetti,20 H.T. Nguyen,9,2 B. O’Halloran,7 S.J. Oliver,16 A. Omont,29 P. Panuzzo,6 A. Papageorgiou,19 C.P. Pearson,30,31 I. Pérez-Fournon,11,12 M. Pohlen,19 J.I. Rawlings,1 D. Rigopoulou,30,32 L. Riguccini,6 D. Rizzo,7 G. Rodighiero,20 I.G. Roseboom,16,5 M. Rowan-Robinson,7 M. Sánchez Portal,3 B. Schulz,2,27 Douglas Scott,22 N. Seymour,33,1 D.L. Shupe,2,27 A.J. Smith,16 J.A. Stevens,34 M. Trichas,35 K.E. Tugwell,1 M. Vaccari,20 I. Valtchanov,3 M. Viero,2 L. Vigroux,29 L. Wang,16 R. Ward,16 G. Wright,24 C.K. Xu2,27 and M. Zemcov2,9
1Mullard Space Science Laboratory, University College London, Holmbury St. Mary, Dorking, Surrey RH5 6NT, UK
2California Institute of Technology, 1200 E. California Blvd., Pasadena, CA 91125, USA
3Herschel Science Centre, European Space Astronomy Centre, Villanueva de la Cañada, 28691 Madrid, Spain
4NASA, Ames Research Center, Moffett Field, CA 94035, USA
5Institute for Astronomy, University of Edinburgh, Royal Observatory, Blackford Hill, Edinburgh EH9 3HJ, UK
6Laboratoire AIM-Paris-Saclay, CEA/DSM/Irfu - CNRS - Universit’e Paris Diderot, CE-Saclay, pt courrier 131, F-91191 Gif-sur-Yvette, France
7Astrophysics Group, Imperial College London, Blackett Laboratory, Prince Consort Road, London SW7 2AZ, UK
8Department of Physics & Astronomy, University of Leicester, University Road, Leicester LE1 7RH, UK
9Jet Propulsion Laboratory, 4800 Oak Grove Drive, Pasadena, CA 91109, USA
10Laboratoire d’Astrophysique de Marseille, OAMP, Universit’e Aix-marseille, CNRS, 38 rue Fr’ed’eric Joliot-Curie, 13388 Marseille cedex 13, France
11Instituto de Astrof’ısica de Canarias (IAC), E-38200 La Laguna, Tenerife, Spain
12Departamento de Astrof’ısica, Universidad de La Laguna (ULL), E-38205 La Laguna, Tenerife, Spain
13Departamento de Astrof’isica, Facultad de CC. F’isicas, Universidad Complutense de Madrid, E-28040 Madrid, Spain
14Center for Astrophysics and Space Astronomy 389-UCB, University of Colorado, Boulder, CO 80309, USA
15Dept. of Physics & Astronomy, University of California, Irvine, CA 92697, USA
16Astronomy Centre, Dept. of Physics & Astronomy, University of Sussex, Brighton BN1 9QH, UK
17Observational Cosmology Lab, Code 665, NASA Goddard Space Flight Center, Greenbelt, MD 20771, USA
18School of Physics and Astronomy, University of Nottingham, NG7 2RD, UK
19School of Physics and Astronomy, Cardiff University, Queens Buildings, The Parade, Cardiff CF24 3AA, UK
20Dipartimento di Astronomia, Università di Padova, vicolo Osservatorio, 3, 35122 Padova, Italy
21Dept. of Astrophysical and Planetary Sciences, CASA 389-UCB, University of Colorado, Boulder, CO 80309, USA
22Department of Physics & Astronomy, University of British Columbia, 6224 Agricultural Road, Vancouver, BC V6T 1Z1, Canada
23ESO, Karl-Schwarzschild-Str. 2, 85748 Garching bei M”unchen, Germany
24UK Astronomy Technology Centre, Royal Observatory, Blackford Hill, Edinburgh EH9 3HJ, UK
25European Space Research and Technology Centre (ESTEC), Keplerlaan 1, 2201 AZ, Noordwijk, The Netherlands
26Institut d’Astrophysique Spatiale (IAS), bâtiment 121, Universit’e Paris-Sud 11 and CNRS (UMR 8617), 91405 Orsay, France
27Infrared Processing and Analysis Center, MS 100-22, California Institute of Technology, JPL, Pasadena, CA 91125, USA
28School of Physics and Astronomy, The University of Manchester, Alan Turing Building, Oxford Road, Manchester M13 9PL, UK
29Institut d’Astrophysique de Paris, UMR 7095, CNRS, UPMC Univ. Paris 06, 98bis boulevard Arago, F-75014 Paris, France
30RAL Space, Rutherford Appleton Laboratory, Chilton, Didcot, Oxfordshire OX11 0QX, UK
31Institute for Space Imaging Science, University of Lethbridge, Lethbridge, Alberta, T1K 3M4, Canada
32Department of Astrophysics, Denys Wilkinson Building, University of Oxford, Keble Road, Oxford OX1 3RH, UK
33CSIRO Astronomy & Space Science, PO Box 76, Epping, NSW 1710, Australia
34Centre for Astrophysics Research, University of Hertfordshire, College Lane, Hatfield, Hertfordshire AL10 9AB, UK
35Harvard-Smithsonian Center for Astrophysics, 60 Garden Street, Cambridge, MA 02138, USA
The old, red stars which constitute the bulges of galaxies, and the massive black holes at their centres, are the relics of a period in cosmic history when galaxies formed stars at remarkable rates and active galactic nuclei (AGN) shone brightly from accretion onto black holes. It is widely suspected, but unproven, that the tight correlation in mass of the black hole and stellar components1 results from the AGN quenching the surrounding star formation as it approaches its peak luminosity2; 3; 4. X-rays trace emission from AGN unambiguously5, while powerful star-forming galaxies are usually dust-obscured and are brightest at infrared-submillimetre wavelengths6. Here we report observations in the submillimetre and X-ray which show that rapid star formation was common in the host galaxies of AGN when the Universe was 2–6 Gyrs old, but that the most vigorous star formation is not observed around black holes above an X-ray luminosity of erg s-1. This suppression of star formation in the host galaxies of powerful AGN is a key prediction of models in which the AGN drives a powerful outflow7; 8; 9, expelling the interstellar medium of its host galaxy and transforming the galaxy’s properties in a brief period of cosmic time.
Measuring star formation in galaxies containing powerful active galactic nuclei has long been a problem, because the radiation from the AGN outshines that from star formation in almost all wavebands. Of all parts of the electromagnetic spectrum, the far-infrared to millimetre waveband offers the best opportunity to measure star formation in galaxies hosting AGN because, in contrast to strongly star-forming galaxies, AGN emit comparatively little radiation at these wavelengths10. The combination of deep X-ray and submillimetre observations therefore offers the best prospects for studying the association of star formation and accretion during the epoch when star formation and black hole growth in massive galaxies were at their most vigorous.
The X-ray catalogue of the Chandra Deep Field North (hereafter CDF-N) derives from a series of observations made with the Chandra X-ray observatory with a total of 2Ms exposure time11. We restrict the sample to those sources detected in the most penetrating 2–8 keV band to minimize the influence of obscuration on our results, and we further limit the sample to those sources (64%) for which spectroscopic redshifts are available in the literature12; 13. 2–8 keV luminosities were calculated assuming that AGN X-ray spectra are power laws of the form14 ; the luminosities are not corrected for absorption intrinsic to the AGN or their host galaxies. In order to restrict the X-ray sample to AGN we have discarded any sources with 2–8 keV luminosity erg s-1. SPIRE15 observations of the CDF-N were carried out in October 2009 as part of the HerMES programme16. Maps and source catalogues at 250, 350 and 500 m were constructed17. At the depth of the SPIRE maps, the dominant source of uncertainty in the maps is confusion noise due to the high sky density of sources. For cross-matching with the Chandra source catalogue11 we chose the 250 m catalogue, which has the most precise positions, and we used only sources with 250 m flux densities 18 mJy, which corresponds to a signal/noise ratio 3 when the effects of confusion are included17. X-ray sources were matched to 250 m sources within 6 arcseconds, corresponding to approximately 95% confidence in the 250 m positions. The detection statistics are given in Table 1. The expected level of spurious associations between X-ray and 250 m sources was calculated from the sky density of 250 m sources in 10 to 30 arcsecond-radius annular regions around the X-ray source positions, and is reported in Table 1.
| Region of (z,L) parameter space | Number | Number of AGN | Expected number of | Fraction of AGN |
|---|---|---|---|---|
| of AGN | associated with | spurious associations | associated with | |
| 250 m sources | 250 m sources | |||
| all , erg s-1 | 176 | 24 | 2.1 | 143 () % |
| , erg s-1 | 44 | 11 | 0.5 | 25 () % |
| , erg s-1 | 21 | 0 | 0.2 | () % |
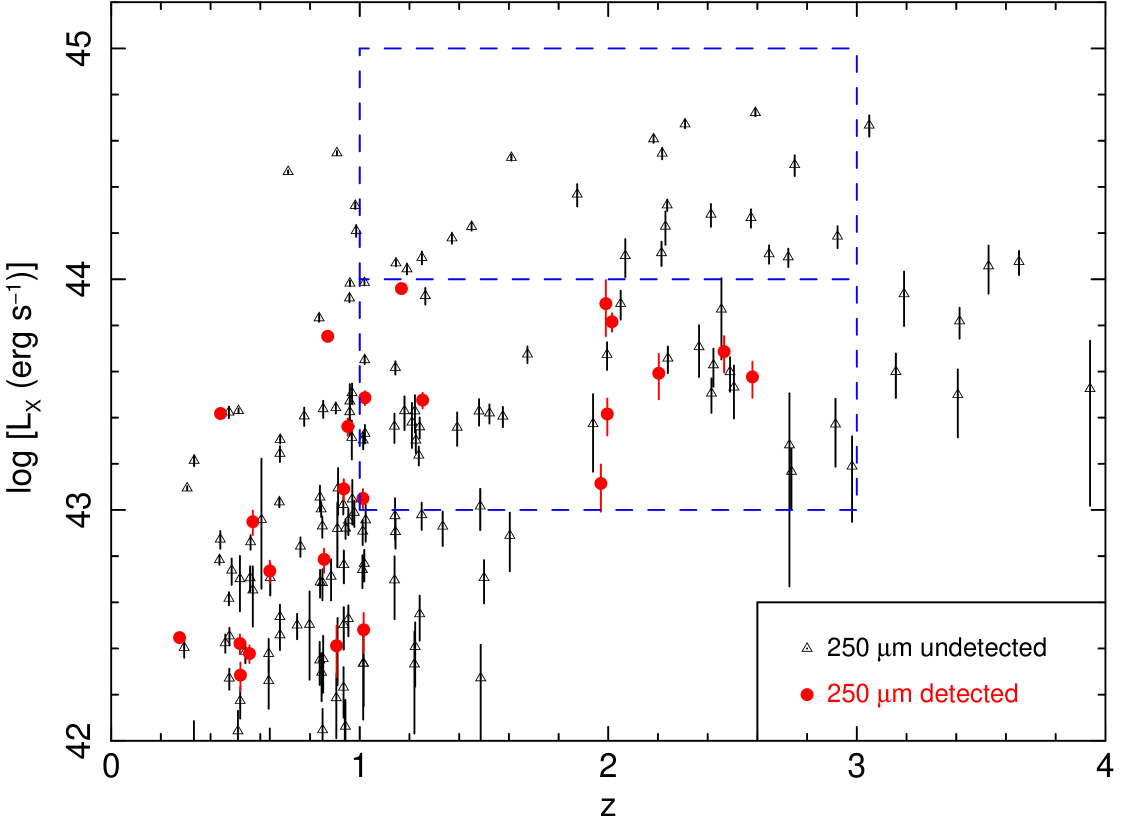
The distribution of CDF-N AGN in the redshift - luminosity plane is shown in Figure 1, and shows a striking trend of 250 m detectability with X-ray luminosity: of the 24 AGN detected at 250 m, none of them have erg s-1. The redshift range between 1 and 3 is of most interest, because it corresponds to the epoch in which powerful AGN accreted most of their black hole mass and present-day massive galaxies formed most of their stars. Within this redshift range, Fig. 1 shows that 11 out of 44 AGN (%) with erg s erg s-1 are detected at 250 m, while none of the 21 objects with erg s-1 are detected. The difference in detection rates has a significance of according to a single-tail Fisher’s exact test. We have considered the effects that incompleteness in the spectroscopic redshifts, or absorption of the X-ray flux by gas and dust, might have on our results. We find that the systematic non-detection of the powerful AGN is robust against both effects, although X-ray absorption does appear to be a common property of the 250 m-detected AGN. We have also verified the low 250 m detection rate of AGN with erg s-1 using the Extended Chandra Deep Field South field, finding that of 49 such sources with , only 1 is detected at 250 m.
| ID | Redshift | Log (erg s-1) | Log (cm-2) | corr | Log (L⊙) | AGN (%) | SFR (M⊙ yr-1) |
|---|---|---|---|---|---|---|---|
| 35 | 2.203 | 43.59 | 12 | 750 – 850 | |||
| 109 | 2.580 | 43.58 | 5 | 1660 – 1750 | |||
| 135 | 2.466 | 43.69 | 4 | 1060 – 1110 | |||
| 158 | 1.013 | 43.05 | 4 | 320 – 330 | |||
| 190 | 2.015 | 43.81 | 21 | 1030 – 1300 | |||
| 331 | 1.253 | 43.48 | — | — | 5 | 530 – 550 | |
| 366 | 1.970 | 43.11 | 3 | 1140 – 1170 | |||
| 368 | 1.996 | 43.42 | 3 | 420 – 430 | |||
| 384 | 1.021 | 43.49 | 11 | 50 – 60 | |||
| 455 | 1.168 | 43.96 | — | — | 30 | 110 – 160 | |
| 500 | 1.990 | 43.89 | 4 | 690 – 710 |
Infrared spectral energy distributions for the 250 m-detected AGN were constructed by combining the SPIRE photometry with Spitzer 3.6 – 160 m photometry. X-ray and infrared properties of the 11 250 m-detected AGN with and in the range erg s-1 are given in Table 2. In most cases the AGN contributes less than 10% to the infrared luminosity. The best-fit infrared luminosities lie between and L⊙, implying star formation rates between 50 and 1750 M⊙ per year18.
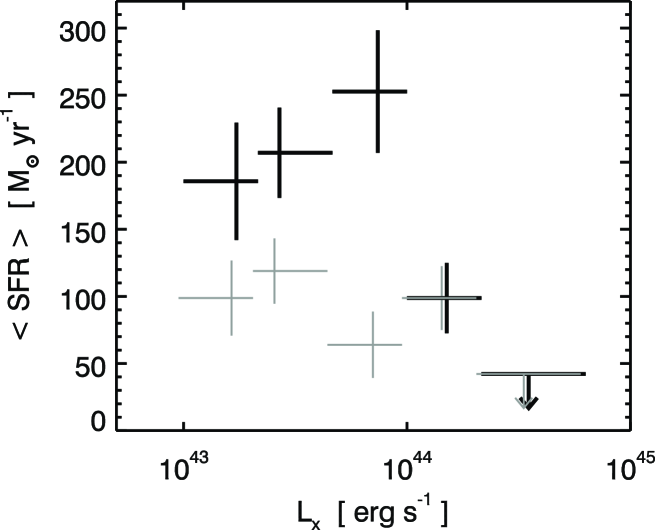
We performed a stacking analysis for the AGN to probe below the confusion limit of the SPIRE images. We split the sample into five bins of from to erg s-1 and determined the average star formation rates of AGN in each bin. The results are shown in Figure 2. In the redshift range , the mean star formation rate in AGN with of erg s-1 is 214 M⊙ per year, compared to a mean star formation rate for AGN with erg s-1 of 65 M⊙ per year. These averages are independent of the SPIRE 250 m detection limit because they are obtained from a stack of all sources within a given range of , whether detected at 250 m or not.
At redshifts of 1–3, the X-ray luminosity of 1044 erg s-1, which divides the regions of 250 m detection and non-detection in Fig. 1, corresponds approximately to the knee in the luminosity function of AGN19. The steep shape of the luminosity function at erg s-1 implies that this part of the luminosity function is dominated by objects which are at the peak of their accretion rates. Our observations therefore imply that the most prodigious episodes of star formation are common in the host galaxies of AGN, but avoid powerful AGN in which accretion is at its peak.
This systematic non-coincidence of the peak periods of star formation and accretion implies a palpable interaction between the two processes, and provides a powerful discriminator for the form of AGN feedback which is responsible for terminating star formation in the host galaxy. Two families of feedback models have been proposed, widely referred to as ‘quasar mode’ and ‘radio mode’20. In quasar-mode feedback, a luminous AGN generates a powerful wind which terminates star formation by driving the interstellar medium from the surrounding host galaxy. In radio-mode feedback, star formation is suppressed because collimated jets of relativistic particles emitted by a radiatively-inefficient AGN prevent gas in the surrounding hot halo from cooling, thereby starving the galaxy of cool gas from which to form stars.
Radio-mode feedback is commonly invoked in semi-analytical models to limit galaxy masses and luminosities21; 20. In these models, black holes grow through luminous accretion episodes and black hole mergers. The correlation between black hole and bulge mass comes from assuming that a fixed fraction of the gas is accreted by the nucleus during each star forming episode that results from a galaxy merger or disc instability, and hence star formation and accretion rate should be correlated over the full range of luminosity. Our observations are therefore inconsistent with models in which AGN influence their host galaxies only through radio mode feedback21; 20. In contrast, models of galaxy formation in which quasar-mode feedback is responsible for terminating the star formation22; 8; 7; 9, and which have received some observational support recently23; 24, predict that the AGN luminosity peaks later than the star formation rate, and thus are consistent with our observations. These models also predict that residual star formation, at the level of a few tens of per cent of the peak, will continue during the period in which the AGN luminosity is at its maximum, consistent with our stacked results which show that on average AGN with erg s-1 are still forming stars at approximately 65 M⊙ per year. Our observations do not discriminate between models invoking major mergers8 or accretion of gas into a massive halo22 as the trigger for the intense star formation. After the interstellar medium has been driven out by the luminous AGN and the AGN itself becomes starved of fuel, radio-mode feedback is the most credible agent by which further star formation is inhibited.
References
- 1 Häring & Rix, On the Black Hole Mass-Bulge Mass Relation. Astrophys. J., 604, L89-L92 (2004)
- 2 Silk J. & Rees M.J., Quasars and galaxy formation. Astron. Astrophys., 331, L1-L4 (1998)
- 3 Fabian, A.C., The obscured growth of massive black holes. Mon. Not. R. Astron. Soc., 308, L39-L43 (1999)
- 4 King, A.R., Black hole outflows. Mon. Not. R. Astron. Soc., 402, 1516-1522 (2010)
- 5 Brandt W.N. & Hasinger G., Deep Extragalactic X-Ray Surveys. Annu. Rev. Astron. Astrophys., 43, 827-859 (2005)
- 6 Sanders D.B. & Mirabel I.F., Luminous Infrared Galaxies. Annu. Rev. Astron. Astrophys., 34, 749-792 (1996)
- 7 Di Matteo T., Springel V. & Hernquist L., Energy input from quasars regulates the growth and activity of black holes and their host galaxies. Nature, 433, 604-607 (2005)
- 8 Springel V., Di Matteo T., & Hernquist L., Modelling feedback from stars and black holes in galaxy mergers. Mon. Not. R. Astron. Soc., 361, 776-794 (2005)
- 9 Sijacki D., Springel V., Di Matteo T., Herhquist L., A unified model for AGN feedback in cosmological simulations of structure formation. Mon. Not. R. Astron. Soc., 380, 877-900 (2007)
- 10 Hatziminaoglou, E., et al., HerMES: Far infrared properties of known AGN in the HerMES fields. Astron. Astrophys., 518, L33 (2010)
- 11 Alexander D.M., Bauer F.E., Brandt W.N., et al., The Chandra Deep Field North Survey. XIII. 2 Ms Point-Source Catalogs. Astron. J., 126, 539-574 (2003)
- 12 Trouille L., Barger A.J., Cowie L.L., Yang Y., Mushotzky R.F., The OPTX Project. I. The Flux and Redshift Catalogs for the CLANS, CLASXS, and CDF-N Fields. Astrophys. J. Suppl., 179: 1-18 (2008)
- 13 Barger A.J., et al., A Highly Complete Spectroscopic Survey of the GOODS-N Field. Astrophys. J., 689, 687-708 (2008)
- 14 Mateos S., Barcons X., Carrera F.J., Ceballos M.T., Hasinger G., Lehmann I., Fabian A.C., Streblyanska A., XMM-Newton observations of the Lockman Hole IV: spectra of the brightest AGN. Astron. Astrophys., 444, 79-99 (2005)
- 15 Griffin M.J., et al., The Herschel-SPIRE instrument and its in-flight performance. Astron. Astrophys., 518, L3 (2010)
- 16 Oliver, S.J., et al., HerMES: SPIRE galaxy number counts at 250, 350, and 500 m. Astron. Astrophys., 518, L21 (2010)
- 17 Smith A.J., et al., HerMES: point source catalogues from deep Herschel-SPIRE observations. Mon. Not. R. Astron. Soc., 419, 377-389 (2012)
- 18 Kennicutt, R.C., The global Schmidt law in star-forming Galaxies. Astrophys. J., 498, 541-552 (1998)
- 19 Ebrero J., et al., The XMM-Newton serendipitous survey. VI. The X-ray luminosity function. Astron. Astrophys., 493, 55-69 (2009)
- 20 Croton D.J., et al., The many lives of active galactic nuclei: cooling flows, black holes and the luminosities and colours of galaxies. Mon. Not. R. Astron. Soc., 365, 11-28 (2006)
- 21 Bower R. G., et al., Breaking the hierarchy of galaxy formation. Mon. Not. R. Astron. Soc., 370, 645-655 (2006)
- 22 Granato G.L., et al., A physical model for the coevolution of QSOs and their spheroidal hosts. Astrophys. J., 600, 580-594 (2004)
- 23 Farrah D., et al., Direct evidence for termination of obscured star formation by radiatively driven outflows in reddened QSOs. Astrophys. J., 745, 178 (2012)
- 24 Cano-Díaz M., Maiolino R., Marconi A., Netzer H., Shemmer O., Cresci G., Observational evidence of quasar feedback quenching star formation at high redshift. Astron. Astrophys., 537, L8 (2012)
- 25 Roseboom I.G., et al., The Herschel Multi-Tiered Extragalactic Survey: source extraction and cross-identifications in confusion-dominated SPIRE images. Mon. Not. R. Astron. Soc., 409, 48-65 (2010)
- 26 Siebenmorgen R. & Krug̈el E., Dust in starburst nuclei and ULIRGs. SED models for observers. Astron. Astrophys., 461, 445-453 (2007)
- 27 Symeonidis M., et al., The link between SCUBA and Spitzer: cold galaxies at z 1. Mon. Not. R. Astron. Soc., 397, 1728-1738 (2009)
- 28 Seymour, N., et al., HerMES: SPIRE emission from radio-selected active galactic nuclei. Mon. Not. R. Astron. Soc., 413, 1777-1786 (2011)
- 29 Blain, A.W., Barnard V.E. & Chapman S.C., Submillimetre and far-infrared spectral energy distributions of galaxies: the luminosity-temperature relation and consequences for photometric redshifts. Mon. Not. R. Astron. Soc., 338, 733-744 (2003)
Supplementary Information is linked to the online version of
the paper at www.nature.com/nature
Acknowledgments
SPIRE has been developed by a consortium of institutes led
by Cardiff Univ. (UK) and including Univ. Lethbridge (Canada);
NAOC (China); CEA, LAM (France); IFSI, Univ. Padua (Italy);
IAC (Spain); Stockholm Observatory (Sweden); Imperial College
London, RAL, UCL-MSSL, UKATC, Univ. Sussex (UK); Caltech,
JPL, NHSC, Univ. Colorado (USA). This development has been
supported by national funding agencies: CSA (Canada); NAOC
(China); CEA, CNES, CNRS (France); ASI (Italy); MCINN (Spain);
SNSB (Sweden); STFC, UKSA (UK); and NASA (USA).
Author Contributions
This paper represents the combined work of the HerMES collaboration,
the SPIRE Instrument Team’s extragalactic survey.
M. Page planned the study, and wrote
the draft version of the paper. M. Symeonidis fitted models to the
spectral energy distributions of the sources and J.D. Vieira performed
the stacking analysis. All other coauthors of this paper contributed
extensively and equally by their varied contributions to the SPIRE
instrument, Herschel mission, analysis of SPIRE and HerMES data,
planning of HerMES observations and scientific support of HerMES, and
by commenting on this manuscript as part of an internal review
process.
Author Information Reprints and permissions information is available at www.nature.com/reprints. The authors declare that they have no competing financial interests. Correspondence and requests for materials should be addressed to M.Page (mjp@mssl.ucl.ac.uk).
Supplementary Information
Spectroscopic redshifts of CDF-N X-ray sources
We have taken a recent compilation13 as our main source of spectroscopic redshifts. These redshifts are given to two decimal places, but the majority of them originate from earlier studies, so we have in most cases obtained more precise redshifts by tracing them back to the original publications. Where there is a significant discrepancy (%) between a spectroscopic redshift in our main source and that given in earlier literature, we have adopted the redshift from our main source13. We have utilised a number of spectroscopic redshifts which are not listed there. The redshifts and literature references for these cases are given in Table S1.
Effect of redshift incompleteness
While we have restricted our study to objects within the CDF-N which have optical spectroscopic identifications and redshifts to ensure fidelity in redshifts and luminosities, we must examine whether the limited spectroscopic completeness (64%) has any effect on our results. A large fraction of the X-ray sources within the CDF-N have photometric redshifts (i.e. redshifts estimated by comparing photometry in a number of bands to that expected from galaxy template spectra as a function of redshift) in the same compilation that we use for our spectroscopic redshifts13. Although these photometric redshifts are of low accuracy and reliability compared to the spectroscopic redshifts, they raise the redshift completeness of the 2–8 keV X-ray sources to 87%, and so offer a good test as to whether the spectroscopic completeness has a significant influence on our results. Table S2 gives statistics equivalent to those shown in Table 1 of the main paper, but with the photometric redshifts included. As found for the spectroscopic-only sample, no AGN more luminous than erg s-1 are associated with 250 m sources.
| Source number in X-ray catalogue12 | Spectroscopic redshift | Reference |
| 91 | 0.294 | 1 |
| 121 | 0.520 | 2 |
| 152 | 0.540 | 14 |
| 191 | 0.952 | 14 |
| 196 | 0.680 | 3 |
| 205 | 0.943 | 14 |
| 220 | 4.420 | 4 |
| 223 | 2.724 | 5 |
| 243 | 0.557 | 6 |
| 266 | 1.2258 | 14 |
| 287 | 2.737 | 14 |
| 292 | 0.497 | 7 |
| 317 | 1.760 | 14 |
| 342 | 0.518 | 1 |
| 377 | 3.1569 | 14 |
| 412 | 1.1435 | 14 |
| 423 | 2.365 | 14 |
| 441 | 0.634 | 2 |
| 443 | 0.033 | 1 |
| 470 | 0.231 | 2 |
Table S1: Spectroscopic redshifts which do not come from our main source13 and references to the literature in which these redshifts are published.
We can be further reassured that our main result is not affected by the spectroscopic incompleteness by looking specifically at the identification statistics of those 2–8 keV X-ray sources which are associated with 250 m sources. A total of 33 2–8 keV X-ray sources are associated with 250 m sources, of which 27 are spectroscopically identified. The spectroscopically-identified fraction of these sources is thus 82%, higher than the 2–8 keV source population as a whole. For the 6 sources without spectroscopic redshifts, Fig. S1 shows the tracks of X-ray luminosity as a function of redshift. We can see that with respect to the , erg s-1 erg s-1 region which is well sampled by the X-ray and submillimetre surveys, sources 31, 37 and 431 from the X-ray catalogue12 have erg s-1 for all . The tracks for sources 107, 221 and 406 all cross the upper rectangle corresponding to , erg s-1 erg s-1, and so should be examined in more detail. The track for source 221 only enters this rectangle for a tiny redshift interval (). Although our main redshift compilation13 does not give a photometric redshift for source 221, a photometric redshift of 1.9 is found elsewhere in the literature8, in which case it has erg s-1 in keeping with the other 250 m-detected AGN. Source 107 is within 6 arcsec of the same 250 m source as a brighter X-ray source (source 109), which has a spectroscopic redshift of 2.58. The brighter X-ray source is closer to the 250 m source position than source 107, and source extraction using X-ray and 24 m positions as priors25 does not recover significant 250 m emission for source 107, leaving some doubt about the reality of the association. Source 107 has a photometric redshift of 1.15, but could be physically associated with source 109 at given that they are only separated by 2.7 arcsec. It can be seen from Fig. S1 that whichever of the two redshifts is adopted for source 107, it has between erg s-1 and erg s-1, and hence if the association of source 107 and the 250 m source is real, it too has erg s-1, in keeping with the other 250 m-detected AGN. Finally, we come to source 406, which is the brightest of the six X-ray sources. From the track in Fig. S1, it appears the most likely of the six to be found within the , erg s-1 erg s-1 region of our survey. This source is extremely faint in the optical, with an -band magnitude of 27.8 2, and there are no estimates of photometric redshift available in the literature. The association of this X-ray source with the 250 m source must be regarded with some doubt, however, because it is located just 5.5 arcsec to the south of a brighter 24 m and radio source which is closer to the 250 m position. Source extraction using X-ray and 24 m positions as priors25 detects source 406 only at the 3 level. Nonetheless, this source does represent the single example of an X-ray source, potentially associated with a 250 m source, with a reasonable likelihood of lying within the , erg s-1 region. Equally, it may fall within the , erg s-1 region. To summarise, it appears that the sources without spectroscopic redshifts are likely to harbour at most one object within the redshift range , which has erg s-1.
| Region of (z,L) parameter space | Number | Number of AGN | Expected number of | Fraction of AGN |
|---|---|---|---|---|
| of AGN | associated with | spurious associations | associated with | |
| 250 m sources | 250 m sources | |||
| all , erg s-1 | 248 | 27 | 2.8 | 112 (4) % |
| , erg s-1 | 61 | 12 | 0.7 | 206 () % |
| , erg s-1 | 25 | 0 | 0.3 | () % |
Table S2: 250 m detection statistics in the various parts of parameter space when AGN with photometric redshifts are included as well as those with spectroscopic redshifts. The first row corresponds to the full AGN luminosity and redshift parameter space in the CDF-N, while the second and third rows correspond to the regions enclosed within the blue dashed lines in Fig. 1.
![[Uncaptioned image]](/html/1310.4147/assets/x3.png)
Figure S1: 2–8 keV X-ray luminosities as a function of redshift for 2–8 keV X-ray sources which are associated with 250 m sources and which do not have spectroscopic redshifts. The bold dots indicate photometric redshfits, where available. The blue dashed rectangle delimits the luminosity decades above and below erg s-1 in the redshift range as in Fig. 1. Error bars correspond to 68% confidence.
Effect of X-ray absorption
X-rays in the 2–8 keV band can penetrate considerable column densities of material, but column densities cm-2 can lead to significant attenuation of the X-ray flux. Conceivably, the different 250 m detection rates for AGN above and below erg s-1 could be a consequence of X-ray absorption, if 250 m-luminous AGN are systematically more heavily absorbed than AGN which are not detected at 250 m. X-rays in the 0.5–2 keV band are absorbed more easily than those in the 2–8 keV band which was used to select our X-ray sample, and hence the hardness ratio of 2–8 keV / 0.5–2 keV X-rays is a crude but effective estimator of the degree of X-ray absorption.
![[Uncaptioned image]](/html/1310.4147/assets/x4.png)
Figure S2: 2–8 keV X-ray luminosities as a function of redshift after correction for absorption. AGN with lower-limit hardness ratios have absorption-corrected luminosities with unconstrained upper bounds, and these are shown as upward pointing arrows. The blue dashed rectangle delimits the luminosity decades above and below erg s-1 in the redshift range as in Fig. 1. Error bars correspond to 68% confidence.
For each 2–8 keV X-ray source, we used the Portable Interactive
Multi-Mission Simulator
(PIMMS;
http://heasarc.nasa.gov/docs/software/tools/pimms.html)
to convert from hardness ratios to spectral indices and column
densites. The intrinsic spectra of faint AGN without absorption are
power laws of the form with a mean
, and an rms scatter in of 0.215.
We took a hardness ratio corresponding to
( from the mean) as the threshold beyond which
we considered sources as absorbed. For absorbed sources, we used PIMMS
to estimate the column density, assuming an intrinsic spectral index
. PIMMS was then used to calculate the expected degree of
attenuation to the observed 2–8 keV X-rays from the column density
estimate. The X-ray luminosities were then adjusted accordingly. Where
only a lower limit to the hardness ratio is available (due to the
faintness of the object in the 0.5–2 keV X-ray band), the luminosity
correction corresponding to the lower limit is
applied.
Fig. S2 shows how Fig. 1 would be affected by the absorption corrections. More than half of the 250 m-detected AGN increase in luminosity when the absorption corrections are applied, but on the whole these corrections are quite modest, with the majority amounting to less than 40% change in luminosity. None of the 250 m-detected AGN move into the , erg s-1 erg s-1 region. Although several of the 250 m-detected AGN move close to the erg s-1 boundary, and the absorption corrections for two of the 250 m-detected AGN are lower limits such that they may have intrinsic luminosities erg s-1, the essential characteristic of Fig. 1, the low 250 m detection rate above erg s-1, persists.
The fraction of absorbed AGN is known to depend on luminosity9 such that absorption is less common in the most luminous AGN. In light of this interdependency between luminosity and absorption, we have also examined the 250 m detection rate of AGN with and erg s-1 erg s-1 as a function of X-ray absorption rather than X-ray luminosity. Dividing the sample into absorbed and unabsorbed sources using the hardness-ratio criterion given above, we have 9 absorbed and 2 unabsorbed AGN detected at 250 m, and 27 each of absorbed and unabsorbed sources which are not detected at 250 m. Applying a Fisher’s exact test, we find that the difference in 250 m detection rate between absorbed and unabsorbed sources is significant at a little less than 95%. We can reduce the influence of the intrinsic anti-correlation between absorption and luminosity within the sample under test by excluding the sources with X-ray luminosities above erg s-1. We then have 9 absorbed and 2 unabsorbed sources detected at 250 m, with 19 absorbed and 14 unabsorbed sources undetected at 250 m. Applying the Fisher’s test, the statistical significance at which the 250 m detection rate depends on X-ray absorption drops to 90%. Hence, whereas we can demonstrate that the 250 m detection rate depends on X-ray luminosity, we can not state with such confidence that the 250 m detection rate depends on X-ray absorption.
![[Uncaptioned image]](/html/1310.4147/assets/x5.png)
Figure S3: 2–8 keV X-ray luminosities as a function of redshift for the ECDF-S field. The blue dashed rectangle delimits the luminosity decades above and below erg s-1 in the redshift range as in Fig. 1. Error bars correspond to 68% confidence.
Verification in the Extended Chandra Deep Field South
We have verified that the main result of this work, the paucity of 250 m-detections amongst X-ray-luminous AGN, is reproduced in the Extended Chandra Deep Field South (ECDF-S), which is a larger field than the CDF-N, containing a larger sample of AGN with erg s-1. We used the published X-ray catalogue10 and spectroscopic redshifts11. The SPIRE observations of the ECDF-S are shallower than those of CDF-N, but nonetheless are limited primarily by confusion. As with CDF-N, we have adopted a detection threshold of 18 mJy at 250 m, and cross-correlated the X-ray and submillimetre catalogues with a matching radius of 6 arcseconds. The 250 m detections in the ECDF-S plane are shown in Figure S3, analogous to Fig. 1 of the main article. Of 49 sources with and erg s-1, only 1 is detected at 250 m, confirming the low detection rate obtained in the CDF-N.
![[Uncaptioned image]](/html/1310.4147/assets/x6.png)
Figure S4: Infrared spectral energy distributions of 250 m-detected AGN with and erg s erg s-1, based on SPIRE and Spitzer data. We included 850 m and 1.3 mm photometry from ground-based telescopes where available12; 13. The black datapoints are the measured photometry, and the red lines show the star-forming model templates26 which best fit the data at 24 m and longward. The black lines show AGN templates14, normalised in the mid-IR to estimate the AGN contribution28. Each panel is labelled with the identity of the object in the X-ray catalogue12.
Infrared spectral energy distributions of 250 m-detected AGN
The spectral energy distributions and best fit models for the AGN associated with 250 m sources with and erg s erg s-1, are shown in Fig. S4
Obtaining the average star formation rates through stacking
The average star formation rates shown in Fig. 2 were obtained by averaging the far-infrared luminosities of the AGN to account for the different redshifts of the different AGN. It is more common in stacking analyses to average the fluxes of the objects, and then to use the average flux and the median redshift of the sample to infer an average luminosity. Here we examine how the results would change if we used this latter method rather than stacking directly in luminosity. Fig. S5 shows the star formation rates obtained by the two different methods. The two methods give consistent results, and in both cases the average star formation rates are significantly higher for AGN with erg s-1 than for AGN with erg s-1. We have also examined how the star formation rates would differ if only one of the SPIRE bands were used, instead of all three, to determine the luminosities. For each of the SPIRE bands, we derived a luminosity for each source by normalising a 30 K grey-body in the rest frame to the SPIRE flux and multiplying by 4, before averaging the luminosities in each bin. The star formation rates so derived from the three SPIRE bands are shown in Fig. S5, and are consistent with each other as well as those shown in Fig. 2.
![[Uncaptioned image]](/html/1310.4147/assets/x7.png)
Figure S5: (a) Stacked 250, 350 and 500 m SPIRE images of AGN in the five luminosity bins used for Fig. 2. The images are arranged in increasing wavelength from left to right and decreasing X-ray luminosity from bottom to top. (b) Star formation rates obtained from the stacked fluxes and median redshifts (grey) compared to the star formation rates obtained from stacking the luminosities as in Fig. 2 (black). The blue, green and red points show the star formation rates obtained in a similar fashion to the black points, but in these cases using only one of the SPIRE bands to determine the luminosities prior to averaging. Blue, green and red correspond to 250, 350 and 500m bands. The points have been offset slightly in the horizontal direction to aid clarity.
References
- 1 Barger A.J., et al., X-Ray, Optical, and Infrared Imaging and Spectral Properties of the 1 Ms Chandra Deep Field North Sources. Astron. J., 124, 1839-1885 (2002)
- 2 Barger A.J., et al., Optical and Infrared Properties of the 2 Ms Chandra Deep Field North X-Ray Sources. Astron. J., 126, 632-665 (2003)
- 3 Cohen J.G., et al., Redshift Clustering in the Hubble Deep Field. Astrophys. J., 471, L5-L9 (1996)
- 4 Waddington I., et al., NICMOS Imaging of the Dusty Microjansky Radio Source VLA J123642+621331 at z=4.424. Astrophys. J., 525, L77-L80 (1999)
- 5 Barger A.J., et al., Supermassive Black Hole Accretion History Inferred from a Large Sample of Chandra Hard X-Ray Sources. Astron. J., 122, 2177-2189 (2001)
- 6 Wirth G.D., et al., The Team Keck Treasury Redshift Survey of the GOODS-North Field. Astron. J., 127, 3121-3136 (2004)
- 7 Cowie L.L., et al., A Large Sample of Spectroscopic Redshifts in the ACS-GOODS Region of the Hubble Deep Field North. Astron. J., 127, 3137-3145 (2004)
- 8 Donley J.L., Rieke G.H., Perez-Gonzalez P.G., Rigby J.R., Alonso-Herrero A., Spitzer Power-Law Active Galactic Nucleus Candidates in the Chandra Deep Field-North. Astrophys. J., 660, 167-190 (2007)
- 9 Della Ceca R., et al., The cosmological properties of AGN in the XMM-Newton Hard Bright Survey. Astron. Astrophys., 487, 119-130 (2008)
- 10 Lehmer B.D., et al., The Extended Chandra Deep Field-South Survey: Chandra Point-Source Catalogs. Astrophys. J. Suppl., 161, 21-40 (2005)
- 11 Silverman J.D., et al., The Extended Chandra Deep Field-South Survey: Optical Spectroscopy of Faint X-ray Sources with the VLT and Keck. Astrophys. J. Suppl., 191, 124-142 (2010)
- 12 Chapman S., Blain A.W., Smail I., Ivison R.J., A redshift survey of the submillimetre galaxy population. Astrophys. J., 622, 772-796 (2005)
- 13 Tacconi L.J., et al., High-resolution millimetre imaging of submillimeter galaxies. Astrophys. J., 640, 228-240
- 14 Elvis M., et al., Atlas of quasar energy distributions. Astrophys. J. Suppl., 95, 1-68 (1994)