Modulation of CMB polarization with a warm rapidly-rotating half-wave plate on the Atacama B-Mode Search (ABS) instrument
Abstract
We evaluate the modulation of Cosmic Microwave Background (CMB) polarization using a rapidly-rotating, half-wave plate (HWP) on the Atacama B-Mode Search (ABS). After demodulating the time-ordered-data (TOD), we find a significant reduction of atmospheric fluctuations. The demodulated TOD is stable on time scales of 500–1000 seconds, corresponding to frequencies of 1–2 mHz. This facilitates recovery of cosmological information at large angular scales, which are typically available only from balloon-borne or satellite experiments. This technique also achieves a sensitive measurement of celestial polarization without differencing the TOD of paired detectors sensitive to two orthogonal linear polarizations. This is the first demonstration of the ability to remove atmospheric contamination at these levels from a ground-based platform using a rapidly-rotating HWP.
I Introduction
Measurements of the Cosmic Microwave Background (CMB) temperature anisotropies provide a particularly clean probe of the universe at the time of decoupling, years after the Big Bang, and have allowed constraints to be placed on cosmological parameters at the 1% level. Hinshaw et al. (2013); Planck Collaboration et al. (2013); Sievers et al. (2013); Keisler et al. (2011) Measurement of CMB polarization at large angular scales also provides information about the very early universe and physics at grand-unified-theory energy scales through its sensitivity to a primordial gravitational-wave background (GWB). Many models of inflation predict that such a GWB should exist, and a GWB would leave a unique odd-parity pattern, termed “B modes,” in the CMB polarization.Seljak and Zaldarriaga (1997); Kamionkowski et al. (1997)
The magnitude of the gravitational-wave B-mode signal is known to be less than 100 nK. Chiang et al. (2010); QUIET Collaboration et al. (2011); Hinshaw et al. (2013); Planck Collaboration et al. (2013) From the ground, this signal must be viewed through an atmosphere of 5–20 K in antenna temperature, which can fluctuate by tens of mK on minute time scales. Lay and Halverson (2000) Rapid signal modulation is a well-known technique first used by Dicke in radio astronomy, Dicke (1946) and CMB polarization experiments have used a number of modulation schemes. Jarosik et al. (2003); Farese et al. (2004); Barkats et al. (2005); QUIET Collaboration et al. (2012); Bersanelli et al. (2010); Stefanescu (2006); O’dell et al. (2003); Leitch et al. (2005); Padin et al. (2002); Chen et al. (2009); Moyerman et al. (2013) Rapid modulation of linear polarization by a half-wave plate (HWP) Jones and Klebe (1988); Platt et al. (1991); Leach et al. (1991); Johnson et al. (2007); Ruhl (2008) is one of the most promising modulation techniques to separate the CMB B-mode signal from the large unpolarized atmosphere for instruments with large optical throughput and large numbers of pixels. Johnson et al. (2007); Reichborn-Kjennerud et al. (2010)
Here we report results from using a HWP on the Atacama B-Mode Search (ABS) instrument to modulate the incident polarization at a rate well above the knee of the atmospheric emission. To the best of our knowledge, ABS is the first experiment to use a rapidly-rotating HWP on a ground-based CMB experiment. Using a demodulation procedure, we find that the polarized signal band is free from atmospheric contamination at the level of 0.1% of that in the raw intensity signal. This allows the noise in the demodulated TOD to integrate down as over the time scales of 1000 seconds and demonstrates the ability of ground-based CMB experiments to recover CMB polarization over large angular scales. In the constant-elevation scans done by ABS, this facilitates recovery of modes perpendicular to the scan direction with wavelengths up to 2–4∘, corresponding to multipoles 40–90, even in the presence of strong atmospheric emission. This multipole range is crucial for cosmology as the inflationary gravitational-wave signal is expected to peak at .
The technique of fast modulation also makes it unnecessary to difference the timestreams of paired detectors sensitive to two orthogonal linear polarizations. Without fast modulation, a ground-based experiment using bolometric polarimeters usually achieves some rejection of atmospheric fluctuations by pair differencing in the analysis pipeline. This differencing requires that both detectors in a pair be functional, with well-understood and stable responsivity ratios, reducing detector array efficiency and overall sensitivity. For ABS, the two detectors in a pair can operate independently.
The paper is organized as follows. Section II provides a brief description of the ABS instrument. Section III describes the modulation signal in the detector timestreams. In Section IV, we review the demodulation technique applied to the data to isolate celestial polarization from the unpolarized background and sources of instrument polarization. Section V evaluates the quality of the demodulated TODs.
II The ABS Instrument
The Atacama B-mode Search (ABS) is a 145 GHz receiver consisting of 240 feedhorn-coupled polarimeters with 480 transition-edge sensors (TESes) that operate at a base temperature of 300 mK. The target bandpass for ABS is 127–160 GHz; however, approximately half of the array has a shifted bandpass attributed to unplanned changes in the index of refraction of the silicon-dioxide microstrip dielectric on the detector wafers. These detectors have a bandpass of 140–170 GHz with a broader cutoff at the high-frequency side, making those detectors more susceptible to contamination from the water line of the atmosphere at 183 GHz.
Cryogenic 60-cm primary and secondary reflectors in a crossed-Dragone configuration couple the focal plane to the sky with 35′ full width half maximum (FWHM) beams and a 22∘ field of view. A 25-cm diameter aperture stop at 4 K terminates beam spill at a stable and cold surface. ABS is located next to the Atacama Cosmology Telescope (ACT)Fowler et al. (2007); Swetz et al. (2011) at an altitude of 5190 m, on Cerro Toco in the Atacama Desert of northern Chile.
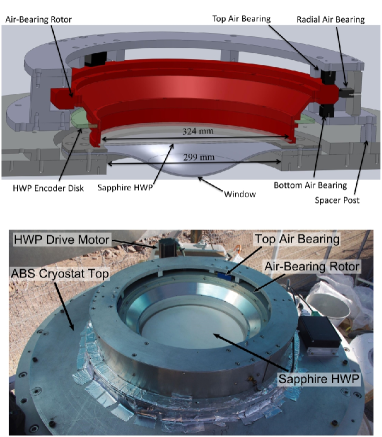
ABS is unique among current and planned CMB polarization experiments in modulating the incoming polarization using an ambient-temperature, continuously-rotating HWP. Note (1); Lau (2007) The HWP is made of single-crystal, -cut sapphire 330 mm in diameter and 3.15 mm thick. It is anti-reflection (AR) coated with 305 m of Rogers RT/Duroid, a glass-reinforced, ceramic-loaded polytetrafluoroethylene (PTFE) laminate with a refractive index of 1.71. The HWP emission is estimated from literature valuesParshin (1994); Note (2) to be 2.3 K and 3.2 K for the extraordinary and ordinary axes, respectively. This level of emission would degrade system sensitivity by approximately 6%. In-field characterization of loading is on-going, with warm optics estimated to add 8 K of loading. This is an upper limit on HWP loading, as we have reason to believe that some excess loading comes from sources other than the HWP, including diffraction onto warm elements or unexpected emission from the HWP anti-reflection coating. We are working to reduce this excess warm loading.
An air-bearing system allows the HWP for ABS to rotate at a stable frequency. Porous graphite padsNote (3) are placed around an aluminum rotor at three points on its circumference. Compressed air is forced through the graphite to float the rotor with almost no friction. An incremental encoder disc with an index to mark the zero point is used to read out the HWP angle with resolution.
The HWP is placed at the entrance aperture of the telescope directly above the vacuum window and is the first optical element in the path of light from the sky to the focal plane, allowing for a clear separation of sky polarization and instrument polarization. The location is also designed to be the beam waist of the ensemble of the detectors so that the detectors share the same HWP surface and some of the systematics originating from the HWP can be removed as a common mode among detectors. Figure 1 shows a drawing of the ABS HWP system and the system in its installed configuration. Further details on the ABS instrument can be found elsewhere Staggs et al. (2008); Essinger-Hileman et al. (2009); Essinger-Hileman (2011); Appel (2012); Visnjic (2013); Simon et al. (2013).
III Modulation by HWP: Signals and Systematics
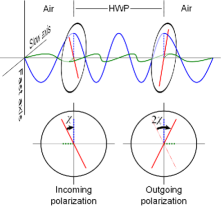
An ideal HWP rotates linear polarization by , where is the angle between the incident polarization angle and the crystal axis of the sapphire (Fig. 2). ABS operates with , where denotes the HWP rotation frequency. This rotates the incident polarization at , which is detected in the bolometers at . The rotational frequency has a small modulation of order (see Fig. 3); however, the treatment in this paper is general and does not assume a constant modulation frequency. With only the sky signal taken into account, the HWP-modulated signal, , may be represented in terms of the incoming Stokes parameters , , and , as well as the angle :
| (1) |
Here, is a polarization modulation efficiency factor, which is close to unity for ABS Visnjic (2013); Essinger-Hileman (2011) and is the modulation function:
| (2) |
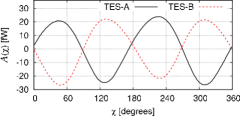
In practice, signals synchronous with the HWP rotation come from a number of sources other than sky polarization. Because the HWP is warm, the dominant HWP-synchronous signal comes from polarized emission due to differential emissivity of the sapphire along different crystal axes, where the difference is roughly 0.3 %.Parshin (1994) Differential transmission produces linear polarization from unpolarized sky emission and is the second most significant HWP-synchronous signal for ABS. Reflections of radiation from the receiver off the HWP and back to the detectors will be polarized in reflection. These effects produce a linear polarization fixed relative to the HWP optical axis that couples to the detectors at . This signal can be modulated up to the signal band by small misalignments of the HWP axis from the air-bearing or encoder axes, as well as non-uniformities in the AR coating. At non-normal incidence, reflection can also produce a small polarization that can be modulated at . These signals form part of the in Eq. 3 below. To the extent that the HWP motion is smooth and the AR coating uniform, these spurious sources of signal are expected to be small. As can be seen in Fig. 4, we find that this is indeed the case in the ABS data, where does not have a significant component.
The signal of interest, CMB polarization, occurs principally at as shown in Eqs. (1) and (2). Any leakage of unpolarized power into the signal band is particularly detrimental because the unpolarized atmospheric signal and temperature anisotropies of the CMB are many orders of magnitude stronger than the signal of interest. Such leakage arises at non-normal incidence, as a small linear polarization is generated upon each reflection in the sapphire and its AR coating, which is then rotated by the sapphire.

Given the 22∘ field of view of ABS, leakage from off-axis incidence must be evaluated. A transfer-matrix model that relates total electric and magnetic fields at the material boundaries was developed Bryan et al. (2010); Essinger-Hileman (2013) to estimate possible leakage from the HWP. The model estimates the leakage to be less than dB. The low knee in the demodulated data, see Section V, is demonstration that this leakage is small, consistent with model expectations.
Including these spurious modulation signals as , as well as white noise in the measurement, , Eq. (1) may be rewritten as
| (3) |
We identify two contributions to :
| (4) |
where is a component that is independent of sky intensity (e.g., the differential emissivity of the HWP) and the second term corresponds to the contribution of unpolarized sky signal to the HWP synchronous signal. For later convenience, we decompose and as
| (5) |
Fourier coefficients and correspond to a modulation in and thus the leakage. The functional shape of is predominantly constant in time since tends to be stable, is small, and the fluctuation of is small compared to the absolute value of . Figure 4 shows an example of the constant components for the two orthogonal detectors in an ABS polarimetric detector.
Variation of the function over long time scales occurs due to fluctuations in unpolarized atmospheric emission as well as the time variation of caused by temperature drifts of the HWP or changes in detector responsivity. Such a variation of leads to low frequency, so-called “,” noise in the demodulated timestream.
IV Demodulation Technique
We will now use a demodulation technique to demonstrate the stability of the ABS instrument in polarization, as well as the low leakage of unpolarized atmospheric intensity into the demodulated timestreams. The (unfiltered) complex demodulated timestream is created by multiplying the modulated data [Eq. (3)] by the complex conjugate of , the modulation function:
| (6) |
where the complex coefficients and are linear combinations of and , and and are the real and imaginary parts of , respectively. Under our assumption of white noise for , and are also white noise and their noise power satisfy:
| (7) |
Applying a lowpass filter to eliminates the terms that still depend on and as well as all terms other than the component; this leads to the final demodulated timestream, denoted :
| (8) |
For ABS’s half-degree beam size and its scan speeds (– on the sky), most of the and signals from the CMB in the demodulated time stream are in the frequency range of Hz and the passband of the lowpass filter is set to Hz. The procedure is shown in Fig. 5. Although it is not mentioned above, we apply a bandpass filter to before multiplying it by as indicated in the figure. Note that in the ideal case of constant , this filter is obviated by the lowpass filter on . However, since for ABS varies slightly as shown in Fig. 3, the bandpass filter effectively suppresses contamination that is localized in the frequency domain of (e.g., electric or magnetic pickup at certain frequency or the atmospheric noise). Without the bandpass filter, the variation of smears this contamination in the frequency space of .
In Eq. (8), the real and imaginary parts of correspond to and polarizations with spurious components and noise. Time variations of and lead to long time-scale fluctuation, or noise, in the measurement. However, since we measure and simultaneously, there is no loss in sensitivity due to the HWP modulation. The sensitivity to the polarized component is the same as to the total intensity. We note that at no point in the analysis do we take the difference between the pair of orthogonally oriented detectors.

V Quality of Demodulated Timestream
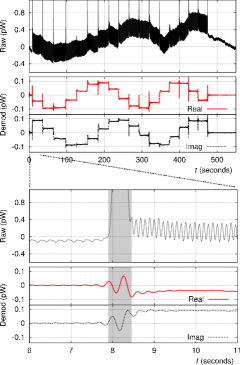
We now investigate the quality of the demodulated timestreams during select calibration runs and normal CMB observations. Figure 6 shows the raw and demodulated timestreams of a calibration session using a sparse wiregrid similar to that developed for the Q/U Imaging ExperimenT (QUIET). Tajima et al. (2012) The wiregrid is comprised of thin, reflective wires placed at intervals of one inch. During a calibration session, we placed the wiregrid on the plane perpendicular to the line of sight, and rotated it discretely around the line of sight to vary the polarization angle of the radiation reflected by the grid. As shown in Fig. 6, the HWP modulates the signal in the raw timestream, and the demodulation procedure correctly reconstructs the injected polarization signal. The figure also shows that the baseline drift seen in the raw timestream is highly suppressed in the demodulated timestream.
We apply the same procedure to data taken during a CMB observation. During the observation, the telescope scans the sky periodically in azimuth, while the elevation axis is fixed. The azimuth scans typically have a frequency of and are repeated for 1–1.5 hours; a set of repeated azimuth scans is denoted a “constant-elevation scan” (CES). The detectors are rebiased at the beginning of every CES. In evaluating the data, we apply crude data selection criteria to reject ill-behaved TESes (e.g., those that are not properly biased, those with too many glitches, etc.). We also reject TESes that have significantly low optical efficiency ( of a typical TES or lower) since inclusion of those may overestimate the stability of the timestreams. Typically TESes (out of functional TESes) pass these criteria and are used for further evaluation.
Figure 7 shows the power spectra averaged for TES timestreams from a CES performed on Oct. 6th, 2012, when the precipitable water vapor (PWV) was mm Note (3). As can be seen in the demodulated power spectrum (bottom), the ABS polarimeters are white-noise dominated above a few mHz.
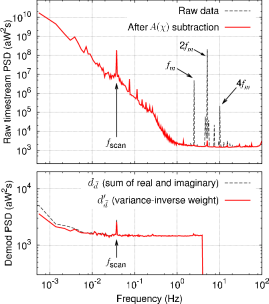
The average among TESes is calculated by inverse-variance weighting the power spectrum of each TES in each frequency bin so that it reflects the effective noise level relevant in the science analysis. The top panel of Fig. 7 shows the power spectra before the demodulation. We show both the raw timestream spectrum and the spectrum after the subtraction of the component that is constant over the CES. Although large spikes are observed at the harmonics of the modulation frequency , most of them correspond to the time-invariant and disappear after the subtraction. Note that the subtraction leads to little loss of the CMB signal. Note (4) The bottom panel shows the power spectra of the demodulated timestreams. Here, there are two power spectra that correspond to two different methods of obtaining the power spectrum of a single TES. One is to simply Fourier transform each of the real and imaginary parts of , and add them in power, which we will simply refer to as “the spectrum of .” In the other method, we first redefine the demodulated timestream as , where is found by maximizing (minimizing) the low-frequency noise of the real (imaginary) part of , and then averaging the power spectra of the real and imaginary parts by inverse-variance weighting in each frequency bin in the same manner as we do in averaging different TESes. Note that the demodulated timestream from a single TES has two degrees of freedom (the real and imaginary parts) and these two correspond to two orthogonal linear combinations of and polarizations. Thus, simply redefines the orthogonal linear combinations such that they are the eigenmodes of the noise for a single TES. The phase is determined separately in each CES for each TES. We typically find only one dominant mode of noise in the two degrees of freedom of a demodulated timestream, and the imaginary part of tends to exhibit extremely low noise. Thus, the second method of inverse-variance weighting evaluates the effective noise level better than the first method. The phase for each TES tends to show large CES-by-CES scatter. However, it tends to show a mild peak at a certain value and the peak is correlated to the polarization angle to which the TES is sensitive. Thus, at least part of the source of the noise has optical origin such as leakage.
As shown in the top panel of Fig. 7, the low-frequency noise component in raw timestreams typically has and a spectral index . The mHz knee frequencies in the demodulated timestreams correspond to reduction in noise power (or reduction in amplitude) and demonstrate a leakage from total power to polarization of less than dB.
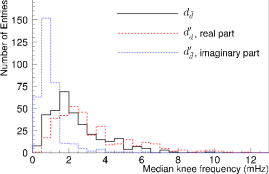
Figure 8 shows the distribution of the knee frequencies of the demodulated timestreams for detectors. The knee frequencies, characterizing the levels of low-frequency noise excess, are determined by fitting the following model to the power spectrum:
| (9) |
where free parameters of the fit are the high-frequency noise power , the spectral index , and the knee frequency . In the fit, the region around the scan frequency is excluded. Three knee frequencies are determined for each detector by fitting the spectrum of as well as the spectrum for each of the real and imaginary parts of . We evaluate the primary science data of about one month period. For each detector, the median knee frequency over this period is calculated for each of the three spectra. Shown are the distributions of these median knee frequencies per detector. The medians among all the detectors are 2.0 mHz, 2.6 mHz and 0.8 mHz for the spectra of , the real part of , and the imaginary part of , respectively.
Since the is so low that its timescale is close to the length of the timestream itself, small biases are introduced in the estimates above. These biases are evaluated through Monte-Carlo simulation studies and all of the results presented above are corrected for the bias. The corrections are small, corresponding to – mHz in the estimation of .
VI Conclusion
We have demonstrated the viability of the rapid rotation of CMB polarization using an ambient-temperature HWP. A demodulation technique based on mixing a complex modulation function with the time-ordered detector data is used to evaluate the quality of the science data from ABS. This analysis shows that ABS has achieved mHz stability in its polarization measurement and leakage from total power to polarization lower than dB.
Acknowledgments
Work at Princeton University is supported by the U.S. National Science Foundation through awards PHY-0355328 and PHY-085587, the U.S. National Aeronautics and Space Administration (NASA) through award NNX08AE03G, the Wilkinson Fund, and the Mishrahi Gift. Work at NIST is supported by the NIST Innovations in Measurement Science program. ABS operates in the Parque Astronómico Atacama in northern Chile under the auspices of the Comisión Nacional de Investigación Científica y Tecnológica de Chile (CONICYT). PWV measurements were provided by the Atacama Pathfinder Experiment (APEX). Some of the analyses were performed on the GPC supercomputer at the SciNet HPC Consortium. SciNet is funded by the Canada Foundation of Innovation under the auspices of Compute Canada, the Government of Ontario, the Ontario Research Fund – Research Excellence; and the University of Toronto. We would like to acknowledge the following people for their assistance in the instrument design, construction, operation, and data analysis: G. Atkinson, J. Beall, F. Beroz, S. M. Cho, S. Choi, B. Dix, T. Evans, J. Fowler, M. Halpern, B. Harrop, M. Hasselfield, S. P. Ho, J. Hubmayr, T. Marriage, J. McMahon, M. Niemack, S. Pufu, M. Uehara, K. W. Yoon. T. E.-H. was supported by a National Defense Science and Engineering Graduate (NDSEG) Fellowship, as well as a National Science Foundation Astronomy and Astrophysics Postdoctoral Fellowship. A. K. acknowledges the Dicke Fellowship. S. M. S. is supported by a NASA Office of the Chief Technologist’s Space Technology Research Fellowship. L. P. P. acknowledges the NASA Earth and Space Sciences Fellowship. S. R is in receipt of a CONICYT PhD studentship. S. R received partial support from a CONICYT Anillo project (ACT No. 1122).
References
- Hinshaw et al. (2013) G. Hinshaw, D. Larson, E. Komatsu, D. N. Spergel, et al., ApJS 208, 19, 19 (2013), eprint arXiv:1212.5226.
- Planck Collaboration et al. (2013) Planck Collaboration, P. A. R. Ade, et al., ArXiv e-prints (2013), eprint arXiv:1303.5076.
- Sievers et al. (2013) J. L. Sievers, R. A. Hlozek, M. R. Nolta, et al., J. Cosmol. Astropart. Phys., 10, 060 (2013), eprint arXiv:1301.0824.
- Keisler et al. (2011) R. Keisler, C. L. Reichardt, et al., ApJ 743, 28, 28 (2011).
- Seljak and Zaldarriaga (1997) U. Seljak and M. Zaldarriaga, Phys. Rev. Lett. 78, 2054 (1997), eprint arXiv:astro-ph/9609169.
- Kamionkowski et al. (1997) M. Kamionkowski, A. Kosowsky, and A. Stebbins, Phys. Rev. Lett. 78, 2058 (1997), eprint arXiv:astro-ph/9609132.
- Chiang et al. (2010) H. C. Chiang et al., ApJ 711, 1123 (2010), eprint arXiv:0906.1181.
- QUIET Collaboration et al. (2011) QUIET Collaboration et al., ApJ 741, 111, 111 (2011), eprint arXiv:1012.3191.
- Lay and Halverson (2000) O. P. Lay and N. W. Halverson, ApJ 543, 787 (2000).
- Dicke (1946) R. H. Dicke, Review of Scientific Instruments 17, 268 (1946).
- Jarosik et al. (2003) N. Jarosik et al., ApJS 145, 413 (2003), eprint astro-ph/0301164.
- Farese et al. (2004) P. C. Farese et al., ApJ 610, 625 (2004), eprint astro-ph/0308309.
- Barkats et al. (2005) D. Barkats et al., ApJS 159, 1 (2005), eprint astro-ph/0503329.
- QUIET Collaboration et al. (2012) QUIET Collaboration et al., ApJ 760, 145, 145 (2012), eprint arXiv:1207.5034.
- Bersanelli et al. (2010) M. Bersanelli et al., A&A 520, A4, A4 (2010), eprint arXiv:1001.3321.
- Stefanescu (2006) E. Stefanescu, The Ku-Band Polarization Identifier, a new instrument to probe polarized astrophysical radiation at 12–18 GHz, Ph.D. thesis, University of Miami (2006).
- O’dell et al. (2003) C. W. O’dell, B. G. Keating, A. de Oliveira-Costa, M. Tegmark, and P. T. Timbie, Phys. Rev. D 68(4), 042002, 042002 (2003), eprint astro-ph/0212425.
- Leitch et al. (2005) E. M. Leitch, J. M. Kovac, N. W. Halverson, J. E. Carlstrom, C. Pryke, and M. W. E. Smith, ApJ 624, 10 (2005), eprint astro-ph/0409357.
- Padin et al. (2002) S. Padin et al., Publ. Astron. Soc. Pac. 114, 83 (2002).
- Chen et al. (2009) M.-T. Chen et al., ApJ 694, 1664 (2009), eprint arXiv:0902.3636.
- Moyerman et al. (2013) S. Moyerman et al., ApJ 765, 64, 64 (2013), eprint arXiv:1212.0133.
- Jones and Klebe (1988) T. J. Jones and D. Klebe, PASP 100, 1158 (1988).
- Platt et al. (1991) S. R. Platt, R. H. Hildebrand, R. J. Pernic, J. A. Davidson, and G. Novak, PASP 103, 1193 (1991).
- Leach et al. (1991) R. W. Leach, D. P. Clemens, B. D. Kane, and R. Barvainis, ApJ 370, 257 (1991).
- Johnson et al. (2007) B. R. Johnson, J. Collins, et al., ApJ 665, 42 (2007).
- Ruhl (2008) J. E. Ruhl, A Review of Halfwave Plate Technology for CMB Observations (2008), and the references therein.
- Reichborn-Kjennerud et al. (2010) B. Reichborn-Kjennerud et al. (2010)Society of Photo-Optical Instrumentation Engineers (SPIE) Conference Series of vol. 7741, p. 77411C.
- Fowler et al. (2007) J. W. Fowler, M. D. Niemack, S. R. Dicker, et al., Appl. Opt. 46, 3444 (2007), eprint arXiv:astro-ph/0701020.
- Swetz et al. (2011) D. S. Swetz et al., ApJS 194, 41, 41 (2011), eprint arXiv:1007.0290.
- Note (1) Note1, early work testing such a device was performed on ACT.
- Lau (2007) J. M. Lau, CCAM: A novel millimeter-wave instrument using a close-packed TES bolometer array, Ph.D. thesis, Princeton University, New Jersey (2007).
- Parshin (1994) V. V. Parshin, International Journal of Infrared and Millimeter Waves 15, 339 (1994).
- Note (2) Note2, http://www.rogerscorp.com/documents/609/acm/RT-duroid-6002-laminate-data-sheet.pdf.
- Note (3) Note3, NewWay Air Bearings, 50 McDonald Blvd, Aston, PA 19014 USA.
- Staggs et al. (2008) S. T. Staggs et al., CMBpol Systematics Whitepaper (2008).
- Essinger-Hileman et al. (2009) T. Essinger-Hileman et al., in American Institute of Physics Conference Series, edited by B. Young, B. Cabrera, and A. Miller (2009)American Institute of Physics Conference Series of vol. 1185, pp. 494–497.
- Essinger-Hileman (2011) T. M. Essinger-Hileman, Probing Inflationary Cosmology: The Atacama B-Mode Search (ABS), Ph.D. thesis, Princeton University, New Jersey (2011).
- Appel (2012) J. W. Appel, Detectors for the Atacama B-Mode Search Experiment, Ph.D. thesis, Princeton University, New Jersey (2012).
- Visnjic (2013) K. Visnjic, Data Characteristics and Preliminary Results from the Atacama B-Mode Search (ABS), Ph.D. thesis, Princeton University, New Jersey (2013).
- Simon et al. (2013) S. M. Simon et al., “In Situ Time Constant and Optical Efficiency Measurements of TRUCE Pixels in the Atacama B-Mode Search”, J. Low Temp Phys. (to be published), (2013).
- Bryan et al. (2010) S. A. Bryan, T. E. Montroy, and J. E. Ruhl, Appl. Opt. 49, 6313 (2010), eprint arXiv:1006.3359.
- Essinger-Hileman (2013) T. Essinger-Hileman, Appl. Opt. 52, 212 (2013), eprint arXiv:1301.6160.
- Tajima et al. (2012) O. Tajima, H. Nguyen, C. Bischoff, A. Brizius, I. Buder, and A. Kusaka, \jltp 167, 936 (2012).
- Note (4) Note4, the lost signal is the component that is constant over approximately 1 hour of observation. This corresponds to modes in the and polarization maps that are constant over the sky covered during this observation. Thus, the subtracted modes are those with angular scales larger than our sky coverage and outside of the angular scales of interest.