Mode Coupling of Phonons in a Dense One-Dimensional Microfluidic Crystal
Abstract
Long-living coupled transverse and longitudinal phonon modes are explored in dense and regular arrangements of flat microfluidic droplets. The collective oscillations are driven by hydrodynamic interactions between the confined droplets and can be excited in a controlled way. Experimental results are quantitatively compared to simulation results obtained by multi-particle collision dynamics. The observed transverse modes are acoustic phonons and can be described by a linearized far-field theory, whereas the longitudinal modes arise from a non-linear mode coupling due to the lateral variation of the flow field under confinement.
pacs:
47.60.-i, 47.55.D-, 47.55.dr, 63.22.-mIntroduction. Hydrodynamic interactions of small objects in driven non-equilibrium systems lead to complex phenomena such as strong correlations in sedimenting suspensions Ramaswamy (2001), shock-waves in two-dimensional disordered ensembles of droplets Beatus et al. (2009), or cluster formation and alignment of red blood cells in micro-capillaries McWhirter et al. (2009). Non-equilibrium many-body phenomena can be favorably studied in microfluidic systems using ordered arrangements of flowing droplets (microfluidic crystals) Garstecki and Whitesides (2006); Baron et al. (2008); Dreyfus et al. (2003); Desreumaux et al. (2012). In pioneering studies, Beatus et al. Beatus et al. (2006, 2007, 2012) observed collective vibrations in dilute droplet trains flowing in a microfluidic Hele-Shaw configuration. These oscillations have been characterized as acoustic phonons with properties similar to lattice modes in dusty-plasma crystals Vladimirov et al. (1997); Ivlev and Morfill (2000). Their dispersion relation has been obtained to linear-order in terms of a small-amplitude expansion of the ensemble flow Beatus et al. (2006, 2007). However, in contrast to solid-state phonons that can be excited in a controlled way by mechanical or optical means, microfluidic phonons have so far been observed only when excited by thermal noise or defects in microchannels Beatus et al. (2006, 2007, 2012). Possible non-linear effects and interactions between phonon modes could not be studied quantitatively in these settings Beatus et al. (2012); Liu et al. (2012).
In this letter, we broaden the possibility to study hydrodynamically mediated collective phenomena by exploring dense droplet systems. In these systems, long-living transverse phonon modes and coupled longitudinal oscillations are experimentally excited and explored in an one-dimensional flowing microfluidic crystal. The experimental measurements are compared to existing analytic results based on a linearized theory, and to results from computer simulations using a mesoscale hydrodynamics approach which is able to reproduce the full non-linear interactions. The excited transverse phonon modes agree with the linearized far-field approximation Beatus et al. (2007, 2012). However, the observed longitudinal modes reveal a non-linear coupling to the transverse modes with a dispersion relation that is beyond the existing analytic theory.
Experimental Setup and Simulation Method. Microfluidic devices were fabricated using standard soft lithographic protocols Duffy et al. (1998); Chokkalingam et al. (2008) and the flow rates were volume-controlled using syringe pumps. Mono-disperse water droplets are generated in n-hexadecane (, ) with 2 wt% of the surfactant Span 80 using a step geometry Priest et al. (2006); Chokkalingam et al. (2008), cf. Fig. 1a. The microchannel has uniform height and width of . Typical flow velocities are for the droplet, and for the continuous oil phase. The corresponding Reynolds and Peclet number are and , where is the droplet radius and the diffusion coefficient of a droplet calculated with the formulas given in Beatus et al. (2012).
Computer simulations were conducted using multi-particle collision dynamics (MPC) Malevanets and Kapral (1999); Götze et al. (2007); Kapral (2008); Gompper et al. (2009). In this mesoscopic method, hydrodynamics are fully reproduced through the dynamics of point-like solvent particles supplement . The flattened droplets are modeled as discs in two-dimensional channel flow Götze and Gompper (2011). The collective oscillations are modeled by an initial zigzag arrangement of droplets with a given periodicity. Droplet and flow velocities were tuned to give a Reynolds number in the range of the experiments. Since MPC includes thermal fluctuations, the Peclet number for feasible droplet and flow velocities is significantly smaller than in the experiments. Consequently, a broader range of frequencies is excited in the simulations which helps to reveal the full dispersion relation of the phonon modes as will be discussed below.
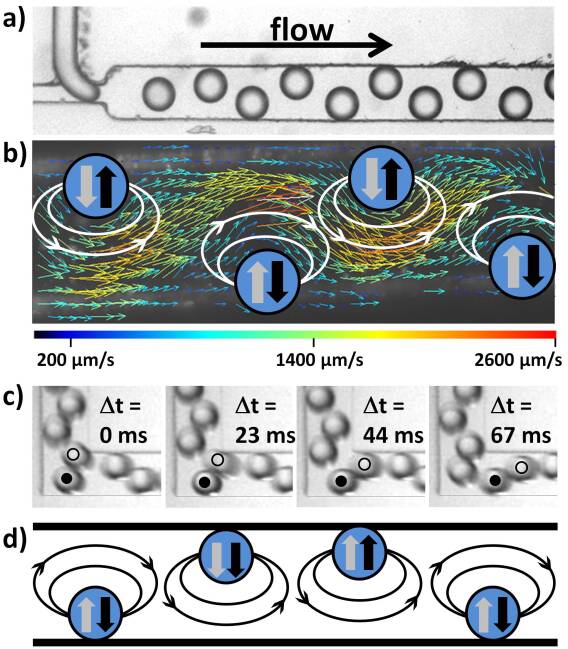
Controlled Excitation of Collective Oscillations. The size of the generated droplets exceeds the height of the microfluidic channel and the droplets are flattened. Due to friction with the confining top and bottom wall, the flat droplets move slower than the surrounding liquid phase leading to a two-dimensional dipolar flow field around each droplet, cf. Fig. 1b. Initially, the produced droplets form a stable zigzag configuration where the forces from the dipolar flow fields from the neighboring droplets cancel out. When this droplet arrangement is guided around a bend, a defect in the ordering can be achieved, as displayed in Fig. 1c. In the resulting droplet arrangement the zigzag symmetry is broken and some droplets experience a net hydrodynamic force and are moved towards the opposite channel wall, see Fig. 1d. Following this transverse movement a single defect propagates backwards in the co-moving frame of the droplets, cf. supplement .
Provided the droplet size relative to the channel width is chosen appropriately, defects can be generated periodically. This leads to sine-waves of droplets traveling forward in flow direction, see Fig. 2a. The collective oscillations are very stable and could be observed for channel lengths up to 10 cm, i.e. four orders of magnitude larger than a typical droplet radius. The wavelength in longitudinal direction depends on both the droplet size and the droplet spacing, i.e., droplet density. Varying these parameters, various wavelengths can be specifically excited. However, the experimentally accessible wavelength variation is limited to a factor of about three as the size of the droplets and the droplet density have to be chosen such that the droplets are close enough to affect each other by hydrodynamic interactions but do not deform each other by steric contact.
In the following, we analyze and discuss the specific experimental and simulation results for a wavelength of six droplets with radius of m and crystal spacing m. The results are equally valid for other wavelengths and the discussion applies to both experiments and simulation unless mentioned otherwise.
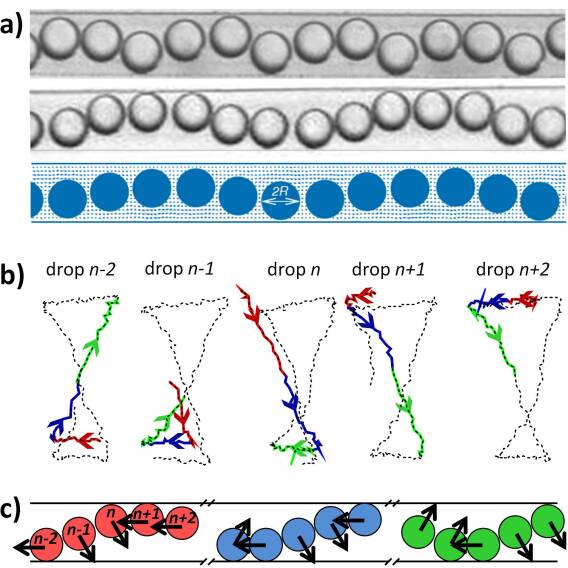
Analysis of Collective Oscillations The motion of five neighboring droplets is plotted in Fig. 2b,c in the co-moving frame of the droplets. The space trajectory of each droplet describes a figure-eight and each droplet has a constant phase shift to its neighboring droplets. The figure-eight results from the transverse oscillation with comparable large amplitude given by the lateral confinement, and a coupled longitudinal oscillation with smaller amplitude given by the crystal lattice, i.e. the droplet density. For large transverse displacement, the droplets closely approach the lateral channel walls, where they slow down as a consequence of the no-slip boundary condition. Thus the droplets move backward in the co-moving frame when they are close to a channel wall, and forward when they cross the channel. One full cycle of the longitudinal oscillation is completed while the droplet moves from one wall to the other, corresponding to half a transverse cycle. Accordingly, the constant phase shift between neighboring droplets differs by a factor of two between transverse and for longitudinal modes, i.e. and for the considered wave.
To analyze the droplet oscillations quantitatively, we extracted the power spectra for the transverse and longitudinal oscillations both from experimental and simulation results, cf. Fig. 3. The main feature of the experimental results are a few distinct peak values for both modes, cf. Fig. 3a,b. The discrete spectra demonstrate that the droplets describe a collective oscillation with one well defined wavelength in both directions. The corresponding phonon spectra obtained from simulations are displayed in Fig. 3c,d. They show a continuous signature revealing the full dispersion relation with a sine-like dependence of the frequency on the wave vector. This complete signature results from the small Peclet number, i.e., from the pronounced influence of thermal fluctuations.
A comparison of the experimental and numerical transverse power spectra shows that the dominant frequencies are identical. Moreover, they are in excellent quantitative agreement with the dispersion relation for transverse phonons predicted by a linearized far-field theory for two-dimensional channel flow Beatus et al. (2007, 2012):
| (1) |
where , and . Note that in Eq. (1) has a slightly different form than reported in Refs. Beatus et al. (2007, 2012), as it takes into account all linear-order terms in the expansion supplement . The agreement confirms that the observed transverse oscillations are acoustic phonons. From the dispersion relation, we obtain the propagation speed of the phonon mode along the droplet crystal in direction of the flow. The quantitative agreement also shows that the linearized far-field hydrodynamic interactions describe the transverse phonon dynamics remarkably well, despite the fact that the droplets nearly touch each other Beatus et al. (2012). It even seems that the validity of the far-field approximation for an ensemble of flat droplets is extended compared to an ensemble of micro-particles with similar confinement Cui et al. (2002, 2004); Baron et al. (2008).
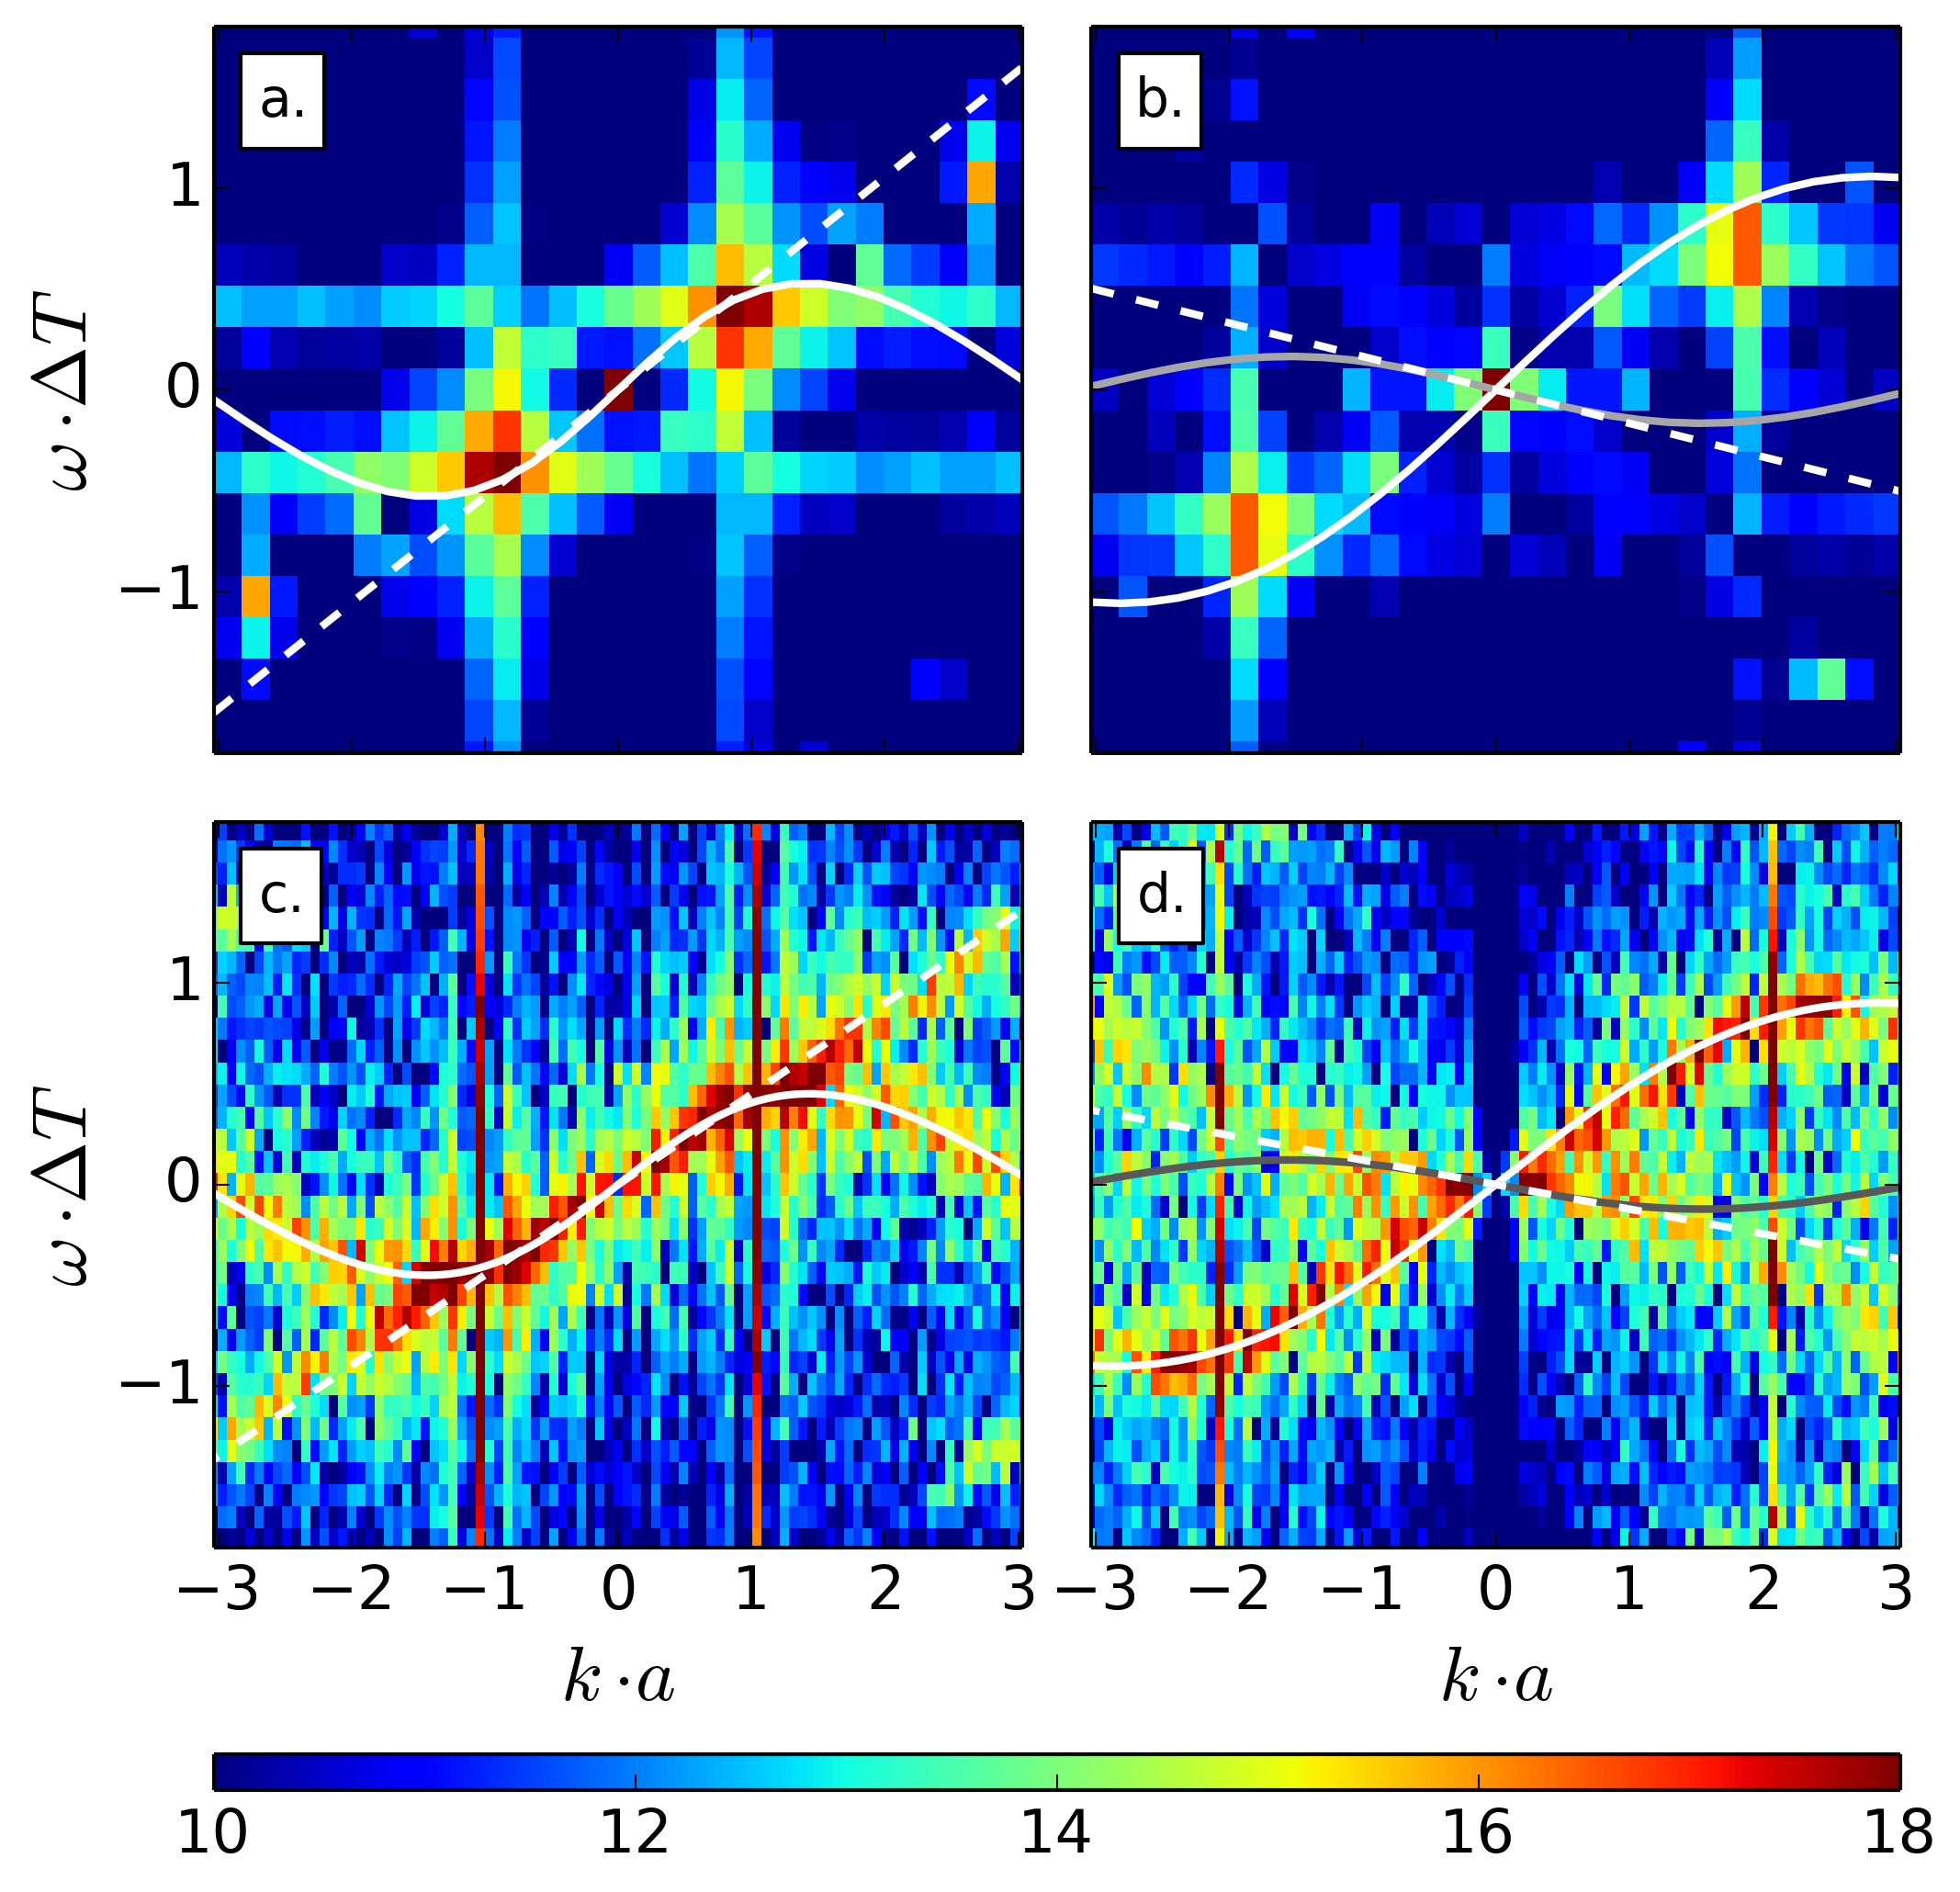
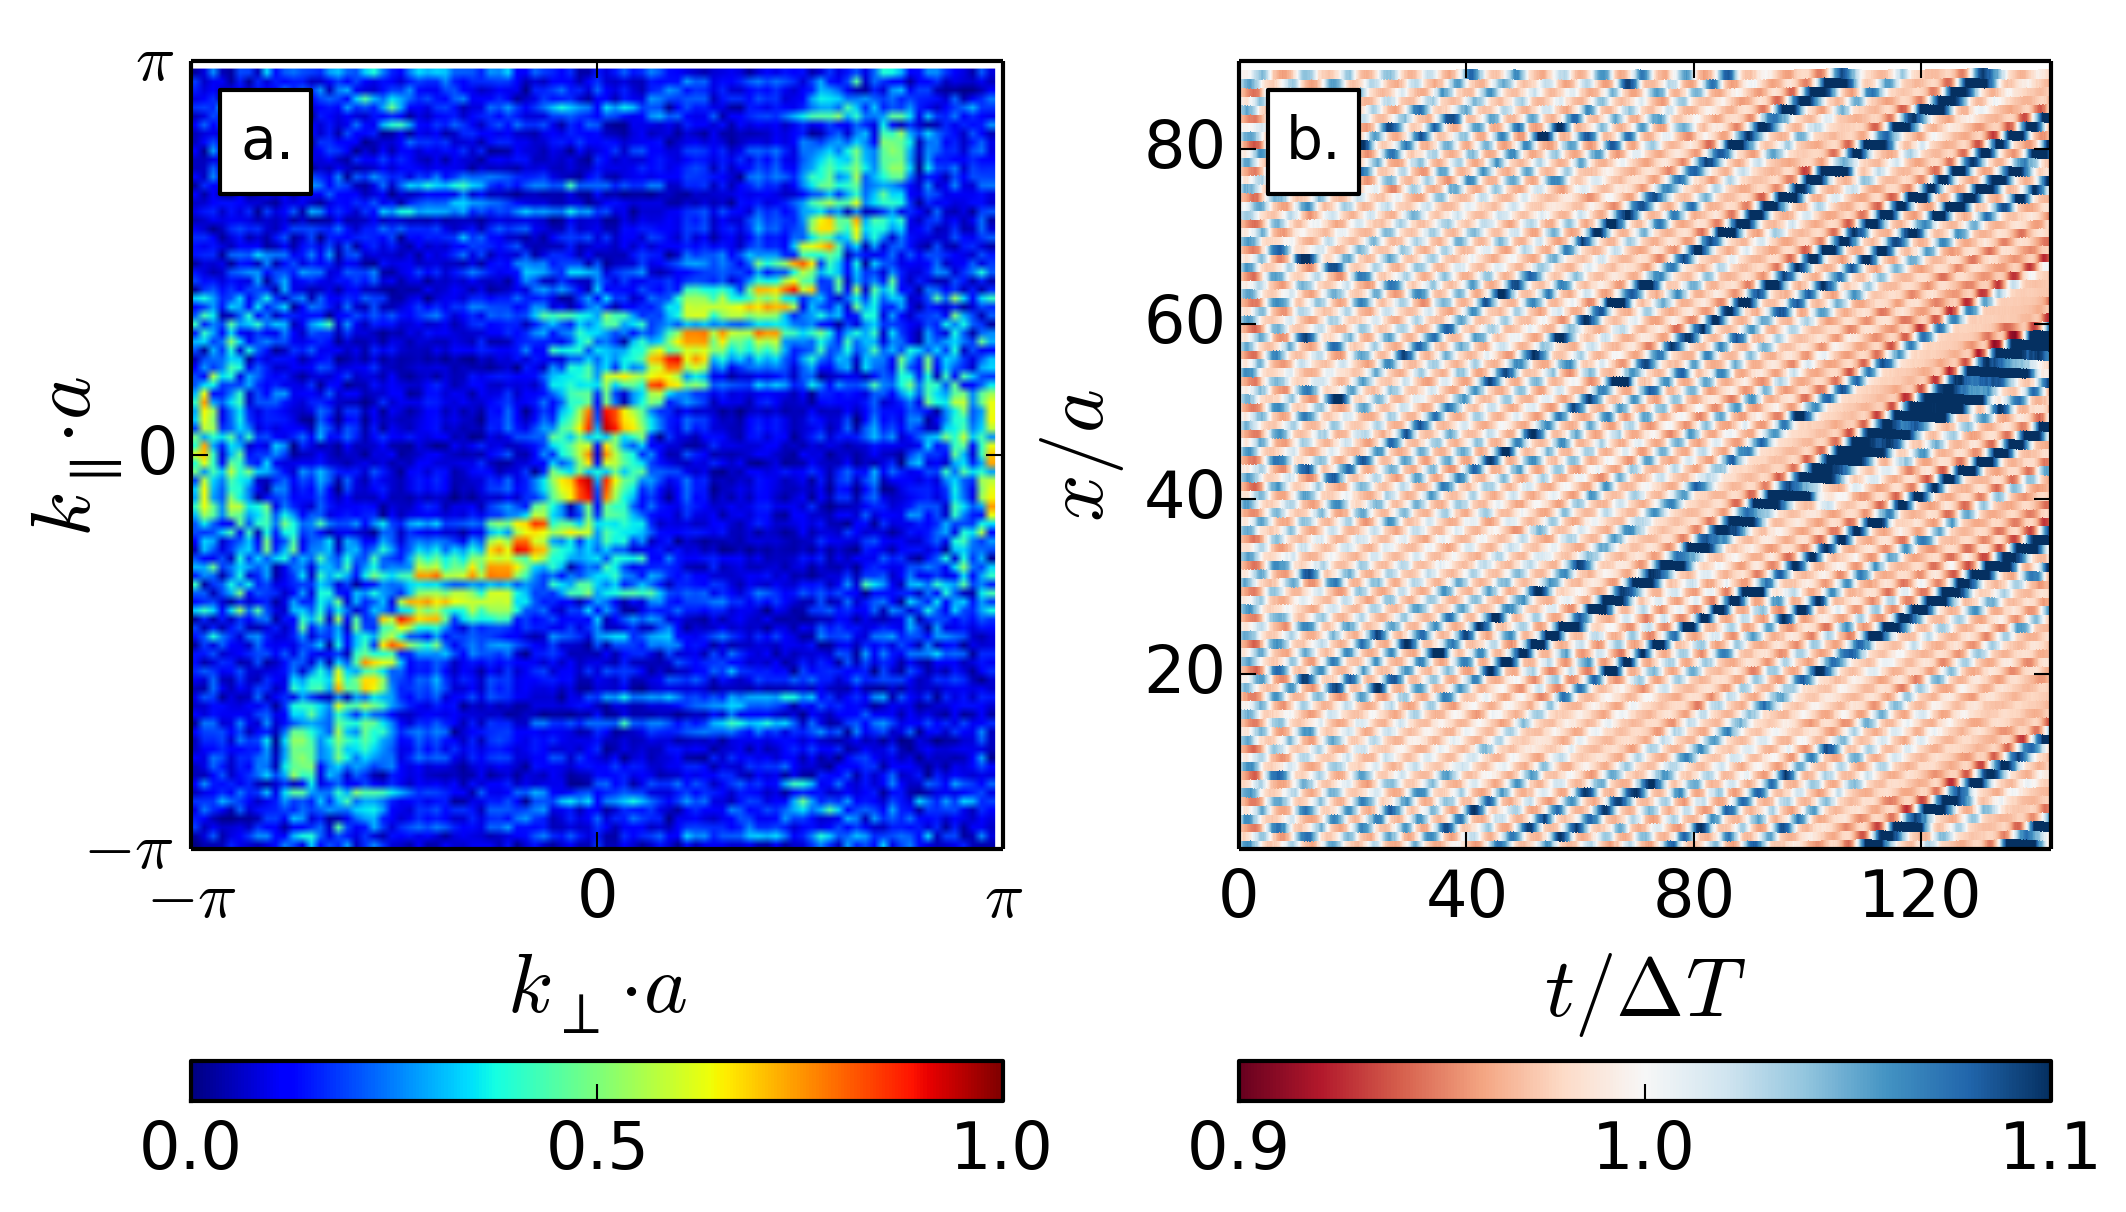
The observed longitudinal modes are not actively excited and have a smaller amplitude than the transverse oscillation. The dominant frequencies derived from experimental and simulation result agree quantitatively. Interestingly, the longitudinal modes show a dispersion relation that qualitatively deviates from the prediction of the linearized theory, cf. Fig. 3b,d where from Eq. 1 is plotted as gray lines. Hence a different and non-linear mechanism must be responsible for the longitudinal modes. We observe that the maximum of the longitudinal dispersion relation appears shifted towards , and for all , the longitudinal modes propagate in the flow direction, in contrast to the analytical prediction (1). The observed shape of the longitudinal dispersion relation resembles the scaled shape of the transverse dispersion relation. The apparent correlation is confirmed by the correlation strength between the numerically derived longitudinal and transverse modes and , as displayed in Fig. 4a. Whereas acoustic phonons are expected to have high correlation for Liu et al. (2012), we observe high correlation for . In combination with the observed figure-eight motion of individual droplets (Fig. 2) it is suggested that the coupling of the longitudinal to the transverse mode can be expressed by the dispersion relation . This expression is plotted in Fig. 3b,d in quantitative agreement with the observed longitudinal spectra.
Long-time behavior and onset of instability. Besides the main branches, a weaker and apparently linear branch is present in the continuous numerical power spectra and consistent with the secondary peaks in the experimental power spectra (Fig. 3a,c). This branch has a positive slope for transverse modes and a negative slope for longitudinal modes. In the simulation results, the linear branches are relatively weak for short simulation times but become more pronounced for longer times, which indicates a relation to the long-time behavior of the droplets. The space-time diagram of the numerically obtained longitudinal elongations in Fig. 4b reveals the formation of gaps and break-up of the crystal into smaller sub-units with time. This is most likely caused by non-linear interactions between longitudinal and transverse modes, similar to observations for unconfined crystals Beatus et al. (2012) and in dusty-plasma crystals Couëdel et al. (2010); Liu et al. (2010). When the droplets move away from their regular crystal positions, they can be regarded as a continuous ensemble, and the finite-differences in the equation of motion are replaced by a continuum approximation supplement . The resulting linear dispersion relations are plotted as dashed lines in Fig. 3 and match the secondary features reasonably well. They are more pronounced in the simulations as the breakup of the crystal is amplified by the stronger thermal fluctuations. Because of the longitudinal modes, fluctuations in the longitudinal droplet positions are also present in the experiments. However, as the amplitude of the longitudinal fluctuations are not growing on the observed length and time scales, the peaks remain faint in the experimental power spectra. This experimental observation seems to indicate that fluctuations in a dense microfluidic crystal with small droplet spacing are more stable than a dilute microfluidic crystal with large droplet spacing Desreumaux et al. (2012).
Summary and Conclusion. Coupled phonon modes were experimentally studied in a dense one-dimensional microfluidic crystal and quantitatively compared to simulations and analytical results. The specifically excited transverse oscillations can be described as acoustic phonons by a linearized far-field theory even in the dense system where droplets are almost in contact. The considerable amplitude of the excited transverse oscillations leads to a non-linear coupling of longitudinal to transverse modes. The coupling is due to the lateral variation of the hydrodynamic interactions across the channel. The coupled longitudinal modes are beyond the existing analytic description, but can be quantitatively described by a phenomenological dispersion relation. The small longitudinal droplet spacing in dense droplet crystals seems to support the coupling of the longitudinal and the transverse modes leading to very stable collective oscillations. Thus, complementary to previous studies on dilute systems, dense microfluidic crystals are a promising system to study collective effects and non-linear phenomena arising from hydrodynamic interactions under confinement. In particular, it would be interesting to extend this study to two-dimensional systems, where higher order collective excitations and unexplored self-organizing behavior may arise.
R.S. and J.-B. F. gratefully acknowledge financial support by the DFG grant SE 1118/4.
References
- Ramaswamy (2001) S. Ramaswamy, Adv. Phys. 50, 297 (2001).
- Beatus et al. (2009) T. Beatus, T. Tlusty, and R. Bar-Ziv, Phys. Rev. Lett. 103, 114502 (2009).
- McWhirter et al. (2009) J. L. McWhirter, H. Noguchi, and G. Gompper, Proc. Natl. Acad. Sci. 106, 6039 (2009).
- Garstecki and Whitesides (2006) P. Garstecki and G. M. Whitesides, Phys. Rev. Lett. 97, 024503 (2006).
- Baron et al. (2008) M. Baron, J. Blławzdziewicz, and E. Wajnryb, Phys. Rev. Lett. 100, 174502 (2008).
- Dreyfus et al. (2003) R. Dreyfus, P. Tabeling, and H. Willaime, Phys. Rev. Lett. 90, 144505 (2003).
- Desreumaux et al. (2012) N. Desreumaux, N. Florent, E. Lauga, and D. Bartolo, Eur. Phys. J. E 35, 1 (2012).
- Beatus et al. (2006) T. Beatus, T. Tlusty, and R. Bar-Ziv, Nature Physics 2, 743 (2006).
- Beatus et al. (2007) T. Beatus, R. Bar-Ziv, and T. Tlusty, Phys. Rev. Lett. 99, 124502 (2007).
- Beatus et al. (2012) T. Beatus, R. Bar-Ziv, and T. Tlusty, Physics Reports 516, 103 (2012).
- Vladimirov et al. (1997) S. V. Vladimirov, P. V. Shevchenko, and N. F. Cramer, Phys. Rev. E 56, R74 (1997).
- Ivlev and Morfill (2000) A. V. Ivlev and G. Morfill, Phys. Rev. E 63, 016409 (2000).
- Liu et al. (2012) B. Liu, J. Goree, and Y. Feng, Phys. Rev. E 86, 046309 (2012).
- Duffy et al. (1998) D. C. Duffy, J. C. McDonald, O. J. A. Schueller, and G. M. Whitesides, Anal. Chem. 70, 4974 (1998).
- Chokkalingam et al. (2008) V. Chokkalingam, S. Herminghaus, and R. Seemann, Appl. Phys. Lett. 93, 254101 (2008).
- Priest et al. (2006) C. Priest, S. Herminghaus, and R. Seemann, Appl. Phys. Lett. 88, 024106 (2006).
- Malevanets and Kapral (1999) A. Malevanets and R. Kapral, J. Chem. Phys. 110, 8605 (1999).
- Götze et al. (2007) I. O. Götze, H. Noguchi, and G. Gompper, Phys. Rev. E 76, 046705 (2007).
- Kapral (2008) R. Kapral, Adv. Chem. Phys. 140, 89 (2008).
- Gompper et al. (2009) G. Gompper, T. Ihle, D. M. Kroll, and R. G. Winkler, Adv. Poly. Sci. 221, 1 (2009).
- (21) See supporting information at [URL will be inserted by publisher].
- Götze and Gompper (2011) I. O. Götze and G. Gompper, Phys. Rev. E 84, 031404 (2011).
- Cui et al. (2002) B. Cui, H. Diamant, and B. Lin, Phys. Rev. Lett. 89, 188302 (2002).
- Cui et al. (2004) B. Cui, H. Diamant, B. Lin, and S. A. Rice, Phys. Rev. Lett. 92, 258301 (2004).
- Couëdel et al. (2010) L. Couëdel, V. Nosenko, A. V. Ivlev, S. K. Zhdanov, H. M. Thomas, and G. E. Morfill, Phys. Rev. Lett. 104, 195001 (2010).
- Liu et al. (2010) B. Liu, J. Goree, and Y. Feng, Phys. Rev. Lett. 105, 085004 (2010).