Resonant interactions between a Mollow triplet sideband of a quantum dot and a strongly coupled cavity.
Abstract
We experimentally demonstrate that the Mollow triplet sidebands of a quantum dot strongly coupled to a cavity exhibit anomalous power induced broadening and enhanced emission when one sideband is tuned over the cavity frequency. We observe a nonlinear increase of the sideband linewidth with excitation power when the Rabi frequency exceeds the detuning between the quantum dot and the cavity, consistent with a recent theoretical model that accounts for acoustic phonon-induced processes between the exciton and the cavity. In addition, the sideband tuned to the cavity shows strong resonant emission enhancement.
Resonance fluorescence of atomic systems is important for studying light-matter interactions, and also plays a crucial role in quantum information processing. For example, it can be used to perform non-destructive quantum state readout Sauter et al. (1986); Bergquist et al. (1986); Vamivakas et al. (2010) and generate single photons Kimble et al. (1977); Matthiesen et al. (2012). In these cases, the laser power is typically well below the saturation power of the quantum dot exciton. Under strong pump excitation, however, the resonance fluorescence emission becomes highly nonlinear and exhibits a Mollow triplet spectrum Mollow (1969).
The Mollow triplet spectrum has been observed with atoms Schuda et al. (1974) as well as solid-state quantum emitters such as quantum dots Muller et al. (2007); Xu et al. (2007); Muller et al. (2008); Vamivakas et al. (2009); Flagg et al. (2009); Ates et al. (2009a). Unlike single isolated atoms, quantum dots are coupled to a broad continuum of phonon states in a semiconductor matrix that significantly affects the resonance fluorescence properties Förstner et al. (2003); Ramsay et al. (2010). This phonon mediated interaction is particularly strong when the quantum dot is coupled to a cavity. Cavity enhancement of phonon effects has been investigated experimentally and theoretically in the small Rabi frequency regime where the Mollow triplet sidebands are highly detuned from the cavity Ulrich et al. (2011); Roy and Hughes (2011a); Majumdar et al. (2011a, b); Roy and Hughes (2011b). In this regime, phonons cause power broadening of the sidebands, whose linewidth linearly increases with the excitation power Ulrich et al. (2011); Roy and Hughes (2011a). In the large Rabi frequency regime, however, recent theoretical work has predicted anomalous broadening of the sideband emission Roy et al. (2012) where the linewidth becomes a highly nonlinear function of pump power. In particular, the rate of increase of the sideband linewidth is expected to significantly change when the emission frequency of one of the sidebands crosses the cavity resonance, which is the transition point between the small Rabi frequency and large Rabi frequency regimes. The large Rabi frequency regime, however, has yet to be experimentally attained and anomalous power broadening has not been demonstrated.
In this paper, we experimentally demonstrate that Mollow triplet sidebands of a quantum dot strongly coupled to a cavity exhibit anomalous power broadening and large emission enhancement when tuned over the cavity frequency. We obtain a Rabi frequency exceeding 100 GHz, which enables us to tune the sideband emission over the entire resonant spectrum of the cavity. We show that the emission intensity of the cavity-resonant sideband is strongly enhanced relative to the intensity of the detuned sideband by as much as a factor of 6. We also observe an anomalous power induced broadening when the sideband crosses the cavity resonance, consistent with recent theoretical predictions Roy et al. (2012). We compare our experimental results to numerical simulations based on an effective phonon master equation, derived from a full polaron model Roy and Hughes (2011b), which show excellent agreement.
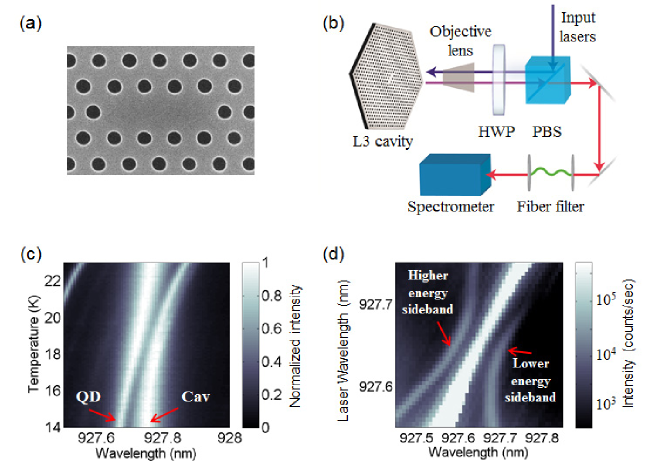
The system we study is an InAs quantum dot strongly coupled to a GaAs photonic crystal three-hole defect cavity Akahane et al. (2005). Fig. 1a shows a scanning electron microscope image of a fabricated cavity. The sample consists of 160 nm GaAs membrane with a single layer of InAs quantum dots (density of m2) at the center. The GaAs membrane is grown on top of a 1 m AlGaAs sacrificial layer. We fabricate photonic crystal cavities using electron beam lithography and chlorine based dry etching, followed by a wet etch of the sacrificial layer to create a membrane.
Fig. 1b shows the measurement setup. Sample excitation and collection are performed with a confocal microscope using an objective lens with numerical aperture of 0.68. We excite the sample using either a Ti:Sapphire laser emitting at 780 nm for photoluminescence measurements, or with a narrow linewidth ( kHz) tunable diode for resonance fluorescence measurements. The collected signal is measured using a grating spectrometer with a resolution of 7 GHz and detected by a charged coupled device (CCD). A cross-polarization setup rejects the component of the excitation laser that does not couple to the cavity mode. For high-resolution spectral measurements, we use a tunable fiber Fabry-Perot filter with 0.9 GHz bandwidth in front of the spectrometer.
We first characterize the device through photoluminescence. Fig. 1c shows the measured cavity spectrum as a function of the sample temperature. The spectrum shows two resonances, one which corresponds to the direct cavity emission and a second due to a quantum dot. As the sample temperature increases, the quantum dot resonance red-shifts and exhibits a clear anti-crossing with the cavity indicating that the system operates in the strong coupling regime. A minimum energy separation () of 101 eV (24.7 GHz) is observed on resonance at 18.5 K. When the quantum dot is detuned from the cavity, the photoluminescence from the bare cavity shows a quality factor of 9,100, corresponding to a cavity energy decay rate of GHz. The coupling strength is calculated to be GHz using the relation .
Fig. 1d shows the resonance fluorescence spectrum taken when the narrow band diode laser is swept over the quantum dot emission wavelength at temperature of 5 K. The diode laser power is set to 8.0 W and the signal is measured directly by the spectrometer. Using the cross-polarization setup and spatial filtering with a single mode fiber, we reject a large fraction of the direct laser scatter from the sample surface. The cavity mode is blue-detuned from the quantum dot by 0.24 nm and lies outside the plotted wavelength range. When the laser is tuned close to the quantum dot emission line (927.64 nm), the spectrum exhibits a Mollow triplet.
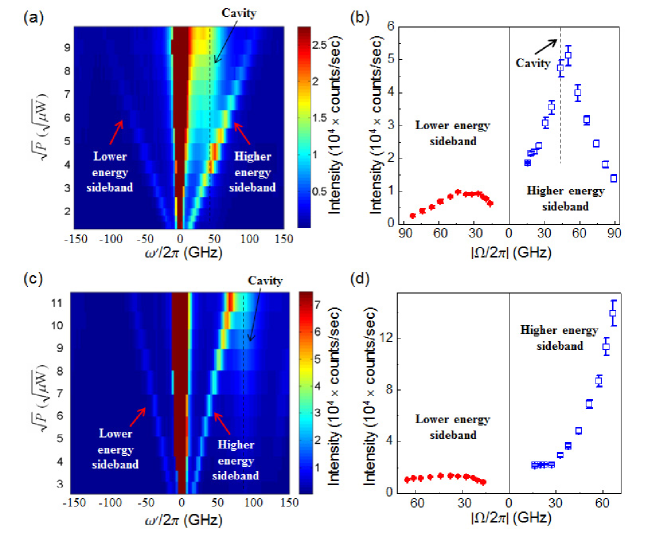
Fig. 2a shows the resonance fluorescence spectrum as a function of , where is the pump power measured before the focusing lens. The -axis is relative frequency , where is the measured frequency and is a laser frequency. The detuning between the quantum dot emission frequency () and cavity () is GHz (0.12 nm), and the excitation laser is tuned to resonance with the quantum dot. At each power, the Mollow triplet sidebands appear symmetrically on the longer and shorter wavelength sides of the quantum dot emission and their spectral separation increases linearly with . The Rabi frequency is related to the splitting between the two sidebands, denoted , via the relation . At the maximum pump power we achieve a Rabi frequency exceeding GHz, which is much greater than . Thus we are able to drive the system both in the small Rabi frequency regime () and the large Rabi frequency regime ().
At a pump power of W, the higher energy sideband is resonant with the cavity mode (black dashed line). A clear enhancement of emission is observed under this condition, resulting in a highly asymmetric spectrum where the higher energy sideband shows a higher intensity than the lower energy sideband. At even higher pump power, the higher energy sideband tunes beyond the cavity resonance and is once again diminished. We note that at very high pump power the bare cavity emission appears in the spectrum. This emission is attributed to phonon induced non-resonant energy transfer of the quantum dot excitation Ates et al. (2009b); Hohenester et al. (2009); Winger et al. (2009); Englund et al. (2010); Hughes et al. (2011).
In Fig. 2b, we plot the emission intensity of the higher (blue open squares) and lower (red full circles) energy sidebands as a function of the Rabi frequency. To determine the Rabi frequency and intensity, we fit the measured spectrum at each laser power to four Lorentzians, one for each sideband, one for the laser scatter, and one for the cavity which is excited by inelastic scattering. When the higher energy sideband is within 10 GHz of the cavity resonance, it becomes difficult to separate it from the cavity emission due to inelastic scattering. In this region, we interpolate the inelastic scattering intensity using the closest data points outside the 10 GHz window. Fig. 2b shows a clear resonant behavior where the sideband is enhanced near cavity resonance, resulting in a large emission asymmetry. The higher energy sideband is 6 times brighter than the lower energy sideband at a pump power of W ( GHz).
Fig. 2c-d show the spectrum as a function of pump power where the detuning between the cavity and quantum dot is increased to GHz (0.24 nm) by gradual gas condensation that occurs naturally in the vacuum chamber Mosor et al. (2005); Strauf et al. (2006). Here, the detuning is greater than the maximum achievable Rabi frequency so the system remains in the small Rabi frequency regime for all pump powers. Because of the larger detuning, the Mollow sideband does not cross the cavity resonant frequency and we do not observe a resonance behavior. Instead, the sideband emission intensity gradually increases as it tunes closer to resonance with the cavity.
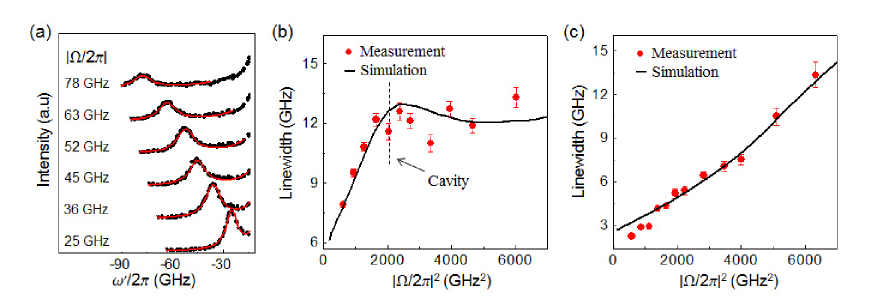
In addition to the asymmetry and intensity increase at cavity resonance, Fig. 2a shows indications of linewidth broadening. The sideband linewidth is predicted to exhibit an anomalous power broadening behavior in the large Rabi frequency regime Roy et al. (2012), where it becomes a highly nonlinear function of pump power. Due to the resolution limit of the spectrometer, however, this broadening is difficult to resolve from the data in Fig. 2. In order to improve the spectral resolution of the measurement system we place a tunable fiber Fabry-Perot filter with 0.9 GHz bandwidth in front of the spectrometer. Measurements are performed by tuning the filter and recording the intensity, determined by integrating the signal over a 14 GHz spectral window (corresponding 5 pixels of CCD) around the center frequency of the Fabry-Perot mode. We measure the linewidth of the lower energy sideband since it is always highly detuned from the cavity and therefore spectrally well separated from the background photons created by non-resonant energy transfer.
Fig. 3a shows the measured high-resolution spectrum of the lower energy sideband for several different pump powers at a detuning of GHz. For each spectrum, the sideband linewidth is determined by fitting the measured data with two-Lorentzian functions, one representing the sideband peak while the other the direct laser signal. The fit is shown as a solid red line in the figure. Fig. 3b shows the measured full-width half-maximum linewidth of the Mollow sideband as a function of . Here is determined by measuring the detuning of the lower energy sideband from the laser, where the sideband center frequency is obtained from the Lorentzian fit. In the small Rabi frequency regime () we observe a linear increase in the sideband linewidth as a function of pump power (proportional to ). At a pump power of GHz2 (denoted by the dashed vertical line), the higher energy sideband becomes resonant with the cavity and the system transitions to the large Rabi frequency regime (). At this point the linewidth exhibits an anomalous broadening behavior where it becomes a highly nonlinear function of pump power. In the large Rabi frequency regime the linewidth is largely insensitive to the pump power. We observe the transition between these two behaviors precisely at the point where the higher energy sideband crosses the cavity mode. On the other hand, Fig. 3c shows the lower energy sideband linewidths obtained for a larger quantum dot-cavity detuning ( GHz) where the system remains in the small Rabi frequency regime. Here the linewidth shows nearly linear increase over the same range of excitation power.
To gain further insight into the mechanism for the anomalous power broadening behavior we perform numerical simulations of the master equation where is the density matrix of the system. The system Hamiltonian is given by
| (1) |
In Eq. 1, and . In addition, is the population difference operator between the excited and ground state of the quantum dot, () represents the dipole lowering (raising) operator for the quantum dot, () is the cavity photon annihilation (creation) operator, and is the driving field amplitude. The Liouvillian superoperator accounts for all non-unitary Markovian processes including cavity and quantum dot damping, pure dephasing, and phonon mediated energy transfer. This operator can be written as
| (2) |
where is a general Linblad operator form for the collapse operator . In Eq. 2, is the quantum dot spontaneous emission rate, is the cavity energy decay rate, and is the quantum dot pure dephasing rate. To account for the phonon mediated dephasing, we adopt the formalism of Ref. Roy and Hughes (2011b) and include the last two Linblad terms where we define and as the phonon mediated dephasing rates; physically these processes describe the destruction of a cavity photon leading to the creation of an exciton or vice versa.
Numerical simulations are performed using an open source quantum optics toolbox Tan (1999). We calculate the two-time covariance function in the steady state limit using quantum regression theory. The power spectrum is obtained by taking the Fourier transform of the covariance function. We set the cavity decay rate and the quantum dot-cavity coupling strength to the measured values of GHz and GHz, respectively. The spontaneous emission rate is GHz and the pure dephasing rate is GHz Favero et al. (2007).
The sideband linewidth is calculated by fitting the calculated power spectrum with a Lorentzian at each Rabi frequency. We determine and in this simulation by treating them as fitting parameters and performing a linear least squares optimization. From the fit we obtain GHz and GHz. We note that these phonon dephasing rates are consistent with the previously predicted values Roy and Hughes (2011b); Roy et al. (2012). The solid line in Fig. 3b shows the theoretically calculated linewidths of the lower energy sideband as a function of for GHz. The simulations exhibit good agreement with the measurement results and predict anomalous broadening at the same excitation power. Fig. 3c plots the same simulations for GHz. Here we obtain phonon coupling rates of GHz and GHz. These values are different from those obtained in Fig. 3b because the phonon dephasing rates depend on Roy and Hughes (2011b).
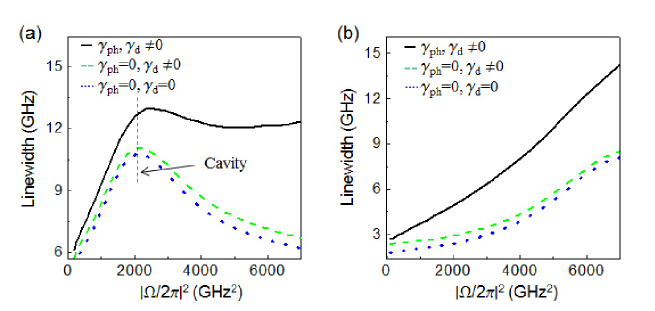
To explain the cause of anomalous broadening, we consider the situation where there is no phonon mediated energy transfer or pure dephasing by setting . The blue dotted line in Fig. 4a shows the results for this simulation where the detuning is set to GHz. In this case the only interaction between the quantum dot and cavity is through the coherent Jaynes-Cummings term in the Hamiltonian. The sideband linewidth exhibits a resonant behavior that peaks when the higher energy sideband is on-resonance with the cavity. The green dashed line shows the situation where we have included pure dephasing, which does not change the resonant behavior but simply broadens the sideband linewidth independent of the excitation power. The model consisting of only a unitary Jaynes-Cummings interaction and pure dephasing exhibits poor agreement with the experimental results. When we add the phonon mediated dephasing terms (black solid line) we obtain a significantly better agreement with the measured data. Fig. 4b plots the same simulations for a detuning of GHz. None of the simulations exhibit an anomalous power broadening because we are always in the small Rabi frequency regime. Still, without the phonon term the simulations predict a much smaller power induced broadening than what is observed experimentally.
The simulations provide a clearer picture for the mechanism of anomalous linewidth broadening. Away from resonance, phonon coupling is the dominant broadening mechanism (as shown in Fig. 4b) and results in a monotonic increase of the sideband linewidth as a function of pump power. Near resonance, however, the coherent Jaynes-Cummings term significantly contributes to the sideband linewidth (Fig. 4a). In the small Rabi frequency regime, both phonon mediated dephasing and coherent Jaynes-Cummings interaction exhibit an increase in linewidth as a function of pump power and therefore constructively add. In the large Rabi frequency regime, the Jaynes-Cummings term exhibits a decrease in the linewidth as a function of pump power. Instead of adding constructively, this decrease now partially cancels out the monotonic increase due to phonon coupling. The interplay between these two terms therefore leads to the anomalous linewidth broadening behavior observed in the experimental measurements.
In conclusion, we demonstrate that the Mollow triplet sideband of a quantum dot exhibits a nonlinear dependence of the sideband linewidth with the excitation power as well as emission enhancement when the Rabi frequency is comparable to the quantum dot-cavity detuning. Our experimental results agree well with recent theoretical prediction and provide further insight into the Mollow triplet emission properties in the strong coupling regime. These results could find important applications for single and heralded photon sources with large frequency tunability Ulhaq and et al. (2012). They could also provide a direct pathway for achieving population inversion with a resonantly driven single emitter Quang and Freedhoff (1993).
We would like to acknowledge S. Hughes for helpful discussions. This work was supported by the ARO MURI on Hybrid quantum interactions (grant no. W911NF09104), the Physics Frontier Center at the Joint Quantum Institute, a DARPA Defense Science Office grant (grant no. W31P4Q0910013), and the ONR Applied Electromagnetics center. E. Waks would like to acknowledge support from an NSF CAREER award (grant no. ECCS. 0846494) and a DARPA Young Faculty Award (grant no. N660011114121).
References
- Sauter et al. (1986) T. Sauter, W. Neuhauser, R. Blatt, and P. E. Toschek, Phys. Rev. Lett. 57, 1696 (1986).
- Bergquist et al. (1986) J. C. Bergquist, R. G. Hulet, W. M. Itano, and D. J. Wineland, Phys. Rev. Lett. 57, 1699 (1986).
- Vamivakas et al. (2010) A. N. Vamivakas, C.-Y. Lu, C. Matthiesen, Y. Zhao, S. Falt, A. Badolato, and M. Atatüre, Nature 467, 297 (2010).
- Kimble et al. (1977) H. J. Kimble, M. Dagenais, and L. Mandel, Phys. Rev. Lett. 39, 691 (1977).
- Matthiesen et al. (2012) C. Matthiesen, A. N. Vamivakas, and M. Atatüre, Phys. Rev. Lett. 108, 093602 (2012).
- Mollow (1969) B. R. Mollow, Phys. Rev. 188, 1969 (1969).
- Schuda et al. (1974) F. Schuda, C. R. Stroud Jr, and M. Hercher, Journal of Physics B: Atomic and Molecular Physics 7, L198 (1974).
- Muller et al. (2007) A. Muller, E. B. Flagg, P. Bianucci, X. Y. Wang, D. G. Deppe, W. Ma, J. Zhang, G. J. Salamo, M. Xiao, and C. K. Shih, Phys. Rev. Lett. 99, 187402 (2007).
- Xu et al. (2007) X. Xu, B. Sun, P. R. Berman, D. G. Steel, A. S. Bracker, D. Gammon, and L. J. Sham, Science 317, 929 (2007).
- Muller et al. (2008) A. Muller, W. Fang, J. Lawall, and G. S. Solomon, Phys. Rev. Lett. 101, 027401 (2008).
- Vamivakas et al. (2009) A. N. Vamivakas, Y. Zhao, C.-Y. Lu, and M. Atatüre, Nature Physics 5, 198 (2009).
- Flagg et al. (2009) E. B. Flagg, A. Muller, J. M. Robertson, S. Founta, D. G. Deppe, M. Xiao, W. Ma, G. J. Salamo, and C. K. Shih, Nature Physics 5, 203 (2009).
- Ates et al. (2009a) S. Ates, S. M. Ulrich, S. Reitzenstein, A. Löffler, A. Forchel, and P. Michler, Phys. Rev. Lett. 103, 167402 (2009a).
- Förstner et al. (2003) J. Förstner, C. Weber, J. Danckwerts, and A. Knorr, Phys. Rev. Lett. 91, 127401 (2003).
- Ramsay et al. (2010) A. J. Ramsay, A. V. Gopal, E. M. Gauger, A. Nazir, B. W. Lovett, A. M. Fox, and M. S. Skolnick, Phys. Rev. Lett. 104, 017402 (2010).
- Ulrich et al. (2011) S. M. Ulrich, S. Ates, S. Reitzenstein, A. Löffler, A. Forchel, and P. Michler, Phys. Rev. Lett. 106, 247402 (2011).
- Roy and Hughes (2011a) C. Roy and S. Hughes, Phys. Rev. Lett. 106, 247403 (2011a).
- Majumdar et al. (2011a) A. Majumdar, E. D. Kim, Y. Gong, M. Bajcsy, and J. Vučković, Phys. Rev. B 84, 085309 (2011a).
- Majumdar et al. (2011b) A. Majumdar, A. Papageorge, E. D. Kim, M. Bajcsy, H. Kim, P. Petroff, and J. Vučković, Phys. Rev. B 84, 085310 (2011b).
- Roy and Hughes (2011b) C. Roy and S. Hughes, Phys. Rev. X 1, 021009 (2011b).
- Roy et al. (2012) C. Roy, H. Kim, E. Waks, and S. Hughes, Photon Nanostruct: Fundam Appl, http://dx.doi.org/10.1016/j.photonics.2012.05.004 (2012).
- Akahane et al. (2005) Y. Akahane, T. Asano, B.-S. Song, and S. Noda, Optics Express 13, 1202 (2005).
- Ates et al. (2009b) S. Ates, S. M. Ulrich, A. Ulhaq, S. Reitzenstein, A. Löffler, S. Höfling, A. Forchel, and P. Michler, Nature Photonics 3, 724 (2009b).
- Hohenester et al. (2009) U. Hohenester, A. Laucht, M. Kaniber, N. Hauke, A. Neumann, A. Mohtashami, M. Seliger, M. Bichler, and J. J. Finley, Phys. Rev. B 80, 201311 (2009).
- Winger et al. (2009) M. Winger, T. Volz, G. Tarel, S. Portolan, A. Badolato, K. J. Hennessy, E. L. Hu, A. Beveratos, J. Finley, V. Savona, et al., Phys. Rev. Lett. 103, 207403 (2009).
- Englund et al. (2010) D. Englund, A. Majumdar, A. Faraon, M. Toishi, N. Stoltz, P. Petroff, and J. Vučković, Phys. Rev. Lett. 104, 073904 (2010).
- Hughes et al. (2011) S. Hughes, P. Yao, F. Milde, A. Knorr, D. Dalacu, K. Mnaymneh, V. Sazonova, P. J. Poole, G. C. Aers, J. Lapointe, et al., Phys. Rev. B 83, 165313 (2011).
- Mosor et al. (2005) S. Mosor, J. Hendrickson, B. C. Richards, J. Sweet, G. Khitrova, H. M. Gibbs, T. Yoshie, A. Scherer, O. B. Shchekin, and D. G. Deppe, Appl. Phys. Lett. 87, 141105 (2005).
- Strauf et al. (2006) S. Strauf, M. T. Rakher, I. Carmeli, K. Hennessy, C. Meier, A. Badolato, M. J. A. Dedood, P. M. Petroff, E. L. Hu, E. G. Gwinn, et al., Appl. Phys. Lett. 88, 043116 (2006).
- Tan (1999) S. M. Tan, Journal of Optics B: Quantum and Semiclassical Optics 1, 424 (1999).
- Favero et al. (2007) I. Favero, A. Berthelot, G. Cassabois, C. Voisin, C. Delalande, P. Roussignol, R. Ferreira, and J. M. Gérard, Phys. Rev. B 75, 073308 (2007).
- Ulhaq and et al. (2012) A. Ulhaq and et al., Nature Photonics 6, 238 (2012).
- Quang and Freedhoff (1993) T. Quang and H. Freedhoff, Phys. Rev. A 47, 2285 (1993).