Modelling the spectra of galaxies at redshift 0.4z1.15: the gas physical conditions and the element abundances
Abstract
We revisit the spectra observed by Ramos Almeida et al. (2013) from an homogeneous sample of galaxies at 0.27z1.28 with the aim of finding out the characteristics of the single objects by consistent modelling. In particular we investigate the trend of the most significant physical parameters and of the element abundances with redshift. The observed corrected line ratios cover a relatively large range. Nevertheless the calculated physical conditions are similar to those of active galactic nuclei and of starburst galaxies. For some of the galaxies the dominant photoionizing source is ambiguous. The N/H and O/H relative abundances are close to the solar ones but show a dip at z0.7.
keywords:
radiation mechanisms: general — shock waves — ISM: abundances — galaxies: Seyfert — galaxies: starburst — galaxies: high redshift1 Introduction
The mutual interaction between the nuclear activity and starbursts in galaxies is generally investigated in order to understand star formation processes and epochs as well as the nuclear characteristics. The formation of stars within galaxies at various redshifts depends on the interstellar medium (Spaans & Carollo 1997). They claim that star formation is connected with the heating of gas and dust by the ionizing radiation flux due to feedback mechanisms for instance from supernovae and stellar winds. However collisional processes cannot be neglected.
During major mergers of spiral galaxies at higher redshifts (Springel et al 2005) the collision and mixing of galaxies debris trigger nuclear gas inflow, which leads to energetic starbursts and black hole accretion. The mutual feedback of starbursts (SB) and active galactic nuclei (AGN) modify the galaxy H luminosity because both the SB and the AGN contribute to the total observed LHα . The H emission line flux and the flux of lines corresponding to the other elements emitted from the gas close to the SB and from the gas ionized by the AGN radiation flux are summed up in the characteristic spectra observed at Earth (Contini 2013a).
In this paper we would like to investigate the dominant properties of galaxies at intermediate redshift through the analysis of their spectra, both line and continuum. The higher the redshift the harder is to observe enough spectral lines as to allow a reliable interpretation of the spectra.
Recently, Ramos Almeida et al (2013, hereafter RA13) presented the line and continuum spectra of a sample of galaxies at 0.27z1.28. The observations which refer to different galaxy types all containing an AGN cover a relatively extended intermediate redshift range, providing a rare occasion to investigate the conditions of the gas in AGNs and close to SBs with a high enough precision, as it is generally done for local galaxies.
The analysis of the data presented by RA13 yields interesting results about star formation rates (SFR). In this paper, however, we would like to focus on the gas properties in single objects as a function of the redshift.
Whether the AGN or the starburst SB dominates in each galaxy is investigated in this paper by modelling the observed spectra by two different kinds of models : those characterised by a power-law photoionising flux and those characterised by a black-body radiation flux. It was suggested that galaxies at intermediate and high redshift are mergers originating from collision of galaxies at earlier epochs. Therefore, both photoionization and shocks are accounted for in the calculation of the spectra.
Recently, the spectral energy distribution (SED) of the continuum has been enriched by far infrared observations which contribute to the understanding of the galaxy conditions relative to dust. The shock effect can be recognized from the maximum frequency and intensity of the reprocessed dust radiation peak in the infrared and of the bremsstrahlung at high frequencies of the continuum SED. The models are selected by cross-checking the fit of the continuum SED data by the fit of the observed line ratios. However, only a few objects at high z show enough data throughout the SED to constrain the models, as was demonstrated for local galaxies.
We start by modelling line and continuum spectra observed from galaxies selected from the RA13 sample at 0.4z1.15. They were chosen among those showing the largest number of significant lines. Moreover, RA13 presented also near-IR spectroscopic observations which were used to classify the observed SEDs.
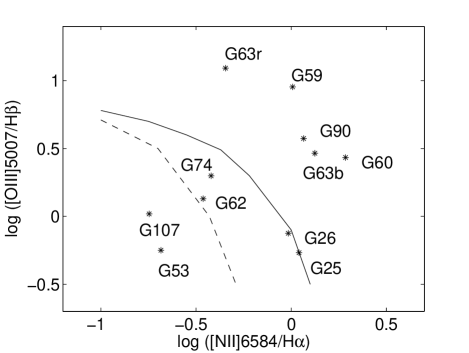
In Fig. 1 the line ratios observed from the selected galaxies are plotted throughout a Baldwin-Phillips-Terlevich (BPT) diagram (Baldwin et al. 1981). Fig. 1 shows that the line ratio ensemble crosses the lines separating AGNs from the HII regions. The grids of calculated line ratios for local merger galaxies by Contini (2012a, fig. 1) show that the domains of AGN and SB in a BPT diagram may overlap.
The paper is organised as follows. A brief description of the calculation code is given in Sect. 2. The intermediate redshift (0.4z1.2) galaxies are analysed considering line ratios to H and continuum spectra in Sect. 3. Discussion and concluding remarks appear in Sect. 4.
2 The calculations
The observed spectra provide the tools for calculating the physical and chemical conditions in galaxies at each redshift. Metallicity (in term of O/H and N/H relative abundances) is calculated from the [OIII]/H, [OII]/H and [NII]/H line ratios. At low redshifts (z0.1) the calculated relative abundances are generally constrained by many lines from different elements in different ionization levels throughout UV-optical-infrared spectra. Photoionization dominated models are used to calculate the temperature of the emitting gas (e.g. Izotov et al. 2006, Stasinska & Izotov 2003). We use composite models accounting for the combined affect of photoionization from the AGN or from the SB and shocks (e.g. Contini 2013a and references therein) which are more adapted to deal with the collisional processes throughout the mergers.
The modelling of the spectra at higher z becomes ambiguous when one or more key lines from both high and low ionization levels are leaking. Therefore, the choice of the models will be dictated by considerations regarding not only the SB or the AGN radiation spectrum, but also the hydrodynamical regime and the galactic cloud structure. Moreover, the observed line ratios are often uncertain due to selection effects, calibration biases and different corrections from obscuration (Gunawardhana et al. 2013). In an accompanying paper (Contini 2013b) we discuss the reliability of the results obtained by modelling spectra showing only a few oxygen to H line ratios.
We have adopted for the calculations of the spectra the code suma111http://wise-obs.tau.ac.il/marcel/suma/index.htm, which simulates the physical conditions in an emitting gaseous cloud under the coupled effect of photoionization from an external radiation source and shocks. The line and continuum emission from the gas are calculated consistently with dust-reprocessed radiation in a plane-parallel geometry (see Contini et al 2012 and references therein for a detailed description of the code).
The input parameters which characterise the model are : the shock velocity , the atomic preshock density , the preshock magnetic field . They define the hydrodynamical field and are used in the calculations of the Rankine-Hugoniot equations at the shock front and downstream. These equations are combined into the compression equation which is resolved throughout each slab of the gas, in order to obtain the density profile downstream and consequently, the temperature of the gas. We adopt for all the models =10-4 gauss. In fact, a higher preshock density is compensated by a higher magnetic field which reduces compression and viceversa. We do not have enough data to avoid degeneration of models choosing between and effects on the density (see Contini 2009).
The input parameter that represents the radiation field in AGNs is the power-law flux from the active center in number of photons cm-2 s-1 eV-1 at the Lyman limit, if the photoionization source is an active nucleus. The spectral indices are =-1.5 and =-0.7. is combined with the ionization parameter by = (/(n c ( -1)) (( - () (Contini & Aldrovandi, 1983), where is H ionization potential and is the high energy cutoff, n the density, the spectral index, and c the speed of light.
If the radiation flux is a black body radiation from the stars, the input parameters are the colour temperature of the star and the ionization parameter (in number of photons per number of electrons at the nebula).
The secondary diffuse radiation emitted from the slabs of gas heated by the shocks is also calculated. The flux from the AGN, from the stars and the secondary radiation flux are calculated by radiation transfer throughout the slabs downstream.
The geometrical thickness of the emitting nebula , the dust-to-gas ratio , and the abundances of He, C, N, O, Ne, Mg, Si, S, A, and Fe relative to H are also accounted for. The distribution of the grain radius downstream is determined by sputtering, beginning with an initial radius of 0.5-2.5 m .
In our models the flux from an external source can reach the shock front (the inflow case, indicated by the parameter =0) or the edge of the cloud opposite to the shock front when the cloud propagates outwards from the AC or from the starburst (outflow, indicated by =1).
The fractional abundances of the ions are calculated resolving the ionization equations considering ionization by the primary flux, the secondary flux and collisional ionization in each slab downstream. The line intensity calculated in each slab depends strongly on the density, temperature, and radiation from both the sides of the cloud. The line intensities are integrated throughout the downstream region up to a distance from the shock front at which the gas has reached a relatively low temperature (T 103 K) in the case of inflow (radiation bound case) or to a distance such that all the calculated line ratios reproduce the observed ones (matter bound case). In the outflow case some iterations are necessary to obtain converging results.
The models which reproduce the observed strong lines within 20% and the weak lines by 50 % are selected from a large grid of models. The sets of input parameters are regarded as results. The approximation of calculated to observed line ratios should account for the observational errors and for the uncertainty of the physical coefficients adopted by the calculation code.
3 The galaxy sample
RA13 presented near-IR (NIR) spectroscopic observations of 28 X-ray and mid-infrared selected sources at median redshift z 0.8 in the Extended Groth Strip : 13 AGN dominated and 15 host-galaxy dominated. New NIR spectra referring to the continuum SEDs of objects at z between 0.4 and 1.25 were reported. Moreover, they show the spectra of an AGN subset at 0.27z 1.28 including H and other key optical lines for each of them.
Following our usual procedure in the analysis of galaxies, we first consider the line ratios because, as demonstrated by Contini (2013 and references therein), the continuum SEDs less constrain the models.
The data reported by RA13 in their table 3 and completed by the data presented in their table 4 were observed by the Long- Slit Intermediate Resolution Infrared Spectrograph (LIRIS) at the 4.2m William Herschel Telescope (WHT) from the Deep Extragalactic Evolutionary Probe 2 (DEEP2). We report in Table 1 the flux of the lines and the FWHM (indicated as F/W0 for each galaxy) of the selected objects. The observed fluxes are in 10-16 erg s-1 cm-2 and the FWHM in . We do not show the errors given by DIPSO, for sake of clarity. Brackets indicate that measurements are from DEEP2 optical spectra. Typical line width uncertainty is 25-30 %.
We have selected 9 out of the 28 galaxies of the RA13 sample which show enough line ratios for a suitable modelling without any risk of degeneracy (see Contini 2013b). G62 was added to the sample because the characteristic parameters are different from those of the other objects, being a simple starburst.
We have corrected the line flux ratios to H from extinction adopting the formula reported by Osterbrock (1974, eq. 7.6) and H0/H0 (at the nebula) = 3 :
H/H=(H0/H0) 10-c(f(Hα)-f(Hβ)),
where f( is the standard interstellar extinction curve (Osterbrock 1974, fig. 7.1).
The spectra lacking the H data (e.g. the red component of the galaxies G53 and G74) were not modelled because the line flux ratios could not be corrected. Both blue and right component spectra of G63 are accounted for.
| ID | z | H | [NII]6584 | H | [OIII]4959 | [OIII]5007 | [SII]6732 | [OII]3727 | [OI]6300 | [OII]7320 |
|---|---|---|---|---|---|---|---|---|---|---|
| F/W | F/W | F/W | F/W | F/W | F/W | F/W | F/W | F/W | ||
| G25 | 0.761 | 1.48 /340 | 1.16 / 340 | [0.25] / [140] | [:0.07 / [130] | [0.17] / [130] | … / … | ,,, / … | … / … | |
| G26 | 0.808 | 1.03 /280 | 0.72 / 250 | [0.09] / [70] | [:0.05] / [70] | [0.10] / [70] | … /… | … / … | … / … | |
| G53 | 0.72 | 1.47 / 340 | 0.22 / 340 | [0.08] / [75] | [:0.06] / [70] | [:0.06]/ [70] | 0.31 /340 | …. /…. | …. /…. | …. /…. |
| G59 | 0.465 | 1.42 / 230 | 1.05 / 230 | [0.32] / [220] | [1.09] /[210] | [3.46] / [210] | …. /…. | …./…. | …./…. | 1.28/ 210 |
| G60 | 0.484 | 1.14 / 230 | 1.6 / 230 | [0.34] / [170] | [0.30] /[160] | [1.02] / 160] | …. /…. | …. / …. | …. /…. | …./…. |
| G62 | 0.902 | 2.87 /50 | 1.1 /50 | :0.97 /40 | :0.97 /40 | 1.67 /40 | …. /…. | [0.50] / 160 | …. / …. | …../…. |
| G63b | 0.482 | 4.82 / 590 | 4.67 / 590 | [0.07] / [880] | [0.23 / [850] | 0.69 / [840] | …. /…. | …. / …. | 2.09 / 470 | …./…. |
| G63r | 0.482 | 2.39 / 230 | 1.33 / 230 | [0.10] / [180] | [0.52 / [310] | 1.57 / [310] | …. /…. | …. / …. | 2.09 / 470 | …./…. |
| G74 | 0.551 | 5.25 / 280 | 1.29 / 280 | [0.53] / [120] | [0.40] / [65] | 1.2 / [65] | 0.86 / 270 | …. / …. | …./ …. | …./…. |
| G90 | 1.148 | 19.4 / 640 | 16.4 / 640 | 2.58 / 780 | 4.78 / 760 | 14.3 / 750 | …. / …. | 1.63 / 490 | …./ …. | …./…. |
| [0.51] / [320] | …./ …. | …./…. | ||||||||
| G107 | 0.671 | 2.6 / 90 | 1.22 / 90 | [0.37] / [90 | [:0.37] / [85] | [:0.37]/ [85] | …. / …. | …. / …. | …. / …. | …./…. |
| line | Ly | NV | CIV | CIII] | CII] | MgII | [OII] | HeII | [OIII] | [OI] | [NII] | [SII] | [OII] | z |
|---|---|---|---|---|---|---|---|---|---|---|---|---|---|---|
| 1215 | 1240 | 1500+ | 1909+ | 2326+ | 2789 | 3727+ | 4686 | 5007+ | 6300+ | 6584+ | 6720+ | 7320+ | ||
| G90 corr | - | - | - | - | - | - | 1.26 | - | 5. | - | 3.37 | 1.26 | - | 1.148 |
| M90 | 46.7 | 11. | 19. | 8.7 | 4.6 | 1.53 | 1.3 | 0.11 | 5.2 | 0.42 | 3.3 | 0.2 | 2.3 | |
| Mz90 | 28.4 | 0.13 | 0.03 | 0.05 | 0.07 | 0.6 | 0.9 | 0.0026 | 4.5 | 0.018 | 3. | 1.3 | 0.1 | |
| G62 corr | - | - | - | - | - | - | 0.5-0.24 | - | 2.65 | - | 1.1 | - | - | 0.902 |
| Mz62 | 23.5 | 0.0003 | 0.56 | 0.75 | 0.12 | 0.32 | 0.56 | 0.005 | 2.86 | 0.0003 | 0.71 | 0.03 | 0.01 | |
| G26 corr | - | - | - | - | - | - | - | - | 1. | - | 2.8 | - | - | 0.808 |
| M26 | 35.6 | 2.0 | 5.9 | 2.55 | 1.74 | 1.65 | 0.75 | 0.1 | 0.99 | 0.26 | 3. | 0.34 | 0.48 | |
| Mz26 | 31.9 | 0.2 | 0.25 | 0.16 | 0.24 | 0.58 | 0.47 | 0.0004 | 0.94 | 0.07 | 3. | 0.3 | 0.22 | |
| G25 corr | - | - | - | - | - | - | - | - | 0.72 | - | 3.19 | - | - | 0.761 |
| M25 | 37.6 | 2.0 | 5.67 | 2.33 | 2. | 2.1 | 0.66 | 0.11 | 0.77 | 0.89 | 3.3 | 0.95 | 0.45 | |
| Mz25 | 31.9 | 0.23 | 0.27 | 0.17 | 0.25 | 0.56 | 0.37 | 0.0004 | 0.8 | 0.063 | 3.1 | 0.3 | 0.48 | |
| G53 corr | - | - | - | - | - | - | - | - | 0.75 | - | 0.6 | 0.04 | - | 0.72 |
| M53 | 36.9 | 1.2 | 12.8 | 4.4 | 2.12 | 1.4 | 0.37 | 0.05 | 0.83 | 0.48 | 0.58 | 0.06 | 0.3 | |
| Mz53 | 32.4 | 0.05 | 0.39 | 0.25 | 0.46 | 1.15 | 0.48 | 0.0006 | 0.8 | 0.09 | 0.58 | 0.02 | 0.21 | |
| G107 corr | - | - | - | - | - | - | - | - | 1.39 | - | 0.52 | - | - | 0.67 |
| M107 | 33.6 | 0.016 | 4.5 | 2.6 | 2.14 | 2.15 | 1.4 | 0.13 | 0.75 | 0.49 | 0.63 | 0.12 | 0.29 | |
| Mz107 | 29.5 | 0.0017 | 0.35 | 0.28 | 0.36 | 1.1 | 1.46 | 0.00032 | 1.16 | 0.078 | 0.5 | 0.06 | 0.28 | |
| G74 corr | - | - | - | - | - | - | - | - | 1.8 | - | 1. | 0.45 | - | 0.551 |
| M74 | 37.3 | 1.6 | 6.65 | 3. | 1.2 | 1.6 | 0.86 | 0.06 | 1.76 | 1. | 1.6 | 0.4 | 1. | |
| Mz74 | 32.8 | 0.04 | 0.096 | 0.1 | 0.23 | 0.7 | 0.4 | 0.00013 | 1.7 | 0.22 | 1.17 | 0.45 | 0.19 | |
| G60 corr | - | - | - | - | - | - | - | - | 3.62 | - | 5.6 | - | - | 0.484 |
| M60 | 32.4 | 0.74 | 1.86 | 1.28 | 1.34 | 1.35 | 3.5 | 0.177 | 3.6 | 0.58 | 5.07 | 0.6 | 0.85 | |
| Mz60 | 30.6 | 0.096 | 0.11 | 0.12 | 0.127 | 0.8 | 0.49 | 0.0004 | 3.1 | 0.024 | 2.08 | 0.44 | 0.13 | |
| G63b corr | - | - | - | - | - | - | - | - | 3.89 | 0.19 | 3.86 | - | - | 0.482 |
| M63b | 35.8 | 3.8 | 8.34 | 4.19 | 2.22 | 1.18 | 2. | 0.13 | 3.85 | 0.21 | 3.6 | 0.26 | 1.2 | |
| Mz63b | 31. | 0.012 | 0.026 | 0.1 | 0.17 | 0.77 | 0.59 | 0.047 | 3.8 | 0.006 | 3.84 | 0.2 | 0.2 | |
| G63r corr | - | - | - | - | - | - | - | - | 16.5 | 3.18 | 1.31 | - | - | 0.482 |
| M63r | 28.0 | 0.27 | 1.47 | 2.1 | 1.25 | 1.04 | 5.8 | 0.31 | 15.6 | 0.08 | 2.11 | 0.44 | 0.73 | |
| Mz63r | 36.3 | 0.03 | 2.64 | 1.69 | 0.25 | 11.6 | 1. | 0.97 | 16.3 | 0.12 | 1.38 | 2.6 | 0.22 | |
| G59 corr | - | - | - | - | - | - | - | - | 12. | - | 2.95 | - | 2.5 | 0.465 |
| M59 | 51.6 | 12.3 | 42. | 20. | 7.5 | 1.1 | 6. | 0.1 | 11.9 | 0.28 | 3.2 | 0.6 | 3.2 | |
| Mz59 | 34.7 | 0.04 | 0.7 | 0.85 | 0.29 | 6.57 | 0.93 | 0.78 | 12.6 | 0.26 | 2.5 | 1.3 | 0.33 |
| model | O/H | N/H | Habs | nH | z | ||||
|---|---|---|---|---|---|---|---|---|---|
| units1 | 1016 cm | 10-4 | 10-4 | 104 | - | ||||
| M90 | 700 | 800 | 2. | 0.2 | 6.6 | 1.2 | 0.016 | 10. | 1.148 |
| M26 | 200 | 1300 | 2. | 0.00584 | 3. | 0.8 | 0.043 | 5.5 | 0.808 |
| M25 | 250 | 1300 | 2. | 0.17 | 3. | 0.8 | 0.054 | 7.2 | 0.761 |
| M53 | 350 | 1000 | 0.8 | 0.37 | 2. | 0.2 | 0.03 | 7. | 0.72 |
| M107 | 100 | 1000 | 0.8 | 1.67 | 2. | 0.1 | 0.023 | 1.6 | 0.67 |
| M74 | 280 | 1600 | 2. | 0.073 | 6.6 | 0.6 | 0.047 | 11. | 0.551 |
| M60 | 200 | 650 | 2. | 0.18 | 6.6 | 1. | 0.045 | 2. | 0.484 |
| M63b | 600 | 500 | 2. | 0.3 | 6.6 | 1. | 0.02 | 4.5 | 0.482 |
| M63r | 200 | 330 | 2. | 0.6 | 6.6 | 0.5 | 0.03 | 0.74 | 0.482 |
| M59 | 260 | 600 | 0.5 | 0.145 | 6.6 | 0.7 | 0.0024 | 4.5 | 0.465 |
1 in 1010 photons cm-2s-1eV-1 at the Lyman limit
| model | log | O/H | N/H | Habs | nH | z | ||||
|---|---|---|---|---|---|---|---|---|---|---|
| 104 K | - | 1016cm | 10-4 | 10-4 | 104 | - | ||||
| Mz90 | 400 | 300 | 4.3 | -0.12 | 2. | 8.4 | 3.2 | 0.54 | 1.4 | 1.148 |
| Mz62 | 80 | 50 | 4.5 | -1.22 | 80. | 2. | 1.2 | 0.003.6 | 0.0167 | 0.902 |
| Mz26 | 200 | 1300 | 4. | -1.1 | 0.6 | 6.6 | 2. | 0.63 | 5.9 | 0.808 |
| Mz25 | 200 | 1300 | 4. | -1.15 | 0.6 | 6.6 | 2. | 0.58 | 5.9 | 0.761 |
| Mz53 | 350 | 1000 | 4. | -0.96 | 1. | 5. | 0.3 | 0.69 | 7.3 | 0.72 |
| Mz107 | 100 | 1000 | 4. | -1.52 | 1. | 6.6 | 0.2 | 0.18 | 1.86 | 0.67 |
| Mz74 | 280 | 1000 | 4. | 0.48 | 100. | 6.6 | 1. | 1.85 | 5.8 | 0.551 |
| Mz60 | 250 | 750 | 4. | -0.30 | 0.9 | 6.6 | 2. | 0.93 | 3.4 | 0.484 |
| Mz63b | 560 | 500 | 4. | -0.30 | 0.6 | 8. | 3.5 | 0.87 | 4. | 0.482 |
| Mz63r | 250 | 400 | 6. | 1.78 | 8 | 6.6 | 1.5 | 1.54 | 1.3 | 0.482 |
| Mz59 | 280 | 600 | 7. | 1.08 | 9. | 7.6 | 2. | 1.92 | 2.7 | 0.465 |
3.1 The modelling procedure
At the first glance, RA13 table 3 shows that the FWHM are relatively high ( 200 ), except for G62. The velocities are in the range of those observed in the NLR of Seyfert 2 galaxies (200-1000 Contini & Viegas 2001) and of LINERs (100-300 Contini 1997). Most probably the galaxies at relatively high z are the result of mergers, justifying the use of composite models which account for the radiation flux and for the shocks.
First, we have modelled the spectra of the galaxies showing the largest number of lines, checking whether they were enough to constrain the models (Contini 2013b). Then, we have reproduced the spectra observed from the other objects where at least H, H, [OIII] 5007+ (the + indicates that [OIII] 5007 and 4959 are summed up) and [NII] 6548+ (the + indicates that [NII] 6548 and 6584 are summed up) were observed.
The calculations show that H/H 2.8- 3 refers to a gas in normal conditions of density ( 106 ) and temperature ( 103 - 106 K) (Osterbrock 1974).
Constraining the shock velocity by the FWHM we chosed the other input parameters such as to obtain the best fit to the observed [OIII]/H. The other line ratios (e.g. [NII]/H) are consistently calculated by the code adopting as a first guess the solar abundances (Allen 1976). We then changed the N/H relative abundance in order to fit both [OIII]/H and [NII]/H. Recall that the line intensity fluxes affect the cooling rate downstream and in turn also the [OIII]/H result. So [OIII]/H and [NII]/H were cross checked changing the input parameters until the best fit was achieved for both the line ratios. Some spectra in the sample report the data for other lines, such as [OII] 7320+, [SII]6717+6731, or [OII] 3727+ which were used to further constrain the models.
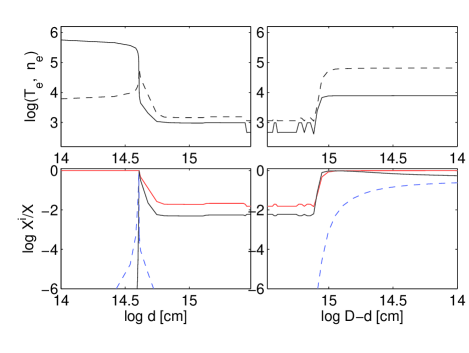
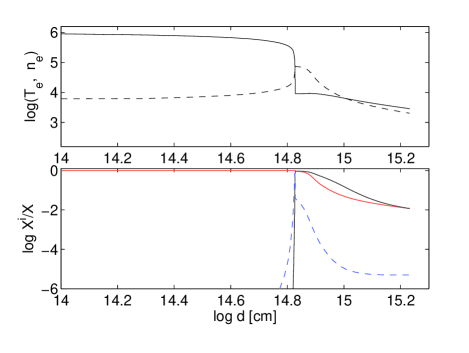
To understand the trend of the line ratios emitted from the clouds, we show in Figs 2 and 3 the profile of the electron density, of the electron temperature and of the O++/O, N+/N and H+/H ion fractional abundances across the clouds in the galaxy G25. In Fig. 2 the cloud is divided in two halves with logarithmic X-axis scales (direct in the left panel and reverse in the right panel) in order to show the critical regions at the edges of a cloud propagating outwards from the starburst. The shock front is on the left of the left panel, while the black-body flux from the star reaches the right edge of the right panel. Fig 3. shows the case of a cloud infalling towards the AGN. The shock front is on the left and the power-law radiation flux from the AGN reaches the very shock front. Figs. 2 and 3 show that the [OIII] lines are result from integration throughout regions of gas at different temperatures and densities.
The results will change by varying even slightly one of the input parameters. Spectra containing only [OIII]5007+/H and [OII]3727+/H (the + indicates that the doublet is summed up) could lead to degeneracy of results, in particular for the O/H relative abundance (Contini 2013b).
In Table 2 we compare the calculated with observed line intensity ratios to H, corrected for extinction. We have ordered the galaxies by their redshift. Below each row containing the observed line ratios two rows showing the model results follow. The row next to the data contains models M25-M107 referring to the AGN (Table 3). In the next row models Mz25- Mz107 refer to the SB (Table 4).
The input parameters which lead to the best fit of the line ratios are presented in Tables 3 and 4 for the AGN and for the SB models, respectively. Tables 3 and 4 show that the relative abundances of O/H and N/H vary from object to object. The abundances relative to H for the other elements whose lines do not appear in the spectra are assumed to be solar (Allen 1976). In columns 8 and 9 of Tables 3 and 4 we report for each galaxy the calculated H absolute flux and the hydrogen density which results after compression of the gas downstream.
We have included in Table 2 some of the most significant line ratios in the optical and UV ranges, even if they are not observed. They can give some information of the Ly line intensities in galaxies at relatively high z. Interestingly, the range of the Ly /H line ratios calculated by the models fitting the RA13 sample at z 0.8 is similar to that of the observations in the different location of Mrk 3 (z=0.0135) by Collins et al (2009). Notice that the OV 1215 line can be strongly blended with Ly . The ratio of the CIV/CIII]/CII] lines are significant as well. Our results show that C/H is eventually depleted from the gaseous phase, because the calculated CIV/Hseems extremely high adopting a solar C/H.
| d1 | rAGN2 | rSB2 | Tbb | type3 | |||
|---|---|---|---|---|---|---|---|
| G25 | 3.04 | -12. | 3. | -12.5 | 1.7 | 3000 | NG |
| G26 | 3.23 | -11.9 | 3.6 | -12.5 | 1.8 | 3000 | SB dom |
| G53 | 2.88 | -12.1 | 2.6 | -12.7 | 1.29 | 2000 | Type 2 |
| G59 | 1.86 | -11.6 | 2.95 | -13.5 | 0.33 | 3000 | NG |
| G60 | 1.94 | -11.4 | 3.87 | -12.9 | 0.69 | - | Type 2 |
| G63b | 1.93 | -11.1 | 5.44 | -12.1 | 1.7 | - | Type 1 |
| G63r | 1.93 | -10.9 | 6.8 | -12.5 | 1.08 | - | Type 1 |
| G74 | 2.20 | -11.9 | 2.47 | -12.6 | 1.1 | 2000 | NG |
| G90 | 4.59 | -13. | 1.45 | -11.9 | 5.1 | 1000 | SB cont |
| 300 | |||||||
| G107 | 2.68 | -11.2 | 6.73 | -11.95 | 2.84 | 2000 | NG |
1 in 103 Mpc ; 2 in kpc ; 3 NG (normal galaxy); SB dom (SB dominated); Type 2 (Seyfert 2 like); Type 1 (Seyfert 1 like); SB cont (SB contaminated) (RA13, sect. 2).
3.2 Results obtained by modelling the RA13 line spectra
We consider that both the AGN and the SB coexist in the RA13 sample galaxies. The parameter sets which best reproduce the observed line ratios for each galaxy are presented in Tables 3, 4 and Fig. 4. The tables show that the preshock densities are rather high ( 1000 ) compared to those of galaxies at z 0.1 . In particular, they resemble calculated in the NGC 3393 merger Seyfert 2 galaxy at z=0.0125. It was explained by Contini (2012a) that relatively high preshock densities may indicate that a shock wave originating at collision of merging galaxies has compressed the gas throughout the NLR.
The preshock densities in the present galaxy sample follow an increasing trend with increasing z. The range of the shock velocity is the same for AGN and SB dominated models because the velocities were calculated on the basis of the FWHM of the line profiles.
The photoionizing flux from the AGN is rather constant but the ionization parameter calculated by the starburst models decreases for z increasing from 0.4 to 0.8.
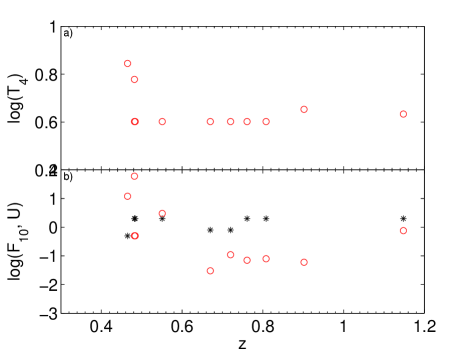
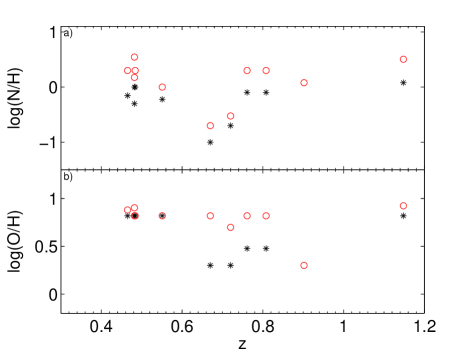
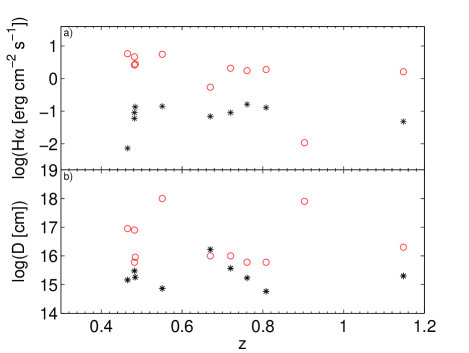
The O/H relative abundances are mostly solar (adopting 6.6 10-4 Allen 1976, 8.5 10-4 refers to Anders & Grevesse 1989) in the gas heated and ionized by the starburst (Table 4), while N/H ranges from 3 times solar (G63 and G90) to a minimum of 0.2 solar in G107. Some of the galaxies (G25, G26) show O/H 0.5 solar in the neighborhood of AGNs and almost solar O/H in other AGN except for G53 and G107 at z=0.72 and 0.67, respectively, which also show N/H lower than solar by factors of 3 and 5. The gaseous clouds present in average a higher fragmentation (indicated by a smaller geometrical thickness ) in the NLR of the AGN than in the regions close to the starburst. For both AGN and SB, decreases for z increasing from 0.4 to 0.8. The H absolute fluxes calculated at the nebula are lower by a factor of 100 for AGNs than for the SBs.
G62 shows the characteristic parameters different from the bulge observed from the other sample objects (Fig. 3), but similar to those observed by Kobulnik & Zaritsky (1999) from HII regions in compact galaxies (see Contini 2013c, in preparation), so it has been modelled only by a starburst dominated model.
We are dealing with a sample of only ten galaxies. We will compare the results obtained for the RA13 sample at intermediate redshifts with those obtained for galaxies at lower z, such as local merger galaxies, LINERs and local starburst, etc. as well as for galaxies at higher z in an accompanying paper (Contini 2013c, in preparation).
3.3 The continuum SEDs
In the previous sections we have constrained the characteristic parameters of the RA13 sample galaxies by modelling the line spectra. We have referred to models for both AGN and starburst galaxies. We can now analyse the continuum SEDs by the same models. The fit of the data throughout the continuum SED by both the AGN and SB models, can give a hint about the relative importance of the AGN and the SB in each of the objects.
The templates adopted by RA13 in their fig. 2 to explain the observed IR data, were obtained combining the observed continuum SEDs of many objects for each of the sample galaxy. RA13 classified the galaxies as starburst dominated, starburst contaminated, Seyfert 1, Seyfert 2 and normal galaxies
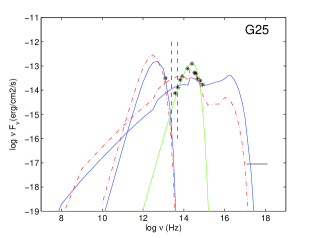
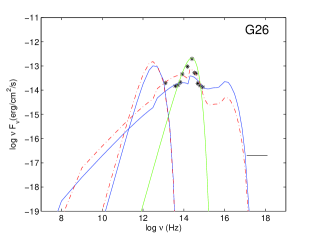
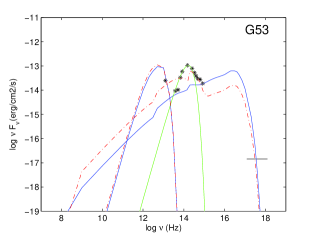
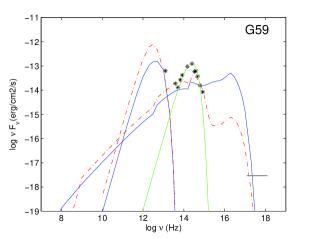
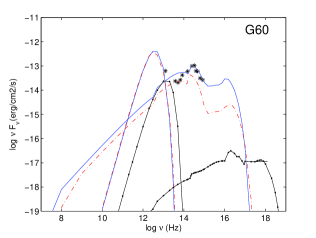
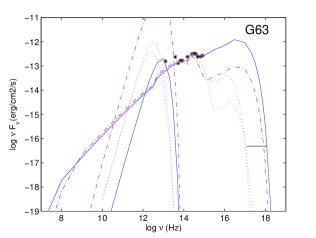
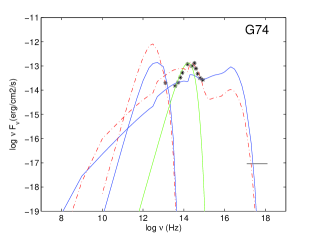
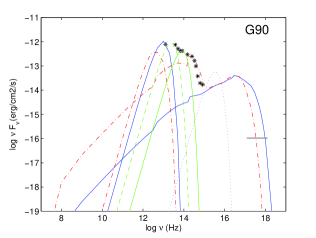
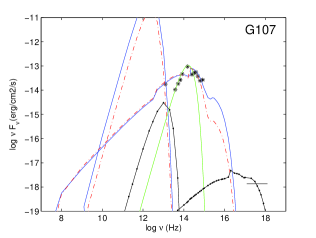
In the present investigation we use a different method, namely, we model each galaxy continuum SED consistently with the models that were constrained reproducing the line ratios. We present our results in Fig. 5, where we show the continuum SEDs on a large frequency range ( between 107 and 1019 Hz) including the radio and X-ray ranges. The radio data are not given by the observations but they can be predicted by the bremsstrahlung calculated by the models. On the other hand, if the radio flux is synchrotron radiation created by the Fermi mechanism at the shock front, a different slope would be observed.
There is now common agreement that there is mutual triggering between the starburst and the AGN activity in the galaxies. So in Fig. 5 diagrams we have included both kinds of models. The data are observed at Earth, while the models are calculated at the nebula. Therefore, model results are compared with the data adopting a readjusting factor (r2= d2 cf) which accounts for the distance of the emitting nebula from the galaxy centre (r), for the distance of the galaxy from Earth (d) and for the cover factor cf. They are reported in Table 5.
In the Fig. 5 diagrams two curves appear for each of the models. One represents the bremsstrahlung emitted from the nebula and the other, peaking in the IR, represents the reprocessed radiation from dust, calculated consistently with the gas continuum emission. The dust grains are heated by collision with the gas and by radiation from the active source. At high temperatures collisional processes dominate, therefore the higher the shock velocity, the higher the frequency of the dust radiation peak. Fig. 5 shows that the datum at 24 m is always reproduced by dust reprocessed radiation. Presently it is the only datum for 10 m , so the peak of the dust reprocessed radiation flux is constrained by one only datum. Dust-to-gas ratios d/g= 4 10-3 were adopted in the present models. The factors for the dust reradiation peak are lower than for those of the bremsstrahlung by factors 10. We suggest that the dust has a patchy distribution. At frequencies referring to wavelengths between 8 and 12 m the large crater of silicate absorption at 10 m should be taken into consideration. Moreover, there is large absorption by ices and HAC at 6 m and 7 mum respectively (Spoon et al 2002). They are included into the band defined by the vertical dashed lines in Fig. 5 (top left panel).
For all the sample galaxies, except for G60, G63 and G90, a black body radiation curve calculated by a single temperature Tbb contribute to the modelling of nearly all the observed data by RA13. The temperature ranges between 2000 and 3000 K for all the galaxies except for G90 where Tbb = 1000 K and Tbb = 300 K are required to finish the fit of the NIR and FIR data, respectively (Table 5). We suggest that a temperature of 1000 K represents the low temperature of the background stars, while a temperature of 300 K can be achieved by dust characterized by large grains which could survive sputtering by a high velocity shock ( 1000-2000 ).
The bremsstrahlung from the high gas contributes to the radiation maximum in the X-ray domain. We have added in Fig. 5 the X-ray fluxes calculated from RA13. It can be seen that in G53, G59, G63, G74 and G90 the models calculated by 200 nicely fit the data, G25 and G26 are at the limit. The two galaxies show components with large FWHM that translate to velocities 1500 and 800, respectively. Those components refer only to H and H, indicating some contribution from the broad line region. Therefore the spectra cannot be properly reproduced with the present models.
Notice that the high frequency region in the SEDs is determined by the shock velocity. The stronger the shock, the higher the temperature in the immediate post shock region downstream. Therefore we added in G60 and G107 diagrams the SED of shock dominated models calculated with a high in order to fit the X-ray data. In G26 the high shock component is not observed. Perhaps the broad profile of weak lines is hidden by the continuum noise.
In Table 5 we summarize the results which appear from Fig. 5. In column 2 the distances of the galaxies in Mpc are given, The factors followed by the radius r calculated for AGNs and SBs, respectively, are presented in columns 3-6. In column 7 the temperature of the background stars is reported followed by the galaxy classification type by RA13.
4 Discussion and concluding remarks
We have analysed the spectra presented by RA13 for a sample of galaxies at redshift 0.27z 1.28. Only ten galaxies were selected because they showed line ratios which could constrain the modelling interpretation.
The results of model calculations show that G59, G60, G63 are most likely AGN dominated, G62 is SB dominated while the other galaxies are ambiguously defined by the line ratios presented in RA13 spectra. The continuum SEDs show that most of the data cover the frequency range corresponding to the old star background with temperature of 2000-3000 K therefore the modelling is less defined. The SEDs confirm that G60 and G63 are AGN dominated. G26 seems also AGN dominated. Most of the objects in the RA13 sample show that an AGN and a SB coexist in the galaxy.
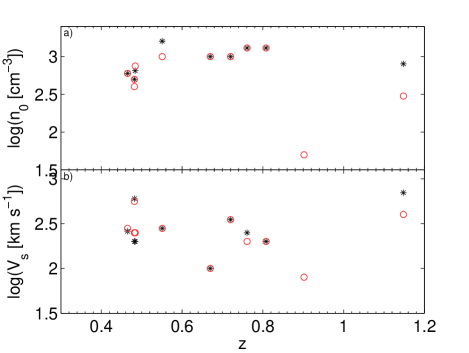
We were particularly interested in the distribution of the emitting gas physical conditions and relative abundances throughout the redshift. Fig. 4 shows that the shock velocities and the preshock densities have opposite trend in agreement with Rankine-Hugoniot equation for mass conservation at the shockfront. A dip at z between 0.6 and 0.8 appears for , , and for the N/H and O/H relative abundances indicating that an interfering process has disturbed the evolution of the parameter trends. Notice for instance that fragmentation of the clouds in terms of close to the starburst is gradually decreasing with z decreasing from z= 0.8 to z=0.6. In the meanwhile the N/H abundance dropped, while O/H decreased but less drastically.
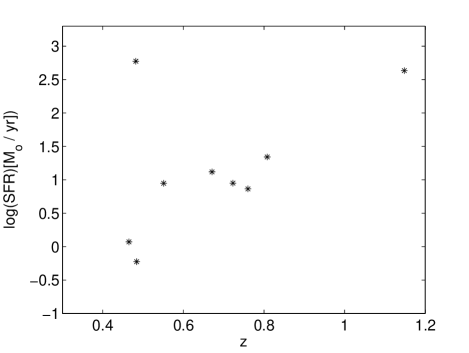
RA13 presented the results of the analysis of the spectra in their table 6. In Fig. 6 we report RA13 calculations showing the SFRs as function of the redshift. In the redshift range covered by the sample selected by our models, SFRs are increasing with z, except for G63b. Notice that the errors which appear in RA13 table 6 are very large.
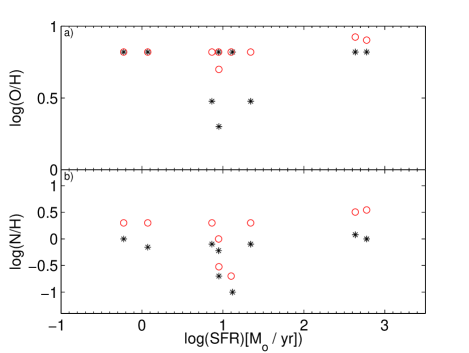
Finally we show in Fig. 7 the metallicities as a function of SFR. There are a few objects which show relatively low O/H relative abundances at SFR 10 M⊙ yr-1. Also N/H has a dip in this SFR range. This could suggest that a process such as strong star formation is starting.
The results of our modelling require a deeper interpretation of the data, which will be possible comparing the results obtained for this galaxy sample with the results which will be obtained by modelling different galaxies throughout a larger frequency range.
References
Allen, C.W. 1976 Astrophysical Quantities, London: Athlone (3rd edition)
Anders E., Grevesse N. 1989, Geochim. Cosmochim. Acta, 53, 197
Baldwin J. A., Phillips M. M., Terlevich R. PASP, 1981, 93, 5
Collins, N.R., Kraemer, S.B., Crenshaw, D.M., Bruhweiler, F.C., Meléndez, M. 2009, ApJ, 694, 765
Contini, M. 2013a, MNRAS, 429, 242
Contini, M. 2013b, MNRAS, submitted
Contini, M. 2012a, MNRAS, 426, 719
Contini, M. 2012b, MNRAS, 425,120
Contini, M. 2009, MNRAS, 399, 1175
Contini, M. 1997, A&A, 323, 71
Contini, M., Aldrovandi, S.M. 1983, A&A, 127, 15
Contini, M., Cracco, V., Ciroi, S., La Mura, G. 2012, A&A, 545, 72
Contini, M., Viegas, S.M. 2001, ApJS, 132, 212
Gunawardhana, M.L.P. et al. 2013MNRAS.tmp.1654
Izotov, Y. I.; Stasińska, G.; Meynet, G.; Guseva, N. G.; Thuan, T. X. 2006, A&A, 448, 955
Izotov, Y. I.; Guseva, N. G.; Fricke, K. J.; Stasińska, G.; Henkel, C.; Papaderos, P. 2010, A&A, 517, 90
Kauffmann, G. et al. 2003, MNRAS, 346, 1055
Kewley, L.J., Dopita, M.A., Sutherland, R.S., Heisler, C.A., Trevena, J. 2001, ApJ, 556, 121
Kobulnicky, H., Zaritsky, D. 1999, ApJ, 511, 118
Osterbrock, D.E. 1974 in ”Astrophysics of Gaseous Nebulae” . ed. W.H. Freeman and Company , San Francisco
Ramos Almeida, C., Rodríguez Espinosa, J.M., Acosta-Pulido, J.A. Alonso-Herrero, A., Pérez García, A.M, Rodríguez-Eugenio, N. 2013, MNRAS, 429, 3449
Spaans, M. & Carollo, C.M. 1997 ApJ, 482, L93
Spoon, H. W. W.; Keane, J. V.; Tielens, A. G. G. M.; Lutz, D.; Moorwood, A. F. M.; Laurent, O. 2000, A&A, 385, 1022
Springel, V., Di Matteo T., Hernsquist, L. 2005, ApJ, 620, L79