Supernova enrichment and dynamical histories of solar-type stars in clusters
Abstract
We use -body simulations of star cluster evolution to explore the hypothesis that short-lived radioactive isotopes found in meteorites, such as 26Al, were delivered to the Sun’s protoplanetary disc from a supernova at the epoch of Solar System formation. We cover a range of star cluster formation parameter space and model both clusters with primordial substructure, and those with smooth profiles. We also adopt different initial virial ratios – from cool, collapsing clusters to warm, expanding associations. In each cluster we place the same stellar population; the clusters each have 2100 stars, and contain one massive 25 M⊙ star which is expected to explode as a supernova at about 6.6 Myr. We determine the number of Solar (G)-type stars that are within 0.1 – 0.3 pc of the 25 M⊙ star at the time of the supernova, which is the distance required to enrich the protoplanetary disc with the 26Al abundances found in meteorites. We then determine how many of these G-dwarfs are unperturbed ‘singletons’; stars which are never in close binaries, nor suffer sub-100 au encounters, and which also do not suffer strong dynamical perturbations.
The evolution of a suite of twenty initially identical clusters is highly stochastic, with the supernova enriching over 10 G-dwarfs in some clusters, and none at all in others. Typically only 25 per cent of clusters contain enriched, unperturbed singletons, and usually only 1 – 2 per cluster (from a total of 96 G-dwarfs in each cluster). The initial conditions for star formation do not strongly affect the results, although a higher fraction of supervirial (expanding) clusters would contain enriched G-dwarfs if the supernova occurred earlier than 6.6 Myr. If we sum together simulations with identical initial conditions, then 1 per cent of all G-dwarfs in our simulations are enriched, unperturbed singletons.
keywords:
stars: formation – kinematics and dynamics – open clusters and associations: general – planetary systems – methods: numerical1 Introduction
One of the outstanding issues in astrophysics is characterising the birth environment of the Solar System (e.g. Adams, 2011). In particular, understanding whether the Sun is an ‘average’ star in terms of its formation and evolution is important for assessing how likely the formation of a quiescent, habitable Solar System is when placed in the context of other planetary systems.
A strong constraint on the formation of our Solar System appears to be the presence of short-lived radioactive isotopes in meteorites originating from the epoch of planet formation (Lee et al., 1976). The short half-life and abundance of such isotopes (inferred from their stable daughter products) argues for their rapid inclusion in meteorites during the early phases of the Solar System (Looney et al., 2006; Thrane et al., 2006).
Short-lived radiogenic isotopes may also be the dominant heat source for forming planetesimals in protoplanetary discs (Urey, 1955; MacPherson et al., 1995). This could affect the survival of volatile elements in the inner region of the Solar System and have implications for planet habitability (Nimmo, 2002).
Several short-lived isotopes with half-lives ranging from tens of days to several Myr are present in meteorites, but two – 26Al and 60Fe – are very difficult to produce without nucleosynthesis in massive stars (e.g. Goswami, 2004). It is possible to produce 26Al through spallation (Lee et al., 1998; Shu et al., 2001) or from evolved asymtotic giant branch (AGB) stars (Busso et al., 1999, 2003), but the presence of 60Fe points toward enrichment from a supernova explosion (see e.g. the discussion in Adams, 2011)111Note that recent work (e.g. Moynier et al., 2011; Tang & Dauphas, 2012) has suggested that the abundance of 60Fe in the early Solar System may not be as high as previously thought, and could be as low as the levels measured in the background interstellar medium..
Following the discovery of 26Al in meteorites, Cameron & Truran (1977) suggested that the Sun could have formed when a supernova explosion triggered the collapse of a star-forming giant molecular cloud (GMC, see also Boss, 1995; Cameron et al., 1995; Boss & Vanhala, 2000; Boss & Keiser, 2012). This scenario requires that the supernova explosion does not destroy the GMC altogether.
Other authors have suggested that whereas 60Fe may be delivered from a supernova, 26Al can also be produced in the winds of evolved massive stars (Gounelle & Meynet, 2012), and that the isotope enrichment occurs in a sequential star formation process. Firstly, 60Fe is delivered to the nearby interstellar medium (ISM) by multiple supernovae from the first generation of star formation. These supernovae then trigger a second generation of star formation in which 26Al is delivered into the ISM by the wind of a single massive star. The Sun is then born in a third generation of star formation within the shell of contaminated ISM material.
Finally, 26Al and 60Fe can be delivered directly to the disc from which the Solar System formed (Chevalier, 2000; Ouellette et al., 2007). In this scenario, the massive star is assumed to form coevally with the Sun, but it evolves faster and the resultant core collapse supernova occurs before the protoplanetary disc has begun to coalesce and form large planetesimals. To obtain the correct enrichment levels, Chevalier (2000) and Ouellette et al. (2007) suggest that the Sun’s protoplanetary disc must have been between 0.1 and 0.3 pc from the supernova (at distances less than 0.1 pc, the supernova is likely to strip away too much of the disc, and beyond 0.3 pc the yield of radioactive isotopes is too low, Adams, 2011).
If the meteorite enrichment occurs during a single supernova explosion, then a 25 M⊙ star is most likely to deliver the relative isotopic abundances (Wasserburg et al., 2006). At first sight, a 25 M⊙ star in close proximity to the Sun may seem unlikely; most stars form in clusters or associations (Lada & Lada, 2003) and there is a relation between the most massive star that can form in a cluster and the mass of the cluster (cf. number of stars) itself (Weidner et al., 2013). Adams & Laughlin (2001) show that when randomly sampling an initial mass function (IMF) a 25 M⊙ star is likely to form in a cluster with at least other stars (the exact number of stars depends on the adopted IMF).
This moderately high expectation value for the number of stars that form in the company of a 25 M⊙ star, coupled with the fact that embedded clusters typically have radii less than several pc (Lada & Lada, 2003), suggests that the birth environment of the Solar System could be rather dense and therefore hostile. UV radiation from massive stars, which would evaporate or truncate the protoplanetary disc (Armitage, 2000; Scally & Clarke, 2001; Adams et al., 2004), and dynamical interactions during close encounters with intermediate and low-mass stars (Bonnell et al., 2001; Adams et al., 2006; Parker & Quanz, 2012) could inhibit planet formation in such an environment.
Several authors have estimated the maximum number of stars in the Sun’s natal cluster that would allow the formation of a 25 M⊙ star, but also not be too hostile for the formation and evolution of the Solar System. For example, Adams & Laughlin (2001); Adams et al. (2006); Dukes & Krumholz (2012) calculate collisional cross sections for the Solar System to undergo disruptive interactions with passing stars and Pfalzner (2013) calculates the likely encounter rates for Sun-like stars in two different types of star forming region; an extremely dense cluster versus a more diffuse OB association. In general these authors find that a cluster with stars would enable the formation of a 25 M⊙ star without dynamical interactions prohibiting the formation of the Solar System – provided that the cluster quickly disperses (Dukes & Krumholz, 2012; Pfalzner, 2013).
However, it remains unclear whether the evolution of a ‘typical’ cluster which forms a 25 M⊙ star does result in supernova enrichment of G-dwarf stars like the Sun, without those G-dwarfs suffering dynamical interactions which would hinder or disrupt planet formation. Previous work on this topic has assumed that if the cluster contains a 25 M⊙ star then enrichment is virtually guaranteed, and instead focuses on whether the encounter history of Sun-like stars in the cluster may be the prohibitive factor in deciding whether the Solar System could form and/or survive. Here, we simultaneously combine the two approaches and determine how many G-dwarfs are within 0.1 – 0.3 pc of the supernova (in order for the disc to have the correct levels of enrichment, Chevalier, 2000; Looney et al., 2006; Ouellette et al., 2007) but do not suffer disruptive dynamical interactions during the course of the cluster’s evolution.
In this paper, we use -body simulations to model the evolution of star clusters that contain exactly one 25 M⊙ star in a cluster with 2000 other stars and determine the number of G-dwarfs that experience the necessary supernova enrichment, where the 25 M⊙ star is expected to go supernova at Myr (e.g. Hirschi et al., 2004). Of those G-dwarfs, we also determine their interaction history within the cluster. We model four different initial cluster set-ups to cover a large range of potential star formation scenarios, but keep the stellar population constant so that stochastic differences in the clusters’ evolution can be identified.
The paper is organised as follows: in Section 2 we describe our method of sampling the IMF to obtain a ‘typical’ cluster, in Section 3 we describe the -body simulations, in Section 4 we describe the results for four different types of cluster initial conditions. We focus on the dynamical histories of enriched G-dwarfs from a representative simulation in Section 5, we provide a discussion in Section 6 and we conclude in Section 7.
2 A ‘typical’ cluster
There are two distinct methods for populating a (model) star cluster with stars from an IMF; random sampling versus sorted sampling. In the first scenario, the mass of the cloud from which stars form is the only upper limit for stellar masses – for example, in very rare scenarios a 100 M⊙ cluster could (mathematically) produce a 100 M⊙ star (e.g. Elmegreen, 2006; Parker & Goodwin, 2007). In the second senario, there is a direct physical dependence between the cluster mass and the most massive star that can form (Weidner & Kroupa, 2006; Weidner et al., 2013). Weidner et al. (2013) claim that the latter scenario is supported by the observation that many clusters follow a relation that is consistent with sorted sampling (though see Maschberger & Clarke, 2008). Such a relation would not be fundamental if massive stars could be definitively shown to form in (relative) isolation, and recent work by Lamb et al. (2010), Bressert et al. (2012) and Oey et al. (2013) have shown many tens of O-type stars to be apparently isolated.
However, the issue of random versus sorted sampling is still the subject of much debate, with Cerviño et al. (2013) claiming that it is statistically impossible to prove one scenario over the other. The discussion is relevant here because sorted sampling implies a minimum number of stars (2000) is required for a cluster to host a 25 M⊙ star. Any G-dwarf enriched by the supernova could then be subject to dynamical interactions in this populous cluster. If a cluster was populated randomly from the IMF, then a 25 M⊙ star could form with very few companions – in this scenario the low probability of this cluster forming could then outweigh the probability of a G-dwarf not suffering perturbing interactions in a more populous cluster.
In this paper we will not consider the dynamical histories of clusters with ‘unusual’ IMFs from random sampling. Instead, we use the results of Monte Carlo experiments from Parker & Goodwin (2007) who randomly sampled a Kroupa (2002) IMF to examine the distribution in cluster mass of clusters that contain only one massive star (17.5 M⊙). The median cluster mass from realisations of a cluster where the most massive star is 25 M⊙ corresponds to 2100 stars, which is also consistent with values expected from the sorted sampling method advocated by Weidner & Kroupa (2006) – compare Figs. 4 and 5 in Parker & Goodwin (2007).
3 Cluster models
We conduct pure -body simulations of four different dynamical scenarios for cluster evolution, characterised by the initial virial ratio , where and are the total kinetic energy and total potential energy of the stars, respectively. We will first discuss clusters in virial equlibrium () with a smooth radial profile. We will then discuss substructured clusters with three different initial virial states; subvirial (‘cool’ – ), virial (‘tepid’ – ) and supervirial (‘warm’ – ).
To obtain an idea of the stochasticity in the simulations, we model 20 different realisations of the same cluster. We retain the same stellar population, but set the positions and velocities of the stellar systems with a different random number each time.
3.1 Dynamical evolution
We evolve the clusters for 10 Myr using the kira integrator in the Starlab package (e.g. Portegies Zwart et al., 1999, 2001). This follows the clusters until they have started to dissolve and hence contribute to the Galactic field population. Parker & Quanz (2012) found that at 10 Myr a significant fraction (20 – 40 per cent) of stars are unbound in similar clusters to those modelled here, and Allison et al. (2010) noted that the more substructured a cluster is, the more likely it is to evaporate on timescales less than 10 Myr. We do not impose an external Galactic tidal field on the clusters, as this will have only a minimal effect in the first 10 Myr. We implement stellar and binary evolution by using the SeBa code (Portegies Zwart & Verbunt, 1996, 2012), also within Starlab, which updates the evolutionary state of stars more frequently than the timestep of the -body integrator. The combination of kira and SeBa enables us to model the clusters as fully collisional systems with accurate stellar evolution (including stellar mergers and binary evolution).
3.2 Smooth clusters in virial equilibrium
We model smooth clusters in virial equilibrium using a Plummer sphere (Plummer, 1911), according to the prescription in Aarseth, Hénon & Wielen (1974). We force the most massive star in the cluster to be at the cluster centre, as mass segregation is observed in several large clusters, and smooth, virialised clusters cannot mass segregate dynamically on short timescales (Bonnell & Davies, 1998). The Plummer spheres have a half-mass radius of 0.4 pc.
3.3 Substructured clusters
We set up substructured clusters using the fractal prescription in Goodwin & Whitworth (2004). This has the advantage that the substructure is described by just one parameter, the fractal dimension . In three dimensions, a highly substructured cluster has a fractal dimension , and a uniformly spherical cluster has . We set up clusters with a moderate level of substructure, with .
The velocities of the stellar systems (be they single or binary) are correlated according to the substructure; stars that are close have similar velocities, whereas distant stars can have very different velocities (Goodwin & Whitworth, 2004). We refer the reader to Goodwin & Whitworth (2004); Allison et al. (2010); Parker et al. (2011) for a fuller description of this cluster set-up method. The fractals have a radius of 1 pc.
We then vary the initial virial ratio of the stars and scale the velocities of the individual stars to the desired virial ratio. In one suite of simulations the clusters are subvirial (), which results in cool collapse during the first 1 Myr (Allison et al., 2010). In this set-up, the most massive stars are placed at random in the fractal – they may subsequently mass-segregate so that the massive stars sink to the cente of the cluster. Another suite of simulations are initially in virial equilibirum () – the initial substructure is subsequently erased through dynamical interactions, but the cluster is not expected to form a central core which is as dense as in the cool-collapse clusters. Finally, we run a suite of simulations where the stars are initially supervirial () – to determine whether supernova enrichment of G-dwarfs can occur if the birth cluster is globally unbound.
3.4 Stellar systems
We place the same population of stellar systems in each cluster to establish that any differences in the evolution of the clusters is due to the random differences in system velocity or position, rather than total mass or different binary properties.
The majority of G-type stars in the Galactic field have a binary companion (Duquennoy & Mayor, 1991; Raghavan et al., 2010). We include binaries in our simulations for the reason that a Sun-like star that experiences the necessary amount of supernova enrichment may not be a suitable Solar System analogue if it is in a close ( au) binary system.
We set the most massive star in the cluster to be 25 M⊙ and then draw the remaining primary masses randomly from a Kroupa (2002) IMF of the form
| (1) |
where = 0.1 M⊙, = 0.5 M⊙, and = 20 M⊙, so that we do not have any other 20 M⊙ (O-type) stars in the clusters.
3.4.1 Binary systems
We set stellar systems up with the binary fraction and orbital parameters observed in the Galactic field. Note that the field is probably a dynamically evolved population; the primordial binary fraction was likely higher, and the period and eccentricity distributions will also have evolved. In principle, it is possible to ‘reverse engineer’ the initial binary population by comparing the observed binary properties in young clusters with simulated clusters (e.g. Parker et al., 2011; King et al., 2012; Geller et al., 2013). However, for the purposes of this paper, we simply wish to impose a lower limit on the number of G-dwarfs that reside in binary systems initially and the field population is a suitable lower-limit; we will discuss this assumption in Section 6.
The field binary fraction decreases as a function of primary mass. Primary masses in the range 0.1 0.47 are M-dwarfs, with a binary fraction of 0.42 (Fischer & Marcy, 1992). K-dwarfs have masses in the range 0.47 0.84 with a binary fraction of 0.45 (Mayor et al., 1992), and G-dwarfs have masses from 0.84 1.2 with a binary fraction of 0.57 (Duquennoy & Mayor, 1991; Raghavan et al., 2010). All stars more massive than 1.2 M⊙ are grouped together and assigned a binary fraction of unity, as massive stars have a much larger binary fraction than low-mass stars (e.g. Abt et al., 1990; Mason et al., 1998; Kouwenhoven et al., 2005, 2007; Pfalzner & Olczak, 2007; Mason et al., 2009, and references therein). If a random number exceeds the binary fraction of the primary mass, a secondary mass is drawn from a flat mass ratio distribution (Reggiani & Meyer, 2011).
The periods of binary systems in the field are observed to have a log-normal distribution (Duquennoy & Mayor, 1991; Raghavan et al., 2010) of the form
| (2) |
where , and is in days.
The eccentricities of binary stars are drawn from a thermal distribution (Heggie, 1975) of the form
| (3) |
In the sample of Duquennoy & Mayor (1991), close binaries (with periods less than 10 days) are almost exclusively on tidally circularised orbits. We account for this by reselecting the eccentricity of a system if it exceeds the following period-dependent value :
| (4) |
We combine the primary and secondary masses of the binaries with their semi-major axes and eccentricities to determine the relative velocity and radial components of the stars in each system.
We continue this procedure until the cluster has 2100 stars, which corresponds the median cluster mass from realisations of a cluster where the most massive star is 25 M⊙ (Parker & Goodwin, 2007). The next nine most massive stars in this cluster range from 7 – 13 M⊙, and the cluster contains a total of 96 G-dwarfs. The single stars and binaries are then placed randomly at a system position in the fractal or Plummer sphere.
4 Cluster evolution
In this Section, we consider four different sets of initial conditions for star cluster formation and follow the subsequent dynamical evolution for 10 Myr. For each cluster, we determine the number of G-dwarfs, , that are within 0.1 – 0.3 pc of the the supernova and therefore experience the required levels of isotope enrichment observed in Solar System meteorites (Chevalier, 2000; Ouellette et al., 2007). Of these G-dwarfs, we then determine how many are either in close (100 au) binary systems, or suffer a close (100 au) encounter that could affect the outer regions of the Solar System (Adams & Laughlin, 2001; Adams et al., 2006; Dukes & Krumholz, 2012). We label the number of these enriched ‘singletons’ (Malmberg et al., 2007) . Finally, we might expect that a large velocity perturbation could disrupt planet formation (or a young system of planets). We therefore count the number of enriched singletons that do not suffer a velocity kick greater than 1km s-1 (the typical velocity dispersion in a bound embedded cluster) as being dynamically unperturbed, .
In Section 5 we will show the dynamical histories of several enriched G-dwarfs in a representative simulation, but in this Section we focus on whether the numbers of enriched G-dwarfs depend on the different adopted initial conditions for star formation.
4.1 Smooth, virial clusters
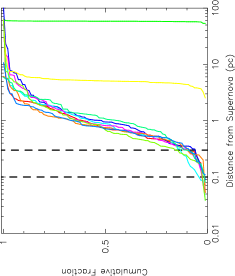
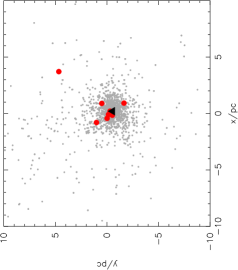
We show the typical morphology of a smooth Plummer-sphere cluster at 0 Myr (Fig. 1(a)) and at the supernova time (6.63 Myr – Fig. 1(b)). The black triangle indicates the position of the supernova progenitor at each time. The cumulative distributions of distances from the supernova for all 96 G-dwarfs for 10 clusters is shown in Fig. 1(c). The 0.1 – 0.3 pc ‘Goldilocks zone’ for enrichment of our own Solar System is between the two vertical dashed lines.
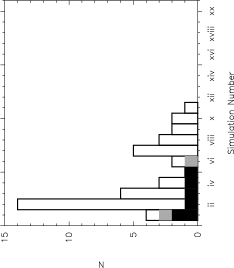
As one might expect, the smooth Plummer-sphere clusters in virial equilibrium follow very similar evolutionary patterns. They all retain a smooth, centrally concentrated morphology. However, the number of enriched G-dwarfs does vary between clusters, as does the number of enriched, unperturbed singletons . In Fig. 1(d) we show the distribution of in all twenty simulations by the open histogram, the distribution of by the grey histogram and the distribution of by the black histogram. Note that the simulations are sorted by , then and then .
Firstly, 5/20 clusters do not contain any enriched G-dwarfs. This is mainly due to the supernova progenitor interacting with the other massive stars in the cluster and being ejected; however, in one cluster (number (xx) in Table 1) the 25 M⊙ star merges with a 5 M⊙ star and the product does not explode as a supernova before the end of the simulation.
In the 15 simulations where we do have supernova enrichment, the number of enriched G-dwarfs, , varies between 2 and 13 (from a total of 96 G-dwarfs). 14/20 clusters contain between 1 and 6 enriched stars that are singletons and 11/20 clusters contain 1, 2, or 3 enriched singletons that are unperturbed. We summarise the results in Table 1.


| sim. no. | ||||
|---|---|---|---|---|
| (i) | 5 | 3 | 3 | |
| (ii) | 13 | 6 | 2 | |
| (iii) | 8 | 4 | 2 | |
| (iv) | 13 | 3 | 2 | |
| (v) | 8 | 3 | 2 | |
| (vi) | 7 | 3 | 2 | |
| (vii) | 4 | 2 | 2 | |
| (viii) | 8 | 5 | 1 | |
| (ix) | 12 | 4 | 1 | |
| (x) | 7 | 4 | 1 | |
| (xi) | 4 | 3 | 1 | |
| (xii) | 8 | 2 | 0 | |
| (xiii) | 5 | 1 | 0 | |
| (xiv) | 2 | 1 | 0 | |
| (xv) | 4 | 0 | 0 | |
| (xvi)a | 0 | 0 | 0 | |
| (xvii)a | 0 | 0 | 0 | |
| (xviii)b | 0 | 0 | 0 | |
| (xix)b | 0 | 0 | 0 | |
| (xx)c | 0 | 0 | 0 |
aSupernova progenitor ejected after interaction with massive binary.
bSupernova progenitor ejected after interactions with other massive stars.
cNo supernova: 25 M⊙ star merged with 5 M⊙ star at 5.73 Myr.
4.2 Substructured, subvirial clusters
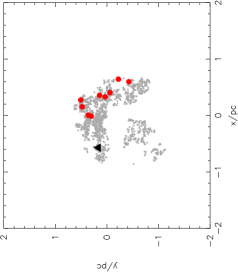
We show the typical morphology of a substructured, subvirial cluster at 0 Myr (Fig. 2(a)) and at the supernova time (6.63 Myr – Fig. 2(b)). The black triangle indicates the position of the supernova progenitor each time. We see that the initial substructure has been completely erased, and the cluster has now assumed a smooth, centrally concentrated profile with a dense core. The most massive stars have dynamically mass segregated and are at the centre of the cluster, implying that the G-dwarfs that are enriched by the supernova must pass through the centre of the cluster at least once.


| sim. no. | ||||
|---|---|---|---|---|
| (i) | 7 | 4 | 3 | |
| (ii) | 8 | 2 | 2 | |
| (iii) | 8 | 7 | 1 | |
| (iv) | 10 | 3 | 1 | |
| (v) | 8 | 3 | 1 | |
| (vi) | 3 | 2 | 1 | |
| (vii) | 9 | 2 | 0 | |
| (viii) | 6 | 1 | 0 | |
| (ix) | 5 | 1 | 0 | |
| (x) | 10 | 0 | 0 | |
| (xi) | 4 | 0 | 0 | |
| (xii) | 4 | 0 | 0 | |
| (xiii)a | 0 | 0 | 0 | |
| (xiv)b | 0 | 0 | 0 | |
| (xv)b | 0 | 0 | 0 | |
| (xvi)c | 0 | 0 | 0 | |
| (xvii)c | 0 | 0 | 0 | |
| (xviii)d | 0 | 0 | 0 | |
| (xix)d | 0 | 0 | 0 | |
| (xx)d | 0 | 0 | 0 |
aSupernova progenitor ejected after interaction with massive binary.
bSupernova progenitor ejected after interactions with other massive stars.
cSupernova progenitor ejected from unstable Trapezium-like system.
dNo G-dwarfs between 0.1 – 0.3 pc from the supernova due to the cluster’s rapid expansion.
Substructured clusters evolve very stochastically, especially those undergoing cool collapse (Allison et al., 2010; Parker & Goodwin, 2012). The violent relaxation process these clusters undergo can lead to the ejection of massive stars, often after they have become the member of an unstable Trapezium-like system (Allison & Goodwin, 2011).
The cumulative distributions of distances from the supernova for all 96 G-dwarfs for 10 clusters is shown in Fig. 2(c). The 0.1 – 0.3 pc ‘Goldilocks zone’ for enrichment of our own Solar System is between the two vertical dashed lines.
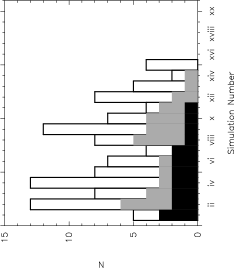
In Fig. 2(d) we show the distribution of in all twenty simulations by the open histogram, the distribution of by the grey histogram and the distribution of by the black histogram.
8/20 clusters do not have any enriched G-dwarfs, often due to the supernova progenitor interacting with the other massive stars in short-lived and unstable Trapezium-like systems, resulting in the ejection of the progenitor. Examples of this are shown in Fig. 2(c) by the green and blue lines on the far right of the panel, which are the cumulative distributions of G-dwarf distances from simulations (xvi) and (xvii) in Table 2.
In the 12 simulations where we do have supernova enrichment, the number of enriched G-dwarfs, , varies between 3 and 10 (from a total of 96 G-dwarfs). 9/20 clusters contain between 1 and 7 enriched stars that are singletons and 6/20 clusters contain 1, 2, or 3 enriched singletons that are unperturbed, . We summarise the results in Table 2.
4.3 Substructured, virial clusters
We show the typical morphology of an initially substructured, virialised cluster at 0 Myr (Fig. 3(a)) and at the supernova time (6.65 Myr – Fig. 3(b)). The black triangle indicates the position of the supernova progenitor each time. The majority of these clusters lose substructure within the first few Myr of evolution, although one cluster (number (xx) in Table 3) retains substructure in the sense that it forms a ‘binary cluster’ – a cluster with two distinct groups of stars.
Substructured, virialised clusters are also dense enough to eject the supernova progenitor – again, usually from unstable Trapezium-like systems. The binary cluster (xx) is not dense enough to have any G-dwarfs in the 0.1 – 0.3 pc enrichment range, although as we will see in the case of supervirial clusters, the formation of a binary cluster does not preclude enrichment.
The cumulative distributions of distances from the supernova for all 96 G-dwarfs for 10 clusters is shown in Fig. 3(c). The 0.1 – 0.3 pc ‘Goldilocks zone’ for enrichment of our own Solar System is between the two vertical dashed lines.
In Fig. 3(d) we show the distribution of in all twenty simulations by the open histogram, the distribution of by the grey histogram and the distribution of by the black histogram.
7/20 clusters do not have any enriched G-dwarfs. In the 13 simulations where we do have supernova enrichment, the number of enriched G-dwarfs, , varies between 1 and 13 (from a total of 96 G-dwarfs). 11/20 clusters contain between 1 and 4 enriched stars that are singletons and 5/20 clusters contain 1, 3, or 4 enriched singletons that are unperturbed. We summarise the results in Table 3.


| sim. no. | ||||
|---|---|---|---|---|
| (i) | 5 | 4 | 4 | |
| (ii) | 15 | 3 | 3 | |
| (iii) | 13 | 3 | 1 | |
| (iv) | 6 | 3 | 1 | |
| (v) | 5 | 3 | 1 | |
| (vi) | 8 | 2 | 0 | |
| (vii) | 8 | 2 | 0 | |
| (viii) | 5 | 2 | 0 | |
| (ix) | 3 | 2 | 0 | |
| (x) | 3 | 2 | 0 | |
| (xi) | 1 | 1 | 0 | |
| (xii) | 2 | 0 | 0 | |
| (xiii) | 1 | 0 | 0 | |
| (xiv)a | 0 | 0 | 0 | |
| (xv)b | 0 | 0 | 0 | |
| (xvi)c | 0 | 0 | 0 | |
| (xvii)c | 0 | 0 | 0 | |
| (xviii)c | 0 | 0 | 0 | |
| (xix)c | 0 | 0 | 0 | |
| (xx)d | 0 | 0 | 0 |
aSupernova progenitor ejected after interaction with massive binary.
bSupernova progenitor ejected after interactions with other massive stars.
cSupernova progenitor ejected from unstable Trapezium-like system.
dNo G-dwarfs between 0.1 – 0.3 pc from the supernova due to fractal evolving into an extended binary cluster.
4.4 Substructured, supervirial clusters
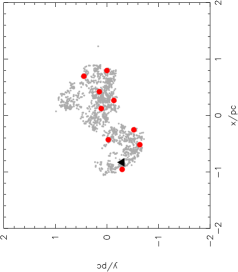
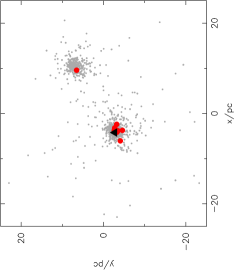
We show the typical morphology of an initially substructured, supervirial cluster at 0 Myr (Fig. 4(a)) and at the supernova time (6.64 Myr – Fig. 4(b)). The black triangle indicates the position of the supernova progenitor each time.
Substructured, supervirial clusters tend to retain some substructure (Parker & Meyer, 2012). In around half of these simulations, a binary cluster forms (Fig. 4(b)) – with the most massive star (i.e. the supernova progenitor) likely to be in one of the binary ‘nodes’. Even though the global motion causes the cluster to expand, these nodes are dense enough for enrichment to occur in around half of the clusters. The remainder of these supervirial fractals expand to form association–like structures, which are too diffuse for the required G-dwarf enrichment (the clusters with in Table 4).
The cumulative distributions of distances from the supernova for all 96 G-dwarfs for 10 clusters is shown in Fig. 4(c). The 0.1 – 0.3 pc ‘Goldilocks zone’ for enrichment of our own Solar System is between the two vertical dashed lines. Binary clusters are betrayed in this plot by the step-like cumulative distributions in some simulations.
In Fig. 4(d) we show the distribution of in all twenty simulations by the open histogram, the distribution of by the grey histogram and the distribution of by the black histogram.
9/20 clusters do not have any enriched G-dwarfs. In the 11 simulations where we do have supernova enrichment, the number of enriched G-dwarfs, , varies between 1 and 14 (from a total of 96 G-dwarfs). 6/20 clusters contain between 1 and 3 enriched stars that are singletons and 5/20 clusters contain 1 or 2 enriched singletons that are unperturbed. We summarise the results in Table 4.


| sim. no. | ||||
|---|---|---|---|---|
| (i) | 4 | 3 | 2 | |
| (ii) | 14 | 1 | 1 | |
| (iii) | 6 | 1 | 1 | |
| (iv) | 3 | 1 | 1 | |
| (v) | 1 | 1 | 1 | |
| (vi) | 2 | 1 | 0 | |
| (vii) | 5 | 0 | 0 | |
| (viii) | 3 | 0 | 0 | |
| (ix) | 2 | 0 | 0 | |
| (x) | 2 | 0 | 0 | |
| (xi) | 1 | 0 | 0 | |
| (xii)a | 0 | 0 | 0 | |
| (xiii)a | 0 | 0 | 0 | |
| (xiv)a | 0 | 0 | 0 | |
| (xv)a | 0 | 0 | 0 | |
| (xvi)a | 0 | 0 | 0 | |
| (xvii)a | 0 | 0 | 0 | |
| (xviii)a | 0 | 0 | 0 | |
| (xix)a | 0 | 0 | 0 | |
| (xx)a | 0 | 0 | 0 |
aNo G-dwarfs between 0.1 – 0.3 pc from the supernova due to fractal evolving into a diffuse association.
5 Dynamical histories
In the previous section we showed the number of G-dwarf stars that were enriched at a distance between 0.1 – 0.3 pc from the supernova () as a function of initial cluster conditions. Of those , we determined the number that were singletons, meaning that they were never in a close binary system, nor did they suffer a sub-100 au encounter. Either scenario would most likely preclude the formation and stable evolution of our Solar System. Finally, we applied a stricter criterion that an enriched singleton suffering a strong velocity perturbation (i.e. in excess of the typical velocity dispersion in a cluster) could also be prohibited from forming a stable Solar System. The number of systems that are enriched singletons that do not suffer such perturbations is .
Here, we focus on the dynamical histories of 3 enriched G-dwarfs in a representative simulation where the cluster is initially substructured and subvirial [number (vi) in Table 2]. Because substructure is erased on short timescales (2 Myr) in subvirial and virial clusters, the subsequent dynamical evolution of the cluster is similar, irrespective of the assumed initial morphology. The only exception is a supervirial (unbound) cluster, which expands and so does not have a well-defined ‘centre’. However, when supernova enrichment does occur in supervirial clusters, the parameters we concentrate on here (nearest neighbour distance to the enriched G-dwarf, velocity perturbations) are similar for all initial morphologies and virial states.
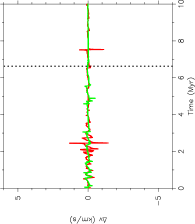
In the chosen simulation, G-dwarfs were enriched by the supernova. In Fig. 5(a) we show the distance to the nearest neighbour of each enriched G-dwarf as a function of time. One of the G-dwarfs is in a close (10 au) binary (the black line), and therefore is not a ‘singleton’ and cannot be an analogue of our own Solar System. The remaining two enriched G-dwarfs have occasional encounters that are of order 500 au. Encounters of this magnitude have been suggested as potential mechanisms to create the high eccentricities of some Edgeworth–Kuiper Belt Objects, such as Sedna (Brasser et al., 2006; Brasser et al., 2012; Schwamb et al., 2010), and so the fact that the G-dwarfs in our simulations undergo sub–1000 au encounters should not hinder planet formation and subsequent orbitial stability.
In Fig. 5(b) we show the distance from the cluster centre for each of the singletons in the simulation. Due to dynamical mass segregation, the supernova progenitor has sunk to the cluster centre before the explosion, and both G-dwarfs are required to be on cluster-centric orbits to enable enrichment. This has two implications for our two enriched singletons. Firstly, they must pass through the cluster centre at least once – during this time their discs could be subject to photoevaporation (e.g. Armitage, 2000; Scally & Clarke, 2001; Adams et al., 2004) from other massive stars, which are also likely to reside in the cluster centre. Inspection of Fig. 5(b) shows that one of our singletons, shown by the red line, passes though the inner 0.5 pc of the cluster centre much more often than the other (shown by the green line). Secondly, at the time of the supernova (shown by the dotted vertical line in all panels), the singletons just happen to be passing through the cluster centre at that instant – they are “in the right place at the right time”.
Finally, we show the change in velocity magnitude for the enriched singletons in Fig. 5(c). One of these singletons experiences velocity kicks in excess of 1 km s-1 (the red line), which we suggest could disrupt planet formation and/or evolution. We note that this enriched singleton also passes through the cluster centre more often, and therefore it is not surprising that it has a more hostile dynamical history than the other enriched singleton in this cluster.


6 Discussion
In Sections 4 and 5 we have presented the results of -body simulations of star cluster evolution in which we have investigated the numbers of Solar-type (G-dwarf) stars that could be enriched in short-lived isotopes by ejecta from the supernova of a 25 M⊙ star. In this scenario a supernova enriches the Sun’s protoplanetary disc with the levels of 26Al and 60Fe found in meteorites from the epoch of planet formation (Lee et al., 1976; Adams, 2011). In order to experience the enrichment levels required without stripping too much of the disc away, the G-dwarf(s) must be within 0.1 – 0.3 pc of the supernova explosion (Chevalier, 2000; Ouellette et al., 2007).
We have varied the initial conditions of the star cluster in an attempt to cover as much parameter space as possible for the initial conditions of star-forming regions that are likely to produce at least one 25 M⊙ star. In our first simulation, we adopt a smooth, virialised Plummer (1911) morphology; this model is unlikely to be representative of the initial conditions of star forming regions, which exhibit a high degree of substructure (e.g. Cartwright & Whitworth, 2004; Sánchez & Alfaro, 2009). However, we expect the evolution of Plummer spheres to be less stochastic than fractal clusters (Parker & Goodwin, 2012), so these simulations provide a useful benchmark comparison to the fractal simulations.
In the remaining three suites of simulations we have created clusters with primordial substructure, and also varied the initial virial ratio. Observations of stars in star-forming regions have shown them to have subvirial (cool) velocities (e.g. Peretto et al., 2006; Fűrész et al., 2008), which in tandem with primordial substructure, facilitates a violent relaxation process resulting in a dense spherical cluster (Allison et al., 2010). Such initial conditions have been successful in explaining the Orion Nebula Cluster, but do not lead to the formation of unbound associations. Indeed, massive unbound associations (e.g. Sco Cen, Carina) have been suggested as the more likely birthplace of the Solar System, and such regions are observed to contain short-lived radioactive isotopes from nucelosynthesis (e.g. Diehl et al., 2010; Voss et al., 2012). For this reason, we also ran simulations of substructured clusters with virialised (tepid) and supervirial (warm) velocities to investigate whether an unbound association could be a likely birthplace of the Sun (see also Pfalzner, 2013).
Somewhat surprisingly, the assumed initial virial ratio does not greatly affect the results. In the initially substructured models, 6/20 cool clusters and 5/20 tepid clusters contain enriched, unperturbed singleton G-dwarfs. The warm, substructured clusters also host a low number of potential Solar System analogues (6/20 clusters contain enriched unperturbed singletons). However, in this case the low densities achieved by these expanding associations are the cause of the low number, rather than hostile dynamical interactions. As an example, supervirial cluster number (xviii) in Table 4 contains 0 enriched, unperturbed singletons. However, if we assume the supernova exploded at 4 Myr instead of 6.64 Myr, then the cluster contains 6 unperturbed singletons (from a total of 12 enriched G-dwarfs).
Adding substructure to the clusters does appear to influence the results. In the Plummer models, we find that 15/20 clusters contain enriched G-dwarfs, but applying our constraints that the star must be a singleton and not suffer a perturbing velocity kick we find that 11/20 clusters contain several enriched, unperturbed singleton G-dwarfs. This is roughly a factor of two higher than the number of substructured clusters that contain enriched, unperturbed singletons, and is likely due to the fact that Plummer spheres are relaxed potentials, whereas the fractals take more than 1 Myr to relax (Allison et al., 2010) and are therefore less quiescent environments.
One interesting aspect of our results is that the numbers of enriched, unperturbed singletons in the clusters are rather uniform (albeit subject to low-number statistics) compared to the distribution of the number of enriched G-dwarfs. Taking two substructured, tepid clusters as an example, cluster number (i) in Table 3 contains 5 enriched G-dwarfs, 4 of which are unperturbed singletons, whereas cluster (ii) contains 15 enriched G-dwarfs, but only 3 unperturbed singletons. This highlights two processes within the numerical simulations; firstly, the evolution of the clusters is highly stochastic (even the Plummer spheres contain a wide spread in ) and secondly, large numbers of enriched stars equates to the supernova occuring in a particularly dense region. The higher chances of one of the 96 G-dwarfs experiencing enrichment in a dense cluster must be offset by the fact that the G-dwarfs will likely suffer more dynamical interactions and close encounters.
We caution that the number of enriched, unperturbed singletons from our simulations may be overestimated because we have assumed a field-like primordial binary fraction for G-dwarfs in the clusters. Current estimates suggest that the binary fraction in the field is 46 percent (Raghavan et al., 2010) which may be significantly lower than the primordial binary fraction (likely to be between 75 – 100 per cent, e.g. Kaczmarek et al., 2011; Parker et al., 2011; King et al., 2012), due to dynamical processing. If we were to increase the binary fraction of the G-dwarfs, we would expect fewer enriched G-dwarfs to be ‘singletons’ throughout the evolution of the cluster.
In addition to the supernova time, the other constraint for enrichment is that the supernova explodes between 0.1 and 0.3 pc from the G-dwarf (a balance between stripping away too much of the protosolar nebula, and injecting enough radioactive isotopes into the disc). Panel (c) in Figs. 1 – 4 indicates that a relaxing of this upper bound would imply enrichment of more G-dwarfs; however, the boundary at 0.3 pc already assumes highly efficient injection (Ouellette et al., 2007; Adams, 2011) and it is unlikely that this is underestimated.
Our simulations have shown that – whilst it is possible to have multiple enriched, unperturbed singletons in a cluster – 50 to 75 per cent of the clusters we model do not contain any. Furthermore, the late-stage injection of 26Al and 60Fe, which occurs at 6.6 Myr for a supernova with progenitor mass 25 M⊙, has been cited by Gounelle & Meibom (2008); Gounelle & Meynet (2012) as being too late in the disc evolution to be homogeneously included in the meteorites. This could in principle be alleviated if the supernova progenitor formed first, and the lower-mass stars formed several Myr later, although this would require firm evidence of age spreads in star-forming regions. Evidence for and against such age spreads is currently the subject of much debate (e.g. Reggiani et al., 2011; Jeffries et al., 2011). Recently, however, Bell et al. (2013) suggested that the ages of star-forming regions and open clusters may be underestimated by a factor of two; if this is the case, then protoplanetary discs are longer-lived and the arguments against late-stage injection become weaker.
We are then left with the straightforward question: is late-stage enrichment too uncommon to be a feasible delivery mechanism for the 26Al and 60Fe levels in the early Solar System? Models of Solar System formation triggered by a supernova naturally account for the 26Al (Cameron & Truran, 1977; Boss, 1995; Gritschneder et al., 2012; Vasileiadis et al., 2013), but require that 60Fe abundances in the early Solar System be similar to the background ISM levels (as recently suggested by Moynier et al., 2011; Tang & Dauphas, 2012). Indeed, Gounelle et al. (2009); Gounelle & Meynet (2012) recently proposed a three-stage star formation scenario where the supernovae of several stars produces the 60Fe, then triggers the formation of a massive star which produces 26Al during its Wolf–Rayet phase. The Sun is then born in a third generation of star formation with the correct enrichment levels (see also Gaidos et al., 2009). Such a scenario would require age spreads to be observed in star-forming regions (like the disc enrichment model), but of the order 15 Myr, and is perhaps more unlikely than the age spread of 3 Myr that would alleviate drawbacks in the disc enrichment model.
If we assume that all the clusters in our simulations eventually evaporate into the Galactic field (and that dynamical interactions after 10 Myr are so infrequent as to not affect our results, Dukes & Krumholz, 2012; Pfalzner, 2013), then the fraction of enriched, unperturbed singletons can be derived by dividing the sum of from all clusters by the sum of all G-dwarfs (i.e. 96 20 simulations, a total of 1920 G-dwarfs). The sum of ranges from 19 (the smooth, tepid clusters) to 6 (the substructured, warm clusters). The fraction is therefore of order 1 per cent (smooth, tepid), or 0.3 per cent (substructured, warm) and of order 0.5 per cent for the substructured, cool/tepid clusters. If we relax the constraint that the enriched singletons must not suffer velocity perturbations, the enriched singleton fraction is between 2.2 (smooth, tepid) and 0.4 per cent (substructured, warm).
Finally, we note that the dynamical evolution of star clusters is highly stochastic. Some clusters eject the supernova progenitor before enrichment, and even when enrichment occurs the numbers of enriched singleton G-dwarfs varies between 0 and 7, simply through subtle differences in the evolution of our (initially) statistically identical model clusters. Such stochasticity is impossible to characterise observationally without prior information on the star formation process (Parker & Goodwin, 2012).
7 Conclusions
Evidence of short-lived isotopes in meteorites suggests that the Sun was in close proximity to a 25 M⊙ star which went supernova at the epoch of planet formation in the Solar Sytem. If these isotopes are delivered to the Sun’s protoplanetary disc, the supernova must have occurred at a distance between 0.1 – 0.3 pc of the Sun. We have conducted -body simulations of the dynamical evolution of star clusters with members, which would be expected to form at least one 25 M⊙ star under the assumption of a normal IMF. We have determined the number of G-dwarfs that experience the necessary levels of enrichment, and then determined their dynamical histories to ascertain whether they could potentially be Solar System analogues. Our conclusions are the following:
(i) Typically, between 50 per cent and 75 per cent of clusters contain supernova-enriched G-dwarfs at a distance of between 0.1 and 0.3 pc from the supernova. The number of enriched G-dwarfs is in the range of several to over 10 (from a total of 96).
(ii) If we consider only ‘singletons’ – G-dwarfs that are never in close binaries, or suffer disruptive encounters, then only 25 per cent of clusters contain G-dwarfs that are enriched, unperturbed singletons. Usually these clusters contain only one or two such objects.
(iii) The assumed initial conditions for star formation have little impact on the results; there is little difference in the numbers of enriched, unperturbed singletons between substructured clusters which are subvirial (cool collapse), virial (tepid and static) or supervirial (warm and expanding). The only caveat is that if the supernova were to explode earlier, the expanding supervirial clusters would have a higher occurrence of enriched, uperturbed singletons.
(iv) Summing together all the G-dwarfs from each suite of simulations, the global fraction of G-dwarfs that are enriched, unperturbed singletons is of order 0.5 – 1 per cent.
(v) The cluster evolution and numbers of enriched stars is highly stochastic; statistically identical clusters can enrich over 10 G-dwarfs, or only several, or none at all – differences are due to the inherently chaotic nature of star cluster evolution.
At first sight the -body models suggest that supernova enrichment of unperturbed singleton G-dwarfs like our Sun is a rare occurrence. However, it does occur in a significant fraction of clusters, and sometimes to more than one G-dwarf in the same cluster. Future investigation of the assumed cluster parameters (IMF, morphology, density, virial state), and the time of the supernova explosion, would be beneficial to investigate whether the probability of disc enrichment can be raised by changing one or more of these parameters.
Acknowledgments
We thank the anonymous referee for their comments and suggestions, which improved the original manuscript. RPC was supported by the Swedish Research Council (grant 2012-2254). MBD was supported by the Swedish Research Council (grants 2008-4089 and 2011-3991). The simulations in this work were performed on the BRUTUS computing cluster at ETH Zürich.
References
- Aarseth et al. (1974) Aarseth S. J., Hénon M., Wielen R., 1974, A&A, 37, 183
- Abt et al. (1990) Abt H. A., Gomez A. E., Levy S. G., 1990, ApJS, 74, 551
- Adams (2011) Adams F. C., 2011, ARA&A, 48, 47
- Adams et al. (2004) Adams F. C., Hollenbach D., Laughlin G., Gorti U., 2004, ApJ, 611, 360
- Adams & Laughlin (2001) Adams F. C., Laughlin G., 2001, Icarus, 150, 151
- Adams et al. (2006) Adams F. C., Proszkow E. M., Fatuzzo M., Myers P. C., 2006, ApJ, 641, 504
- Allison & Goodwin (2011) Allison R. J., Goodwin S. P., 2011, MNRAS, 415, 1967
- Allison et al. (2010) Allison R. J., Goodwin S. P., Parker R. J., Portegies Zwart S. F., de Grijs R., 2010, MNRAS, 407, 1098
- Armitage (2000) Armitage P. J., 2000, A&A, 362, 968
- Bell et al. (2013) Bell C. P. M., Naylor T., Mayne N. J., Jeffries R. D., Littlefair S. P., 2013, MNRAS, 434, 806
- Bonnell & Davies (1998) Bonnell I. A., Davies M. B., 1998, MNRAS, 295, 691
- Bonnell et al. (2001) Bonnell I. A., Smith K. W., Davies M. B., Horne K., 2001, MNRAS, 322, 859
- Boss (1995) Boss A. P., 1995, ApJ, 439, 224
- Boss & Keiser (2012) Boss A. P., Keiser S. A., 2012, ApJL, 756, L9
- Boss & Vanhala (2000) Boss A. P., Vanhala H. A. T., 2000, Space Science Rev., 92, 13
- Brasser et al. (2006) Brasser R., Duncan M. J., Levison H. F., 2006, Icarus, 184, 59
- Brasser et al. (2012) Brasser R., Duncan M. J., Levison H. F., Schwamb M. E., Brown M. E., 2012, Icarus, 217, 1
- Bressert et al. (2012) Bressert E., Bastian N., Evans C. J., Sana H., Hénault-Brunet V., Goodwin S. P., Parker R. J., Gieles M., Bestenlehner J. M., Vink J. S., Taylor W. D., et al. 2012, A&A, 542, A49
- Busso et al. (1999) Busso M., Gallino R., Wasserburg G. J., 1999, ARA&A, 37, 239
- Busso et al. (2003) Busso M., Gallino R., Wasserburg G. J., 2003, PASA, 20, 356
- Cameron et al. (1995) Cameron A. G. W., Hoeflich P., Myers P. C., Clayton D. D., 1995, ApJL, 447, L53
- Cameron & Truran (1977) Cameron A. G. W., Truran J. W., 1977, Icarus, 30, 447
- Cartwright & Whitworth (2004) Cartwright A., Whitworth A. P., 2004, MNRAS, 348, 589
- Cerviño et al. (2013) Cerviño M., Román-Zúñiga C., Luridiana V., Bayo A., Sánchez N., Pérez E., 2013, A&A, 553, A31
- Chevalier (2000) Chevalier R. A., 2000, ApJL, 538, L151
- Diehl et al. (2010) Diehl R., Lang M. G., Martin P., Ohlendorf H., Preibisch T., Voss R., Jean P., Roques J.-P., von Ballmoos P., Wang W., 2010, A&A, 522, A51
- Dukes & Krumholz (2012) Dukes D., Krumholz M. R., 2012, ApJ, 754, 56
- Duquennoy & Mayor (1991) Duquennoy A., Mayor M., 1991, A&A, 248, 485
- Elmegreen (2006) Elmegreen B. G., 2006, ApJ, 648, 572
- Fischer & Marcy (1992) Fischer D. A., Marcy G. W., 1992, ApJ, 396, 178
- Fűrész et al. (2008) Fűrész G., Hartmann L. W., Megeath S. T., Szentgyorgyi A. H., Hamden E. T., 2008, ApJ, 676, 1109
- Gaidos et al. (2009) Gaidos E., Krot A. N., Williams J. P., Raymond S. N., 2009, ApJ, 696, 1854
- Geller et al. (2013) Geller A. M., Hurley J. R., Mathieu R. D., 2013, AJ, 145, 8
- Goodwin & Whitworth (2004) Goodwin S. P., Whitworth A. P., 2004, A&A, 413, 929
- Goswami (2004) Goswami J. N., 2004, New Astronomy Rev., 48, 125
- Gounelle & Meibom (2008) Gounelle M., Meibom A., 2008, ApJ, 680, 781
- Gounelle et al. (2009) Gounelle M., Meibom A., Hennebelle P., Inutsuka S.-i., 2009, ApJL, 694, L1
- Gounelle & Meynet (2012) Gounelle M., Meynet G., 2012, A&A, 545, A4
- Gritschneder et al. (2012) Gritschneder M., Lin D. N. C., Murray S. D., Yin Q.-Z., Gong M.-N., 2012, ApJ, 745, 22
- Heggie (1975) Heggie D. C., 1975, MNRAS, 173, 729
- Hirschi et al. (2004) Hirschi R., Meynet G., Maeder A., 2004, A&A, 425, 649
- Jeffries et al. (2011) Jeffries R. D., Littlefair S. P., Naylor T., Mayne N. J., 2011, MNRAS, 418, 1948
- Kaczmarek et al. (2011) Kaczmarek T., Olczak C., Pfalzner S., 2011, A&A, 528, 144
- King et al. (2012) King R. R., Parker R. J., Patience J., Goodwin S. P., 2012, MNRAS, 421, 2025
- Kouwenhoven et al. (2007) Kouwenhoven M. B. N., Brown A. G. A., Portegies Zwart S. F., Kaper L., 2007, A&A, 474, 77
- Kouwenhoven et al. (2005) Kouwenhoven M. B. N., Brown A. G. A., Zinnecker H., Kaper L., Portegies Zwart S. F., 2005, A&A, 430, 137
- Kroupa (2002) Kroupa P., 2002, Science, 295, 82
- Lada & Lada (2003) Lada C. J., Lada E. A., 2003, ARA&A, 41, 57
- Lamb et al. (2010) Lamb J. B., Oey M. S., Werk J. K., Ingleby L. D., 2010, ApJ, 725, 1886
- Lee et al. (1976) Lee T., Papanastassiou D. A., Wasserburg G. J., 1976, Geophys. Res. Lett., 3, 109
- Lee et al. (1998) Lee T., Shu F. H., Shang H., Glassgold A. E., Rehm K. E., 1998, ApJ, 506, 898
- Looney et al. (2006) Looney L. W., Tobin J. J., Fields B. D., 2006, ApJ, 652, 1755
- MacPherson et al. (1995) MacPherson G. J., Davis A. M., Zinner E. K., 1995, Meteoritics, 30, 365
- Malmberg et al. (2007) Malmberg D., de Angeli F., Davies M. B., Church R. P., Mackey D., Wilkinson M. I., 2007, MNRAS, 378, 1207
- Maschberger & Clarke (2008) Maschberger T., Clarke C. J., 2008, MNRAS, 391, 711
- Mason et al. (1998) Mason B. D., Gies D. R., Hartkopf W. I., W. G. Bagnuolo J., ten Brummelaar T., McAlister H. A., 1998, AJ, 115, 821
- Mason et al. (2009) Mason B. D., Hartkopf W. I., Gies D. R., Henry T. J., Helsel J. W., 2009, AJ, 137, 3358
- Mayor et al. (1992) Mayor M., Duquennoy A., Halbwachs J.-L., Mermilliod J.-C., 1992, in McAlister H. A., Hartkopf W. I., eds, IAU Colloq. 135: Complementary Approaches to Double and Multiple Star Research Vol. 32 of ASP Conference Series, CORAVEL Surveys to Study Binaries of Different Masses and Ages. IAU, pp 73–81
- Moynier et al. (2011) Moynier F., Blichert-Toft J., Wang K., Herzog G. F., Albarede F., 2011, ApJ, 741, 71
- Nimmo (2002) Nimmo F., 2002, Geology, 30, 987
- Oey et al. (2013) Oey M. S., Lamb J. B., Kushner C. T., Pellegrini E. W., Graus A. S., 2013, ApJ, 768, 66
- Ouellette et al. (2007) Ouellette N., Desch S. J., Hester J. J., 2007, ApJ, 662, 1268
- Parker & Goodwin (2007) Parker R. J., Goodwin S. P., 2007, MNRAS, 380, 1271
- Parker & Goodwin (2012) Parker R. J., Goodwin S. P., 2012, MNRAS, 424, 272
- Parker et al. (2011) Parker R. J., Goodwin S. P., Allison R. J., 2011, MNRAS, 418, 2565
- Parker & Meyer (2012) Parker R. J., Meyer M. R., 2012, MNRAS, 427, 637
- Parker & Quanz (2012) Parker R. J., Quanz S. P., 2012, MNRAS, 419, 2448
- Peretto et al. (2006) Peretto N., André P., Belloche A., 2006, A&A, 445, 979
- Pfalzner (2013) Pfalzner S., 2013, A&A, 549, A82
- Pfalzner & Olczak (2007) Pfalzner S., Olczak C., 2007, A&A, 475, 875
- Plummer (1911) Plummer H. C., 1911, MNRAS, 71, 460
- Portegies Zwart et al. (2001) Portegies Zwart S. F., McMillan S. L. W., Hut P., Makino J., 2001, MNRAS, 321, 199
- Portegies Zwart et al. (1999) Portegies Zwart S. F., Makino J., McMillan S. L. W., Hut P., 1999, A&A, 348, 117
- Portegies Zwart & Verbunt (1996) Portegies Zwart S. F., Verbunt F., 1996, A&A, 309, 179
- Portegies Zwart & Verbunt (2012) Portegies Zwart S. F., Verbunt F., 2012, Astrophysics Source Code Library, p. 1003
- Raghavan et al. (2010) Raghavan D., McMaster H. A., Henry T. J., Latham D. W., Marcy G. W., Mason B. D., Gies D. R., White R. J., ten Brummelaar T. A., 2010, ApJSS, 190, 1
- Reggiani et al. (2011) Reggiani M., Robberto M., Da Rio N., Meyer M. R., Soderblom D. R., Ricci L., 2011, A&A, 534, A83
- Reggiani & Meyer (2011) Reggiani M. M., Meyer M. R., 2011, ApJ, 738, 60
- Sánchez & Alfaro (2009) Sánchez N., Alfaro E. J., 2009, ApJ, 696, 2086
- Scally & Clarke (2001) Scally A., Clarke C., 2001, MNRAS, 325, 449
- Schwamb et al. (2010) Schwamb M. E., Brown M. E., Rabinowitz D. L., Ragozzine D., 2010, ApJ, 720, 1691
- Shu et al. (2001) Shu F. H., Shang H., Gounelle M., Glassgold A. E., Lee T., 2001, ApJ, 548, 1029
- Tang & Dauphas (2012) Tang H., Dauphas N., 2012, Earth and Planetary Science Letters, 359, 248
- Thrane et al. (2006) Thrane K., Bizzarro M., Baker J. A., 2006, ApJL, 646, L159
- Urey (1955) Urey H. C., 1955, Proceedings of the National Academy of Science, 41, 127
- Vasileiadis et al. (2013) Vasileiadis A., Nordlund Å., Bizzarro M., 2013, ApJL, 769, L8
- Voss et al. (2012) Voss R., Martin P., Diehl R., Vink J. S., Hartmann D. H., Preibisch T., 2012, A&A, 539, A66
- Wasserburg et al. (2006) Wasserburg G. J., Busso M., Gallino R., Nollett K. M., 2006, Nuclear Physics A, 777, 5
- Weidner & Kroupa (2006) Weidner C., Kroupa P., 2006, MNRAS, 365, 1333
- Weidner et al. (2013) Weidner C., Kroupa P., Pflamm-Altenburg J., 2013, MNRAS, 434, 84