Quasars and their emission lines
as cosmological probes111Invited talk presented on May 14, 2013 at the 9th SCSLSA held in Banja Koviliača, Serbia.
Abstract
Quasars are the most luminous sources in the Universe. They are currently observed out to redshift when the Universe was less than one tenth of its present age. Since their discovery 50 years ago astronomers have dreamed of using them as standard candles. Unfortunately quasars cover a very large range (8 dex) of luminosity making them far from standard. We briefly review several methods that can potentially exploit quasars properties and allow us to obtain useful constraints on principal cosmological parameters. Using our 4D Eigenvector 1 formalism we have found a way to effectively isolate quasars radiating near the Eddington limit. If the Eddington ratio is known, under several assumptions it is possible to derive distance independent luminosities. We discuss and the main statistical and systematic errors involved, and whether these “standard Eddington candles” can be actually used to constrain cosmological models.
keywords:
cosmological parameters; emission lines; quasars: general1 Introduction
A majority of quasars can be identified from their distinctive emission line spectra and continua rising toward the UV. The emission lines are broad (FWHM 1000 km s-1 ) and strong (equivalent width Å in the rest frame). Quasars are numerous, very luminous (even erg s-1) and observed over a wide redshift range (). We can only repeat a question that we asked years ago (Marziani et al., 2003a): why have quasars never been successfully used as cosmological probes?
The reasons that quasars have not been used for cosmology (i.e. like supernovæ) remains the same as ten years ago: they are sources with an evolving luminosity function that is open-ended at low (e.g. Grazian et al., 2000; Boyle et al., 2000; Palanque-Delabrouille et al., 2013). Spectral properties do not show strong signs of a luminosity dependence or, better said, quasars do show self-similar broad line spectra with varying luminosity, black hole mass, and redshift. This is not to say that all quasar spectra are identical but that neither luminosity nor mass are the main drivers of quasar spectral diversity. Quasars are also anisotropic sources most easily seen at radio frequencies where relativistic beaming is observed in some radio-loud sources (e.g., Urry and Padovani, 1995).
Given these properties it is reasonable to ask if quasars can tell us anything about the geometry of the Universe. After fifty years of study the answer to this question appears to be a cautious “yes.” A first hint comes from consideration of the Hubble diagram for the brightest quasars. One can predict the apparent magnitude of a quasar with “maximum” mass and radiating at Eddington limit and derive some constraint on the distance scale. If this computation is carried out (Bartelmann et al., 2009), one derives values that are in agreement with present-day estimates ( 60-70 km s-1 Mpc-1). Clearly we are a far cry from the original Hubble estimate of 500 km s-1 Mpc-1 (Hubble, 1929).
2 Major approaches
We can go much beyond the elementary consideration outlined above. In the last decades several techniques were devised to exploit quasars for cosmology. They can be grouped into three major approaches:
-
1.
correlations with luminosity;
-
2.
identification and measurement of standard rulers (often from time delays);
-
3.
identification of “Eddington standard candles” in the general quasar population.
Other methods are not based on the intrinsic properties of quasars but rather on the matter distribution mapped through the light emitted by quasars (for example baryon acoustic oscillations in the quasar Ly forest; Busca et al. 2013) or the spatial distribution of quasars. They will not be further considered here. In the following we will briefly review the merits of the first two approaches and focus on the “Eddington standard candle” approach.
3 Luminosity correlations
An anti-correlation between the equivalent width (EW) of high ionisation Civ1549 and continuum specific luminosity was found in a small sample of core-dominated radio loud sources (Baldwin, 1977). This “Baldwin effect” – as the anti-correlation came to be known – took on a life of its own and was confirmed in a large number of subsequent studies (see Sulentic et al. 2000a for a synopsis up to mid-1999) but always with increasing looseness. Modern formulations of the Baldwin effect involve a weak anti-correlation (with slope -0.1) that becomes significant only if large samples are considered. Most recent detections of the Baldwin effect consider samples in excess of 20000 sources (Bian et al., 2012). The cosmological expectations raised by the original Baldwin Effect foundered on the large dispersion observed in subsequent studies. The discovery of a sizable population of low-, low luminosity quasars with EW Civ comparable to values observed in high-luminosity quasars also made the effect sample-dependent (Kinney et al., 1990): low Civ EW sources at low luminosity are mainly Narrow Line Seyfert 1s (NLSy1s) that are more frequent in soft X-ray selected samples. The major factor governing the Baldwin effect was unveiled by the discovery that EW Civ is much more strongly dependent on Eddington ratio than on luminosity (Bachev et al., 2004; Baskin and Laor, 2004): Baskin and Laor (2004) found correlation coefficients and for Eddington ratio and luminosity, respectively. This result implies a strong role for selection effects: in a flux limited sample the higher Eddington radiators are preferentially selected at larger distances. It is possible to show that a weak correlation between equivalent width and luminosity will also arise in an ideal complete sample because of the strong correlation between EW and Eddington ratio and that a flux limit makes it possible to account for the observed correlation slope (Marziani et al., 2008).
4 Measuring standard rulers in quasars
Generally speaking the standard rulers sought for cosmological purposes are either uncomfortably extra large (weak lensing), or exceedingly small (quasars). Restricting the attention to quasars, a linear size that can be used as a standard ruler is the distance between the broad line emitting gas and the central continuum source (hereafter the broad line region radius, ). This distance has been measured via reverberation mapping for 60 active nuclei and quasars at (Bentz et al., 2013) with programmes underway to measure in more distant quasars (e.g., Kaspi et al., 2007; Trevese et al., 2007; Chelouche et al., 2012; Woo et al., 2013). Line luminosity arises from photoionization by an FUV continuum and lines respond to continuum luminosity changes with a time delay, . The radius is obtained by measuring the peak or centroid displacement of the cross-correlation function between the light curves of the continuum and a strong line. While the meaning of this measure is not fully clear (Devereux, 2013), is measured in a way that is redshift independent. If it were possible to measure the angular size of the BLR then a redshift independent value of the angular distance would follow: (Elvis and Karovska, 2002). However, our ability to resolve the broad line region is still beyond reach of the most advanced optical interferometers (ESO VLTI, etc.): the angular size subtended by the broad line region in some of the nearest sources is no more than a few tenths of milliarcsecond.
A second method employing the BLR size as a standard ruler is based on the expected dependence of with luminosity, originally predicted on the basis of photoionization physics (Davidson, 1972; Krolik and McKee, 1978) and observationally confirmed from from reverberation data: (Bentz et al., 2013, and references thererin; see also Kaspi et al. 2005). The ratio is proportional to (Watson et al., 2011; Czerny et al., 2012). A challenge is to measure for a large number of objects. Chances of success may have increased using the newly devised technique of photometric reverberation mapping (Haas et al., 2011) that is less time-demanding than spectroscopic monitoring.
5 Eddington standard candles
5.1 The 4D Eigenvector 1 space
It is now widely accepted that quasars are powered by accretion onto a massive compact object – most likely a supermassive black hole (see e.g., D’Onofrio et al., 2012, and references therein). Mass accretion rate governs the bolometric luminosity ; however, observed spectroscopic parameters are too weakly dependent on to provide a redshift independent estimate of bolometric luminosity. Quasars are an almost self similar phenomenon over an extremely wide range of black hole mass (Zamanov and Marziani, 2002). Nonetheless, in the course of the last two decades it has been possible to organize quasar diversity along systematic trends. The first successful attempt involved a principal component analysis of measures for bright PG quasars (Boroson and Green, 1992). Subsequent studies revealed correlations between the first eigenvector (E1) of quasar samples and other observational parameters (e.g., Wang et al., 1996; Sulentic et al., 2000a, 2007; Kruczek et al., 2011; Tang et al., 2012). Source luminosity (associated with the second eigenvector) and high-ionization emission line properties are more weakly correlated (Dietrich et al., 2002), as summarized in § 3.
A 4D Eigenvector 1 parameter space using four measures has proved especially useful for characterising E1 trends (Sulentic et al., 2000a, b, 2007). The measures are associated with: 1) velocity dispersion in the low-ionization line emitting region i.e., the FWHM of H, 2) physical conditions in the broad line region, described by the intensity ratio between the Feiiopt blend centered at 4570 Å and H, Feii), 3) strength of a soft X-ray thermal continuum component represented by the soft-X photon index, and 4) amplitude of systematic nonvirial motions in high ionization gas i.e., the amplitude of the Civ 1549 line blueshift. Eddington ratio is likely to be the principal driver of 4DE1 (e.g., Boroson and Green, 1992; Marziani et al., 2001, 2003b; Baskin and Laor, 2005). The elongated source distribution in the optical plane of 4DE1 defined by FWHM H vs. , appears to be an Eddington ratio sequence (see e.g., Marziani and Sulentic, 2012b; Zamfir et al., 2010, for diagrams showing the source distribution for large low- samples). As the word say, E1 is intrinsically a 1D vector in an -dimensional space of parameters. There are several parameters that correlate with the original E1 in addition to the four ones included in the 4DE1 formulation. Among them, the hard X–ray continuum shape (e.g., Fanali et al., 2013), and the prominence of Aliii1860 emission (Bachev et al., 2004; Negrete et al., 2012). Could one of more E1 correlates be the path to selecting standard Eddington candles?
5.2 Extreme Eddington radiators
If the Eddington ratio is known (), then the bolometric luminosity can be derived if the mass is also known. Estimates of black hole mass have now been made for tens of thousands of quasars (Marziani and Sulentic, 2012a; Shen, 2013) following the assumption that some emission lines are broadened by virial motion. Under the virial assumption it is possible to compute (where is a structure factor 1) and hence derive the bolometric luminosity . In principle this approach can be applied to quasars of any Eddington ratio (Davis and Laor, 2011) but, in practice, attempts have been focused on a minority of quasars that are believed to radiate close to an extreme luminosity associated with the Eddington limit.
The condition 1 (up to a few times the Eddington luminosity) is physically motivated. When the mass accretion rate becomes super-Eddington, emitted radiation is advected toward the black hole, so that the source luminosity increases only with the logarithm of accretion rate (Abramowicz et al., 1988; Mineshige et al., 2000). The accretion flow remains optically thick so that radiation pressure “fattens” it.
5.2.1 The steepest X-ray sources
The resulting “slim” accretion disk is expected to emit a steep soft and hard X-ray spectrum, with hard X-ray photon index (computed between 2 and 20 KeV) converging toward and bolometric luminosity saturating to
| (1) |
where is the dimensionless accretion rate (Mineshige et al., 2000), and is a constant related to the asymptotic ratio for . This result, along with the expression for virial black hole mass, allowed Wang et al. (2013) to write a redshift independent formula for the quasar bolometric luminosity. Magnitude differences between the independent estimates and the standard estimates based on redshift converge to 0 with a scatter that is magnitude at 1 confidence level, if . This method is based on the theoretical prediction of the existence of super-Eddington accretors whose hard X-ray spectrum shows a steep slope.
A challenge in this case is to find a sample that is large enough because only 12 suitable objects at have been found by Wang et al. (2013). In addition, we did not favor hard X-ray measures as key 4DE1 parameters (Sulentic et al., 2000a) because they showed weaker correlation with optical/UV line parameters than . Current X-ray databases do not allow us to exploit the soft X-ray excess as a selector of Eddington candles. Instead we look to other UV parameters that are more closely correlated with 4DE1 parameters most tightly dependent on Eddington ratio.
5.2.2 The strongest Feii emitters
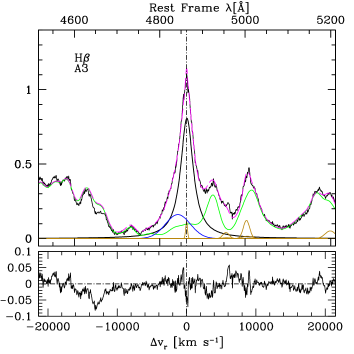
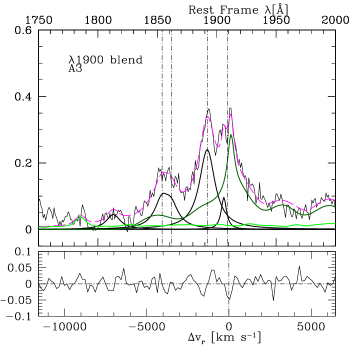
Extreme sources (hereafter extreme Pop. A sources in 4DE1: or xA) do not show only a soft X-ray excess or a steep X-ray continuum but also the largest values. This measure is already available for hundreds of low quasars. A potential 4DE1 correlate involves the prominence of the resonance doublet of Aliii1860 (Sulentic et al., 2007; Negrete et al., 2012). The appearance of the optical and UV spectrum of these sources is shown in Fig. 1. Avoiding any line width definition, the following two criteria are suitable for selecting high- candidates over a wide range: 1) ; 2) (Aliii1860) 0.5 (Siiii]1892) (Marziani & Sulentic, submitted). These conditions are sufficient to isolate sources radiating close, or better said, closest to the Eddingon limit. They are satisfied by 10% of a low- sample based on the SDSS (Zamfir et al., 2010). The width of Aliii1860, Siiii]1892, and H are extremely well correlated (Negrete et al., 2013).
Under the virial assumption, it is possible to write the bolometric luminosity of a source radiating at a given Eddington ratio in terms of the line broadening:
| (2) |
where erg s-1 g-1, the ionizing luminosity is assumed to be , with . The variable is the average frequency of the ionizing photons, and the product , density times ionisation parameter, is the ionizing photon flux. Eq. 2 assumes a strict validity of the relation . This assumption appears to be verified for the general population of quasars, i.e., for quasars of any Eddington ratio, and should be even more true for a sample of quasars whose Eddington ratio values cluster around a fixed value with a small dispersion. A violation would imply luminosity-dependent effects on the diagnostic line ratios which we do not see.
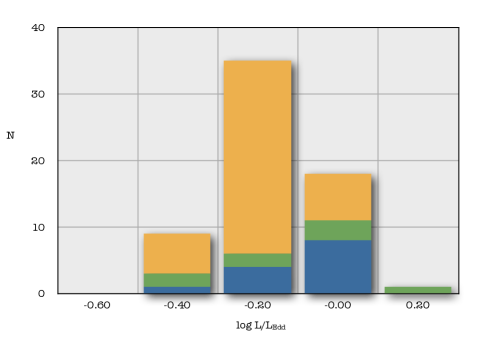
Empirical estimates show that the distribution decreases near 1 (e.g., Woo and Urry, 2002; Shen et al., 2011). When the distribution for xA sources is computed, they are found to be the sources closest to the Eddington limit, clustering around the largest values with small dispersion. The a-posteriori distribution of Eddington ratio values for a sample selected according to the diagnostic criteria indeed shows clustering 1 with small dispersion, dex (Fig. 2).
There is no claim that the distribution of Fig. 2 is peaked around a true (unbiased) Eddington ratio value. Several systematic effects could influence our estimate. The most relevant one is related to the orientation of the emitting region. The expected systematic effect of orientation increases the average : if the broad line region is flattened, then our computations will systematically overestimate since the FWHM will be reduced in all cases because the line-of-sight component of the virial velocity will appear always less than the true one. However, this is not affecting the usefulness of xA sources as Eddington standard candles, provided that they really cluster around some value of Eddington ratio with a small dispersion. Fig. 2 shows an a-posteriori confirmation that the distribution is tight. This results does not depend on cosmology: changing values for the s affects little the distribution dispersion. The entering Eq. 2 has been computed from the ratio, and assuming a value of at very low redshift when the s’ influence is negligible.
Strictly speaking, even if all other parameters are expression of the quasar intrinsic properties, cannot be independently estimated because of circularity in assuming . Avoiding any circularity in Eq. 2 would require -independent bolometric luminosity estimates for very low- extreme accretors, for example from type Ia supernovæ in the host galaxies or from reverberation mapping measurements of time delay. In practice, the values of the quasar parameters entering Eq. 2 are so uncertain that the derived is poorly determined and has to be assumed. The key in using Eq. 2 for s estimation is that the dispersion around any parameter value is small, not that we know its true value.
Are xA sources the super-Eddington accretors postulated by Wang et al. (2013)? xA sources are relatively frequent at low-, 10% of optically selected samples. The estimates of are all below 2, the value predicted for super-Eddington accretors. Both the super-Eddington accretors of Wang et al. (2013) and xA sources are sought looking at one extreme property. The extreme properties are correlated in the 4DE1 context, so that it is likely that super-Eddington accretors are included in the xA sample, but they may be a fraction of all xA sources.
5.3 A preliminary application
Can any method based on Eddington ratio standard candles be applied to actual data and give relevant results? We selected a preliminary sample comprising sources in three redshift ranges. Of two H samples, one was based on SDSS spectra with and a second one on published H VLT ISAAC observations, with . A third sample used the criterion on Aliii1860 and was based on SDSS in the redshift range . The three samples yielded 63 sources in total. We then compared the “virial luminosity” and bolometric luminosity estimated for various cosmological models.
| (3) |
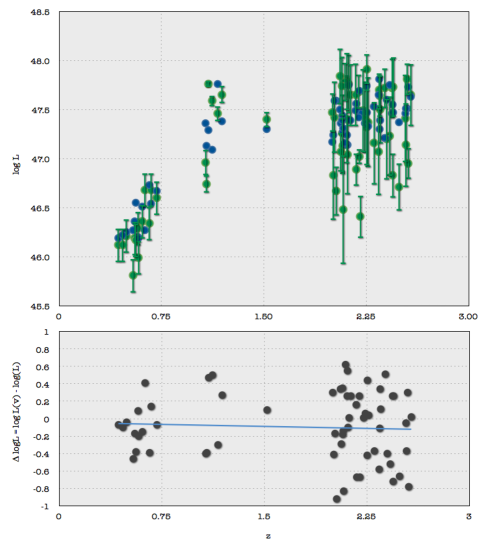
The upper panel of Fig. 3 shows the “Hubble diagram” for the preliminary sample. Virial bolometric luminosity (computed from the best guess of parameters in Eq. 2) and -based bolometric luminosity (computed for concordance cosmology; Hinshaw et al. 2009) are plotted as a function of redshift. The lower panel shows the residuals. Residual average is different from 0 and their slope is slightly nonzero. The differences are not significant and this preliminary application shows consistence with concordance cosmology. With the rms and the size of the preliminary sample we can statistically exclude only models like a - () or matter-dominated (, ) flat Universe. In the first case the slope of the residuals becomes strongly negative because is too large with respect to the virial luminosity; if instead , is assumed, is too small and the slope is positive.
5.3.1 Uncertainties
More than gaining conclusive results (apart from excluding extreme models already ruled out since long), experimenting with a small sample of 63 objects helped us understand the requirements for a sample of quasars able to set meaningful constraints on cosmological parameters. As mentioned, the virial bolometric luminosity depends on several parameters whose precise value is poorly known but that should be the same for all sources radiating at limiting Eddington ratio with a hopefully small dispersion. The H profile of xA sources can be almost always modelled with an unshifted (virial) Lorentzian component plus an additional component affecting the line base. The profile similarity suggests the same, reproducible structure. The parameters related to the continuum shape should also show very small dispersion since xA sources show very similar emission line spectra (Nikolajuk et al., 2004). The sample standard deviation of in our preliminary sample is 0.4 dex. It is a large value that reflect in parts the low S/N of most spectra.
Looking in more detail at the parameters entering Eq. 2, we can estimate each parameter’s contribution to the total error (a more detailed discussion of the error budget is presented in Marziani & Sulentic, 2013, submitted). The factor may appear especially uncertain since it involves the scantly observed far UV quasar spectral energy disturbution. However, we have to make a restriction to spectral energy distributions appropriate for Pop. A sources, at least, or for large NLSy1s, at best. We considered four continuum models: the ones of Mathews and Ferland (1987) and Korista et al. (1997), a NLSy1 spectral energy distribution derived from Grupe et al. (2010) and Panessa et al. (2011). Since , and eV, there is a scatter of 0.033 dex in ionizing luminosity induced by the differences in the four continua. The ionizing photon flux is estimated from the diagnostic ratios. An average value (109.6 cm-3) has been assumed in the calculation of the virial luminosity for the sources of the preliminary sample. Dispersion has been estimated to be 0.1 dex. The structure factor has been derived by scaling the correlation between virial product and host galaxy velocity dispersion to agree with the same correlation for non-active galaxies (Onken et al., 2004), and its uncertainty is . Our sources show very similar H profiles, all of them consistent with a Lorentzian component and a blue shifted additional component. Since is probably a major factor governing BLR structure, we may expect . Statistical errors on the virial luminosity should be combined with errors associated to the conventional bolometric luminosity determination. Uncertainties on , spectrophotometry, and bolometric correction contribute to the error budget with 0.1 dex. We obtain a total rms 0.4, consistent with the scatter of our preliminary data. The main hope for improving statistical error resides in more precise measures of FWHM since the line broadening enters with the fourth power in Eq. 2. Reducing FWHM measurements uncertainty from 15% to 5% would reduce the total scatter to 0.3 dex. Therefore, the rms could be lowered to 0.3 dex by simply considering better data.
The most important systematic effect that we were able to identify (Sulentic & Marziani, submitted) is related to the bolometric correction needed to convert monochromatic luminosities at 5100 Å and 1800 Å into bolometric luminosity, or better, to the ratio . Likely values of this ratio range from 0.63 (the standard Mathews and Ferland 1987 model continuum) to 0.7 (the observed I Zw 1 spectrum). A small change in the assumed has a significant effect on because it affects the average at high redshift. Calibration observations of sources for which H and the 1900 blend are simultaneously covered are needed to determine an average and its dispersion.
Systematic differences in the parameters entering Eq. 2 as a function of the diagnostic ratio are also expected. They will contribute to the overall sample rms but should not introduce any systematic effects if the distribution of values remains constant with . The sample rms could be further reduced if a trend involving and ionizing photon flux is found. Exploring this possibility will become feasible once a large sample of xA sources is created.
6 Comparison with Supernovæ, Prospects, and Caveats
6.1 Concordance cosmology from supernovæ and prospects for Eddington standard candles
Only few Supernovæ at 1 had been discovered at the turn of the century. At that time the Hubble diagram with type Ia supernovæ showed a large scatter, although the supernova data points appeared systematically fainter than expected. The observations sampled mainly the redshift interval where the effect of nonzero yields an accelerated expansion. At the time of writing, supernova surveys have produced and analysed data for supernovæ (Conley et al., 2011), although the wide majority are still at . In addition the WMAP 9 yr combined results and the Planck probe results indicate that and are known with an accuracy of a few percent. Surveys are planned to improve the precision down to 1-percent level. The accelerated expansion of the Universe is perhaps not anymore an issue.
There is however an advantage due to the ability of quasar data to cover almost uniformly the range between 0 and 4. Supernovæ have been discovered mainly at , and Planck and WMAP deal after all with features detected at the surface of last scattering when the Universe became transparent to radiation, at . Quasars can sample cosmic epochs when the negative pressure of dark energy was dominating, as well as earlier epochs when the Universe expansion was still dominated by the effect of matter (). If 400 xA sources with rms 0.3 dex can be found then constraints on will be meaningful. Fig. 4 shows the expectations for a 400-strong quasar mock sample simulated with uniform rms = 0.3 over the redshift range 0.2 – 3.0 (details are provided in Marziani & Sulentic, submitted). Quasars will yield similar constraints on as supernovæ since they are able to chart cosmic epochs when matter dominated cosmic expansion. In both cases, only statistical errors were considered.
We are still far from the precision of absolute magnitude of type Ia supernovæ whose dispersion is now estimated mag (Folatelli et al., 2010; Hook, 2013). The dispersion in Eddington candles is also much larger than the dispersion in the – relation, dex that has been proposed by Watson et al. (2011) as a valuable cosmological ruler. Even if the dispersion in bolometric luminosity of the Eddington standard candles is disarmingly large (but it is likely that the rms can be significantly reduced as it happened for supernovæ; Jacoby et al. 1992, and references therein), our preliminary analysis has shown that they might be useful if one exploits the possibility of building large samples uniformly covering a wide redshift range.
6.2 Caveats
The physics behind xA sources is still poorly understood. xA sources have low equivalent width in all the strongest broad emission lines i.e, Civ1549 and Balmer lines. The reason of the low equivalent width is not fully clear (Diamond-Stanic et al., 2009; Shemmer et al., 2010) but extreme Eddington ratio sources may have stripped the BLR of the lower column density gas (Netzer and Marziani, 2010) leaving only the densest part of the BLR for low-ionization line emission (Marziani et al., 2010; Negrete et al., 2013). A4 sources show extreme iron and aluminium emission, and this might be associated to chemical enrichment (Nagao et al., 2006; Juarez et al., 2009). Selective aluminium and silicon abundance enhancement can occur in supernova ejecta (Woosley and Weaver, 1995), and such enhancement may be needed to explain in detail the emission line ratios observed in A3 and especially A4 sources (Negrete et al., 2012). This in turns lead us to the issue of a particular evolutionary state that may be associated with the extreme Eddington radiators, and with the feedback relation between star formation and black hole accretion (e. g., Silk, 2013). An important open issue is the relation between extreme Eddington ratio and enhancement of circumnuclear star formation (Sani et al., 2010). It is also not clear whether/how slim disk models that predict a large can consistently account for the soft X-ray excess i.e., for the large . The asymptotic value of the bolometric luminosity of the slim disk also depends on the poorly known viscosity and opacity properties of the disk (e.g., Dotan and Shaviv, 2011, and references therein).
We cannot ignore that there are caveats also for the radius-luminosity method: using as a standard linear ruler is certainly appealing, but is there here any well-known structure here that is employed as a standard ruler for cosmology? Since the broad line region is not resolved, it is not obvious if this is the case. It is known since long (e.g., Netzer, 1990) that derived with reverberation mapping can differ from what is ideally expected to measure i.e., an emissivity weighted distance from the central continuum source. The issue is certainly not settled (Devereux, 2013). Unclear aspects involve the uncertain effect of radiation forces and the physical conditions that are likely to be different from object to objects, as pointed out by Watson et al. (2011). Low- reverberation measures are mainly for H, but H observations in the IR are still difficult at the time of writing. Resorting to prominent UV resonance lines will require a careful inter calibration not unlike the one needed for combining optical and UV data for Eddington standard candles.
7 Conclusion
The potential of using quasars for cosmographic studies has not yet been exploited. Promising methods based on quasar intrinsic properties involve the identification of “Eddington standard candles” and the use of the broad line region distance from the quasar continuum sources as a geometric ruler whose dependence on luminosity is known. Both methods are still relatively untested at present and should be further investigated in the near future. Ideally, standard candles distributed uniformly over a wide redshift range (0 ) could even provide -dependent constraint on the physics of accelerated expansion, and specifically on the cosmic evolution of the dark energy equation of state (e.g. Riess et al., 2007).
The 4DE1 formalism appears to be the most promising path towards identifying extreme Eddington radiators. It remains to be seen whether well-defined observational properties described in this paper and by Wang et al. (2013) could be exploited for refining a cosmologically useful sample. Eddington standard candles can already explore a range of distance where the metric of the Universe has not yet been “charted”. A preliminary sample gives encouraging results but known systematic effects have to be carefully quantified and statistical errors reduced before a successful determination of at least can be claimed.
Acknowledgements
Funding for the SDSS and SDSS-II has been provided by the Alfred P. Sloan Foundation, the Participating Institutions, the National Science Foundation, the U.S. Department of Energy, the National Aeronautics and Space Administration, the Japanese Monbukagakusho, the Max Planck Society, and the Higher Education Funding Council for England. The SDSS Web Site is http://www.sdss.org/.
References
- Abramowicz et al. (1988) M.A. Abramowicz, B. Czerny, J.P. Lasota, E. Szuszkiewicz, Slim accretion disks, Astroph. J. 332 (1988) 646–658.
- Bachev et al. (2004) R. Bachev, P. Marziani, J.W. Sulentic, R. Zamanov, M. Calvani, D. Dultzin-Hacyan, Average Ultraviolet Quasar Spectra in the Context of Eigenvector 1: A Baldwin Effect Governed by the Eddington Ratio?, ApJ 617 (2004) 171–183.
- Baldwin (1977) J.A. Baldwin, Luminosity Indicators in the Spectra of Quasi-Stellar Objects, Astroph. J. 214 (1977) 679–684.
- Bartelmann et al. (2009) M. Bartelmann, C.L. Bennett, C. Burigana, C. Chiosi, M. D’Onofrio, et al., Fundamental Cosmological Observations and Data Interpretation, in: D’Onofrio, M. & Burigana, C. (Ed.), Questions of Modern Cosmology: Galileo’s Legacy, by D’Onofrio, Mauro; Burigana, Carlo, ISBN 978-3-642-00791-0. Berlin: Springer-Verlag Heidelberg, 2009, p. 7-202, Springer Verlag, Berlin-Heidelberg, 2009, pp. 7–202.
- Baskin and Laor (2004) A. Baskin, A. Laor, On the origin of the C IV Baldwin effect in active galactic nuclei, Mon. Not. Royal Astr. Soc. 350 (2004) L31–L35.
- Baskin and Laor (2005) A. Baskin, A. Laor, What controls the CIV line profile in active galactic nuclei?, MNRAS 356 (2005) 1029–1044.
- Bentz et al. (2013) M.C. Bentz, K.D. Denney, C.J. Grier, A.J. Barth, B.M. Peterson, et al., The Low-luminosity End of the Radius-Luminosity Relationship for Active Galactic Nuclei, Astroph. J. 767 (2013) 149.
- Bian et al. (2012) W.H. Bian, L.L. Fang, K.L. Huang, J.M. Wang, The C IV Baldwin effect in quasi-stellar objects from Seventh Data Release of the Sloan Digital Sky Survey, Mon. Not. Royal Astr. Soc. 427 (2012) 2881–2888.
- Boroson and Green (1992) T.A. Boroson, R.F. Green, The emission-line properties of low-redshift quasi-stellar objects, ApJS 80 (1992) 109–135.
- Boyle et al. (2000) B.J. Boyle, T. Shanks, S.M. Croom, R.J. Smith, L. Miller, N. Loaring, C. Heymans, The 2dF QSO Redshift Survey - I. The optical luminosity function of quasi-stellar objects, Mon. Not. Royal Astr. Soc. 317 (2000) 1014–1022.
- Busca et al. (2013) N.G. Busca, T. Delubac, J. Rich, S. Bailey, A. Font-Ribera, D. Kirkby, J.M. Le Goff, et al., Baryon acoustic oscillations in the Ly forest of BOSS quasars, Astron. Astroph. 552 (2013) A96.
- Campbell et al. (2013) H. Campbell, C.B. D’Andrea, R.C. Nichol, M. Sako, M. Smith, et al., Cosmology with Photometrically Classified Type Ia Supernovae from the SDSS-II Supernova Survey, Astroph. J. 763 (2013) 88.
- Chelouche et al. (2012) D. Chelouche, E. Daniel, S. Kaspi, Measurement of the Broad-line Region Size in a Luminous MACHO Quasar, ApJL 750 (2012) L43.
- Conley et al. (2011) A. Conley, J. Guy, M. Sullivan, N. Regnault, P. Astier, et al., Supernova Constraints and Systematic Uncertainties from the First Three Years of the Supernova Legacy Survey, Astroph. J. Suppl. 192 (2011) 1.
- Czerny et al. (2012) B. Czerny, K. Hryniewicz, I. Maity, A. Schwarzenberg-Czerny, P.T. Zycki, M. Bilicki, Towards equation of state of dark energy from quasar monitoring: Reverberation strategy, ArXiv e-prints (2012).
- Davidson (1972) K. Davidson, Photoionization and the Emission-Line Spectra of Quasi-Stellar Objects, Astroph. J. 171 (1972) 213–231.
- Davis and Laor (2011) S.W. Davis, A. Laor, The Radiative Efficiency of Accretion Flows in Individual Active Galactic Nuclei, Astroph. J. 728 (2011) 98.
- Devereux (2013) N. Devereux, The Size, Structure, and Ionization of the Broad-line Region in NGC 3227, Astroph. J. 764 (2013) 79.
- Diamond-Stanic et al. (2009) A.M. Diamond-Stanic, X. Fan, W.N. Brandt, O. Shemmer, M.A. Strauss, et al., High-redshift SDSS Quasars with Weak Emission Lines, Astroph. J. 699 (2009) 782–799.
- Dietrich et al. (2002) M. Dietrich, F. Hamann, J.C. Shields, A. Constantin, M. Vestergaard, F. Chaffee, C.B. Foltz, V.T. Junkkarinen, Continuum and Emission-Line Strength Relations for a Large Active Galactic Nuclei Sample, Astroph. J. 581 (2002) 912–924.
- D’Onofrio et al. (2012) M. D’Onofrio, P. Marziani, J.W. Sulentic (Eds.), Fifty Years of Quasars From Early Observations and Ideas to Future Research, volume 386 of Astrophysics and Space Science Library, Springer Verlag, Berlin-Heidelberg, 2012.
- Dotan and Shaviv (2011) C. Dotan, N.J. Shaviv, Super-Eddington slim accretion discs with winds, Mon. Not. Royal Astr. Soc. 413 (2011) 1623–1632.
- Elvis and Karovska (2002) M. Elvis, M. Karovska, Quasar Parallax: A Method for Determining Direct Geometrical Distances to Quasars, Astroph. J. Lett. 581 (2002) L67–L70.
- Fanali et al. (2013) Fanali, R., Caccianiga, A., Severgnini, P., Della Ceca, R., Marchese, E., Carrera, F. J., Corral, A., Mateos, S. 2013. Studying the relationship between X-ray emission and accretion in AGN using the XMM-Newton Bright Serendipitous Survey. Mon. Not. Royal Astr. Soc. 433, 648-658.
- Folatelli et al. (2010) G. Folatelli, M.M. Phillips, C.R. Burns, C. Contreras, M. Hamuy, et al., The Carnegie Supernova Project: Analysis of the First Sample of Low-Redshift Type-Ia Supernovae, Astron. J. 139 (2010) 120–144.
- Grazian et al. (2000) A. Grazian, S. Cristiani, V. D’Odorico, A. Omizzolo, A. Pizzella, The Asiago-ESO/RASS QSO Survey. I. The Catalog and the Local QSO Luminosity Function, Astron. J. 119 (2000) 2540–2555.
- Grupe et al. (2010) D. Grupe, S. Komossa, K.M. Leighly, K.L. Page, The Simultaneous Optical-to-X-Ray Spectral Energy Distribution of Soft X-Ray Selected Active Galactic Nuclei Observed by Swift, Astroph. J. Suppl. 187 (2010) 64–106.
- Haas et al. (2011) M. Haas, R. Chini, M. Ramolla, F. Pozo Nuñez, C. Westhues, R. Watermann, V. Hoffmeister, M. Murphy, Photometric AGN reverberation mapping - an efficient tool for BLR sizes, black hole masses, and host-subtracted AGN luminosities, Astron. Astroph. 535 (2011) A73.
- Hinshaw et al. (2009) G. Hinshaw, J.L. Weiland, R.S. Hill, N. Odegard, D. Larson, et al., Five-Year Wilkinson Microwave Anisotropy Probe Observations: Data Processing, Sky Maps, and Basic Results, Astroph. J. Suppl. 180 (2009) 225–245.
- Hook (2013) I.M. Hook, Supernovae and cosmology with future European facilities, Royal Society of London Philosophical Transactions Series A 371 (2013) 20282.
- Hubble (1929) E. Hubble, A Relation between Distance and Radial Velocity among Extra-Galactic Nebulae, Proceedings of the National Academy of Science 15 (1929) 168–173.
- Jacoby et al. (1992) G.H. Jacoby, D. Branch, R. Ciardullo, R.L. Davies, W.E. Harris, M.J. Pierce, C.J. Pritchet, J.L. Tonry, D.L. Welch, A critical review of selected techniques for measuring extragalactic distances, PASP 104 (1992) 599–662.
- Juarez et al. (2009) Y. Juarez, R. Maiolino, R. Mujica, M. Pedani, S. Marinoni, T. Nagao, A. Marconi, E. Oliva, The metallicity of the most distant quasars, A&Ap 494 (2009) L25–L28.
- Kaspi et al. (2007) S. Kaspi, W.N. Brandt, D. Maoz, H. Netzer, D.P. Schneider, O. Shemmer, Reverberation Mapping of High-Luminosity Quasars: First Results, Astroph. J. 659 (2007) 997–1007.
- Kaspi et al. (2005) S. Kaspi, D. Maoz, H. Netzer, B.M. Peterson, M. Vestergaard, B.T. Jannuzi, The Relationship between Luminosity and Broad-Line Region Size in Active Galactic Nuclei, ApJ 629 (2005) 61–71.
- Kinney et al. (1990) A.L. Kinney, A.R. Rivolo, A.P. Koratkar, A study of the Baldwin effect in the IUE data set, Astroph. J. 357 (1990) 338–345.
- Korista et al. (1997) K. Korista, J. Baldwin, G. Ferland, D. Verner, An Atlas of Computed Equivalent Widths of Quasar Broad Emission Lines, ApJS 108 (1997) 401–415.
- Krolik and McKee (1978) J.H. Krolik, C.F. McKee, Hydrogen emission-line spectra in quasars and active galactic nuclei, Astroph. J. Suppl. 37 (1978) 459–483.
- Kruczek et al. (2011) N.E. Kruczek, G.T. Richards, S.C. Gallagher, R.P. Deo, P.B. Hall, P.C. Hewett, K.M. Leighly, C.M. Krawczyk, D. Proga, C IV Emission and the Ultraviolet through X-Ray Spectral Energy Distribution of Radio-quiet Quasars, Astron. J. 142 (2011) 130.
- Marziani and Sulentic (2012a) P. Marziani, J.W. Sulentic, Estimating black hole masses in quasars using broad optical and UV emission lines, NARev 56 (2012a) 49–63.
- Marziani and Sulentic (2012b) P. Marziani, J.W. Sulentic, Quasar Outflows in the 4D Eigenvector 1 Context, The Astronomical Review 7 (2012b) 33–57.
- Marziani et al. (2008) P. Marziani, J.W. Sulentic, D. Dultzin, The Broad Line Region of Quasars, in: Revista Mexicana de Astronomia y Astrofisica Conference Series, volume 32 of Revista Mexicana de Astronomia y Astrofisica Conference Series, pp. 69–73.
- Marziani et al. (2010) P. Marziani, J.W. Sulentic, C.A. Negrete, D. Dultzin, S. Zamfir, R. Bachev, Broad-line region physical conditions along the quasar eigenvector 1 sequence, Mon. Not. Royal Astr. Soc. 409 (2010) 1033–1048.
- Marziani et al. (2013a) P. Marziani, J.W. Sulentic, I. Plauchu-Frayn, A. del Olmo, Is Mg II 2800 a Reliable Virial Broadening Estimator for Quasars?, Astron. Astroph. 555 (2013a) A89.
- Marziani et al. (2013b) P. Marziani, J.W. Sulentic, I. Plauchu-Frayn, A. del Olmo, Low-Ionization Outflows in High Eddington Ratio Quasars, ApJ 764 (2013b) 150.
- Marziani et al. (2009) P. Marziani, J.W. Sulentic, G.M. Stirpe, S. Zamfir, M. Calvani, VLT/ISAAC spectra of the H region in intermediate-redshift quasars. III. H broad-line profile analysis and inferences about BLR structure, A&Ap 495 (2009) 83–112.
- Marziani et al. (2003a) P. Marziani, J.W. Sulentic, R. Zamanov, M. Calvani, M. Della Valle, G. Stirpe, D. Dultzin-Hacyan, Using Quasars for Cosmology, Memorie della Societa Astronomica Italiana Supplement 3 (2003a) 218–221.
- Marziani et al. (2001) P. Marziani, J.W. Sulentic, T. Zwitter, D. Dultzin-Hacyan, M. Calvani, Searching for the Physical Drivers of the Eigenvector 1 Correlation Space, ApJ 558 (2001) 553–560.
- Marziani et al. (2003b) P. Marziani, R.K. Zamanov, J.W. Sulentic, M. Calvani, Searching for the physical drivers of eigenvector 1: influence of black hole mass and Eddington ratio, MNRAS 345 (2003b) 1133–1144.
- Mathews and Ferland (1987) W.G. Mathews, G.J. Ferland, What heats the hot phase in active nuclei?, ApJ 323 (1987) 456–467.
- Mineshige et al. (2000) S. Mineshige, T. Kawaguchi, M. Takeuchi, K. Hayashida, Slim-Disk Model for Soft X-Ray Excess and Variability of Narrow-Line Seyfert 1 Galaxies, Publ. Astron. Soc. Japan 52 (2000) 499–508.
- Nagao et al. (2006) T. Nagao, R. Maiolino, A. Marconi, Gas metallicity in the narrow-line regions of high-redshift active galactic nuclei, Astron. Astroph. 447 (2006) 863–876.
- Negrete et al. (2012) A. Negrete, D. Dultzin, P. Marziani, J. Sulentic, BLR Physical Conditions in Extreme Population A Quasars: a Method to Estimate Central Black Hole Mass at High Redshift, ApJ 757 (2012) 62.
- Negrete et al. (2013) C.A. Negrete, D. Dultzin, P. Marziani, J.W. Sulentic, Reverberation and photoionization estimates of the Broad Line Region Radius in Low-z Quasars, ApJ771 (2013) 31.
- Netzer (1990) H. Netzer, AGN emission lines., in: R. D. Blandford, H. Netzer, L. Woltjer, T. J.-L. Courvoisier, & M. Mayor (Ed.), Active Galactic Nuclei, pp. 57–160.
- Netzer and Marziani (2010) H. Netzer, P. Marziani, The Effect of Radiation Pressure on Emission-line Profiles and Black Hole Mass Determination in Active Galactic Nuclei, Astroph. J. 724 (2010) 318–328.
- Nikolajuk et al. (2004) M. Nikolajuk, I.E. Papadakis, B. Czerny, Black hole mass estimation from X-ray variability measurements in active galactic nuclei, Mon. Not. Royal Astr. Soc. 350 (2004) L26–L30.
- Onken et al. (2004) C.A. Onken, L. Ferrarese, D. Merritt, B.M. Peterson, R.W. Pogge, M. Vestergaard, A. Wandel, Supermassive Black Holes in Active Galactic Nuclei. II. Calibration of the Black Hole Mass-Velocity Dispersion Relationship for Active Galactic Nuclei, ApJ 615 (2004) 645–651.
- Palanque-Delabrouille et al. (2013) N. Palanque-Delabrouille, C. Magneville, C. Yèche, S. Eftekharzadeh, A.D. Myers, P. Petitjean, et al., Luminosity function from dedicated SDSS-III and MMT data of quasars in 0.7 z 4.0 selected with a new approach, Astron. Astroph. 551 (2013) A29.
- Panessa et al. (2011) F. Panessa, A. de Rosa, L. Bassani, A. Bazzano, A. Bird, R. Landi, A. Malizia, G. Miniutti, M. Molina, P. Ubertini, Narrow-line Seyfert 1 galaxies at hard X-rays, Mon. Not. Royal Astr. Soc. 417 (2011) 2426–2439.
- Riess et al. (2007) A.G. Riess, L.G. Strolger, S. Casertano, H.C. Ferguson, B. Mobasher, et al., New Hubble Space Telescope Discoveries of Type Ia Supernovae at z = 1: Narrowing Constraints on the Early Behavior of Dark Energy, Astroph. J. 659 (2007) 98–121.
- Sani et al. (2010) E. Sani, D. Lutz, G. Risaliti, H. Netzer, L.C. Gallo, B. Trakhtenbrot, E. Sturm, T. Boller, Enhanced star formation in narrow-line Seyfert 1 active galactic nuclei revealed by Spitzer, MNRAS 403 (2010) 1246–1260.
- Shemmer et al. (2010) O. Shemmer, B. Trakhtenbrot, S.F. Anderson, W.N. Brandt, A.M. Diamond-Stanic, X. Fan, P. Lira, H. Netzer, R.M. Plotkin, G.T. Richards, D.P. Schneider, M.A. Strauss, Weak Line Quasars at High Redshift: Extremely High Accretion Rates or Anemic Broad-line Regions?, Astroph. J. Lett. 722 (2010) L152–L156.
- Shen (2013) Y. Shen, The Mass of Quasars, Bull. Astron. Soc. India 41 (2013) 61–115.
- Shen et al. (2011) Y. Shen, G.T. Richards, M.A. Strauss, P.B. Hall, D.P. Schneider, S. Snedden, D. Bizyaev, H. Brewington, V. Malanushenko, E. Malanushenko, D. Oravetz, K. Pan, A. Simmons, A Catalog of Quasar Properties from Sloan Digital Sky Survey Data Release 7, Astroph. J. Suppl. 194 (2011) 45.
- Silk (2013) J. Silk, Unleashing Positive Feedback: Linking the Rates of Star Formation and Supermassive Black Hole Accretion, ArXiv e-prints (2013).
- Sulentic et al. (2007) J.W. Sulentic, R. Bachev, P. Marziani, C.A. Negrete, D. Dultzin, C IV 1549 as an Eigenvector 1 Parameter for Active Galactic Nuclei, ApJ 666 (2007) 757–777.
- Sulentic et al. (2000a) J.W. Sulentic, P. Marziani, D. Dultzin-Hacyan, Phenomenology of Broad Emission Lines in Active Galactic Nuclei, ARA&A 38 (2000a) 521–571.
- Sulentic et al. (2000b) J.W. Sulentic, P. Marziani, T. Zwitter, D. Dultzin-Hacyan, M. Calvani, The Demise of the Classical Broad-Line Region in the Luminous Quasar PG 1416-129, ApJL 545 (2000b) L15–L18.
- Tang et al. (2012) B. Tang, Z. Shang, Q. Gu, M.S. Brotherton, J.C. Runnoe, The Optical and Ultraviolet Emission-line Properties of Bright Quasars with Detailed Spectral Energy Distributions, Astroph. J. Suppl. 201 (2012) 38.
- Trevese et al. (2007) D. Trevese, D. Paris, G.M. Stirpe, F. Vagnetti, V. Zitelli, Line and continuum variability of two intermediate-redshift, high-luminosity quasars, Astron. Astroph. 470 (2007) 491–496.
- Urry and Padovani (1995) C.M. Urry, P. Padovani, Unified Schemes for Radio-Loud Active Galactic Nuclei, PASP 107 (1995) 803–845.
- Wang et al. (2013) J.M. Wang, P. Du, D. Valls-Gabaud, C. Hu, H. Netzer, Super-Eddington Accreting Massive Black Holes as Long-Lived Cosmological Standards, Physical Review Letters 110 (2013) 081301.
- Wang et al. (1996) T. Wang, W. Brinkmann, J. Bergeron, X-ray properties of active galactic nuclei with optical FeII emission., A&Ap 309 (1996) 81–96.
- Watson et al. (2011) D. Watson, K.D. Denney, M. Vestergaard, T.M. Davis, A New Cosmological Distance Measure Using Active Galactic Nuclei, Astroph. J. Lett. 740 (2011) L49.
- Woo and Urry (2002) J.H. Woo, C.M. Urry, The Independence of Active Galactic Nucleus Black Hole Mass and Radio Loudness, Astroph. J. Lett. 581 (2002) L5–L7.
- Woo et al. (2013) S.C. Woo, D.A. Turnshek, C. Badenes, S. Bickerton, Variability of Broad Emission Lines in High-Luminosity,High-Redshift Quasars, ArXiv e-prints (2013).
- Woosley and Weaver (1995) S.E. Woosley, T.A. Weaver, The Evolution and Explosion of Massive Stars. II. Explosive Hydrodynamics and Nucleosynthesis, Astroph. J. Suppl. 101 (1995) 181–+.
- Zamanov and Marziani (2002) R. Zamanov, P. Marziani, Searching for the Physical Drivers of Eigenvector 1: From Quasars to Nanoquasars, ApJ 571 (2002) L77–L80.
- Zamfir et al. (2010) S. Zamfir, J.W. Sulentic, P. Marziani, D. Dultzin, Detailed characterization of H emission line profile in low-z SDSS quasars, Mon. Not. Royal Astr. Soc. 403 (2010) 1759–1786.