On the relation between Seyfert 2 accretion rate and environment at
Abstract
We analyse different properties of the small scale environment of Seyfert 2 for two samples selected according to the accretion rate parameter , , from the DR7-SDSS survey. We compare the results with two control samples of non-active galaxies that cover the same redshift range, luminosity, colours, morphology, age and stellar mass content. Our study shows that both high and low accretion rate subsamples reside in bluer and lower density environments than the control samples. However, we find that this difference is at least two times stronger for the low accretion rate Seyferts.
In the vicinity of Seyfert 2, red galaxies have systematically lower values of stellar-mass as compared with corresponding control samples. The lower values of stellar mass for red neighbours is more significant at higher density environments and it is more evident for low accretion rate Seyfert. We also find that this effect is independent of the host’s stellar mass.
Our results are consistent with a scenario where AGN occurrence is higher in lower/medium density environments with a higher merger rate and a lack of a dense intergalactic medium (that can strip gas from these systems) that provide suitable conditions for the central black hole feeding. We find this particularly evident for the low accretion rate Seyferts that could compensate through the intergalactic medium the lack of gas of their hosts.
keywords:
active galaxies : statistics– distribution – galaxies: general –1 Introduction
The standard model that explains the widely accepted mechanism responsible for the Active Galactic Nuclei (AGN) phenomenon is based on the accretion of matter by massive black holes (BH) that lie at the centres of galaxies (Lynden-Bell, 1969; Rees, 1984). This effect manifests an intense luminosity that can not be explained by energetic processes generated by stars. There is considerable evidence to suggest that most massive galaxies harbour a central BH (Tremaine et al., 2002; Marconi & Hunt, 2003), however not all massive galaxies have AGN. The underlying reason for the observed occurrence or absence of AGN in massive galaxy hosts is a question central to AGN study and has demanded considerable research effort.
Although the precise details of how the gas cooling and migration processes that trigger and influence AGN activity remain open to debate, most theoretical models (Osterbrock & Miller, 1989; Antonucci, 1993; Urry & Padovani, 1995) suggest that all AGN have similar inner structure, and diversity mostly depends on the system inclination with respect to the observers line of sight. In this unified scheme, this relative geometry determines if broad or narrow line regions are observed. If the torus is face-on, type 1 features are observed, whereas if it is inclined broad-line (or type 1) features are obscured by the dusty torus, and only type 2 features may be observed. In this research we select type 2 AGN, and in particular we focus on how Seyfert 2 accretion activity correlates with galaxy properties in these environments.
The relative contribution of the processes that trigger and influence AGN appear to be redshift dependent. In general, tidal torques generated during galaxy interactions play a role in providing gas inflows that feed central BHs (Sanders, Soifer & Scoville, 1988). This could occur during mergers (Roos, 1981, 1985; Gaskell, 1985; Hernquist & Mihos, 1995), or galaxy harassment (Lake, Katz & Moore, 1998). Interestingly, the presence of multiple BH/AGN in galaxies provides evidence that gas may even be transported to the centers of galaxies during late stage mergers (Begelman, Blandford & Rees, 1980). Conversely, secular evolutionary processes in galaxies that lead to disk instabilities also appear relevant since they produce bars, rings, clumps and spiral structures that have been proposed to play a significant role in transferring (Shlosman, Begelman & Frank, 1990) material towards galaxy centres, and there is evidence that the growth of these structures may even be enhanced during low mass minor mergers (Purcell et al., 2011). Moreover it seems reasonable to consider that during galaxy and AGN evolution, more than one of the aforementioned mechanisms may act simultaneously.
It seems clear that environmental factors affect the probability of AGN occurrence and unraveling these factors will undoubtedly lead to a more general understanding of AGN phenomenology. Considerable progress has recently been made indicating that the galaxy number density around low redshift AGN is similar to that around typical low redshift galaxies found away from high density regions such as the centers of galaxy clusters (Smith, Boyle & Maddox, 1995; Coldwell & Lambas, 2006; Li et al., 2006; Sorrentino, Radovich & Rifatto, 2006). Moreover, although the density around AGN and typical galaxies in the low redshift universe are comparable, interestingly both quasars and AGN environments at lower redshift are particularly populated by blue, disk-type and star-forming galaxies compared to those in the vicinity of typical galaxies up to scales of (Coldwell & Lambas, 2003, 2006).
In low density environments the growth of disk instabilities occurs more preferentially than in denser environments because abrupt dynamical effects (ram pressure stripping, tidal forces, galaxy harassment, major merging, etc) frequently found in galaxy cluster centres are less efficient in removing and heating baryons. The decreased merger efficiency in clusters due to the high relative velocities of cluster galaxies is also a factor of AGN occurrence (Popesso & Biviano, 2006), since the merger rate scales roughly as (Mamon, 1992; Makino & Hut, 1997). Interestingly AGN have also been found between merging clusters (Söchting, Clowes & Campusano, 2002, 2004) where the merger rate may also be higher if progenitor relative velocities are smaller.
From a different perspective, Padilla, Lambas & González (2010) studied the correlation between the detected occurrence of AGN and the local and global environment, using a control sample of non-active galaxies restricting several parameters. This allowed them to draw strong conclusions about the difference between AGN host and non-active galaxy properties with respect to environment. Their results indicate that for AGN host galaxies the morphology-density relation is less significant in comparison with the full SDSS galaxy sample and that AGN located closer to cluster galaxies tend to be bluer than an early type control sample. This, may indicate that AGN very close to high density regions need more available gas to effectively feed the central black hole.
Coldwell et al. (2009) show that environmental differences in the nearby universe are present in the blue and red AGN population tails when compared to typical galaxy environments selected to have similar host colour, redshift, luminosity, stellar mass (), and mean stellar age. The comparative results of Coldwell et al. (2009) reveal the presence of a dichotomy: extremely red AGN hosts typically reside in lower density environments than their non-active red control sample that contain a lower fraction of blue star-forming galaxies. The blue samples, both AGN and non-AGN, on the other hand have similar galaxy number densities, specific star-formation rates and blue galaxy fractions. Interestingly the morphology of both blue samples, AGN hosts and non-active galaxies are significantly different such that a higher fraction of early-type galaxies are found to host AGN as shown in their Figure 5. Even though the morphologies of the red samples are similar this is not reflected in their environments, therefore, the notion of host-AGN co-evolution seems plausible, since different processes may simultaneously affect the evolution of both the host and AGN and these appear to be connected to environment. In this earlier study LINERs and Seyfert 2 were both considered to be AGN type 2, however in this study, we choose to exclude LINERs from the discussion since recent studies have shown that significant numbers of LINER emission is spatially extended and of stellar origin (González-Martín et al., 2009; Capetti & Baldi, 2011; Yan & Blanton, 2012).
On the nature of the typical environment around Seyfert 2 hosts, some analyses has been completed. Storchi-Bergmann et al. (2001) analysed a sample of 35 host galaxies with known AGN, and found a higher percentage had close companions than their control sample of non-Seyfert galaxies. Dultzin-Hacyan et al. (1999) comparing the immediate environments of Seyfert 1 and Seyfert 2 with those of two control samples, find for the Seyfert 2 sample an excess of companions within a projected distance . However, as we show in our previous works, characteristics of the AGN environment can be found within even larger scales of . In this sense, Strand, Brunner & Myers (2008) found that type II AGN are typically found in denser environments than type I AGN on larger scales of the order of . Similarly, Kollatschny, Reichstein & Zetzl (2012), analysing SDSS-DR5 AGN, reported that within an environment of , Seyfert 1 galaxies have on average fewer companion galaxies than Seyfert 2 or HII galaxies.
To date, no large scale studies of the environment of a representative sample of Seyfert 2 hosts (with control to match) has been made. The purpose of this study is to determine the characteristic nature of the galaxy environment that favors Seyfert 2 occurrence and the dependence with the accretion rate of the BH. To do this we discriminate our Seyfert 2 sample according to this parameter.
The layout of this paper is as follows: In Section 2 we briefly describe the Seyfert 2 classification scheme. Section 3 describes the Seyfert 2 subsamples host properties, their dependence with the accretion rate efficiency and the control samples selection. Section 4 analyses the galaxy colours and number density of galaxies surrounding our host Seyfert 2 subsamples. In Section 5 we compare the surrounding galaxy mass distribution around the subsamples. Finally in Section 6 we draw our main conclusions and discuss our results. Throughout this paper, we have assumed a -dominated cosmology, with: , and .
2 Data and Sample Selection
The galaxy samples used in this analysis were taken from the spectroscopic Sloan Digital Sky Survey, Data Release 7 (SDSS-DR7: Abazajian et al. (2009)) which contains galaxies with measured spectra and photometry in five bands, u,g,r,i,z. SDSS-DR7 main galaxy sample is essentially a magnitude (Petrosian, 1976) limited catalogue with , with a median redshift of (Strauss et al., 2002).
For this study we use SDSS-DR7 physical galaxy properties derived and published by Brinchmann et al. (2004); Tremonti et al. (2004); Blanton et al. (2005) and available from MPA/JHU111http://www.mpa-garching.mpg.de/SDSS/DR7/ and NYU222http://sdss.physics.nyu.edu/vagc/ that include: gas-phase metalicities, stellar masses, indicators of recent major star-bursts, current total and specific star-formation rates, emission-line fluxes, Sérsic indices, etc.
2.1 Seyfert 2 Selection
For the AGN selection we use the publicly available emission-line fluxes. The method for emission-line measurement is detailed in Tremonti et al. (2004). Additionally, we have corrected the emission-line fluxes for optical reddening using the Balmer decrement and the Calzetti et al. (2000) dust curve. We assume an and an intrinsic Balmer decrement (Osterbrock & Miller, 1989). Since the true uncertainties in the emission-line measurements were underestimated the signal-to-noise () of every line was calculated with the emission-line flux errors adjusted according to the uncertainties suggested by the MPA/JHU catalogue333http://www.mpa-garching.mpg.de/SDSS/DR7/rawdata.html.
It is important to mention that although Seyfert 1 galaxies are not included in the main SDSS galaxy sample from which we derive the Seyfert 2 AGN, some Seyfert I contamination can be expected. In Seyfert 1 the continuum is affected by non-thermal emission difficulting the proper observation and study of their host galaxy. So, the rejection of type 1 AGN from the galaxy sample, automatically done by the SDSS spectral classification algorithm using Principal Component Analysis goes some way in purifying our sample. Kauffmann et al. (2003), by inspection of the spectra of the most powerful AGN, estimates a contamination of approximately 8% of type 1 AGN in the sample using a similar catalogue from an earlier release.
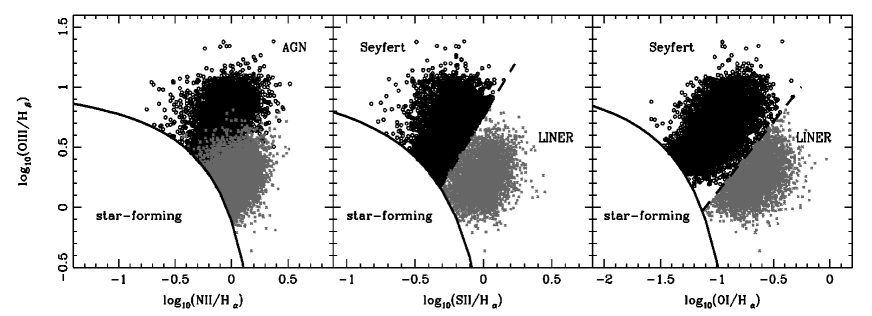
The redshift range of the main sample of emission-line galaxies was restricted to: . The lower limit prevents that small fixed-size apertures affects galaxy properties as derived by the fiber spectra, and the upper limit corresponds to the luminosity completeness limit for the SDSS sample. Furthermore, we conservatively include only galaxies with signal-to-noise ratio (S/N) for all the lines used in the three diagnostic diagrams to discriminate Seyfert 2 from star-forming and LINER galaxies. We note that the S/N cut was selected even though the adjusted uncertainties almost duplicate the original errors and moderately reduce our available sample, however in being more conservative we can be more confident of LINER, Seyfert 2 and starburst host membership, their respective properties as derived and conclusions drawn. Thus, from this refined sample, we separate Seyfert 2, LINER and star-forming using the three standard (Baldwin, Phillips & Terlevich, 1981, : BPT) line-ratio diagrams. AGN/starburst separation, as suggested by Kewley et al. (2001, 2006), depends on the relative source location within BPT diagnostic diagrams, following Eqn: 1 to 3
| (1) |
| (2) |
| (3) |
where Seyfert 2 are located above the Seyfert-LINER line on the
| (4) |
| (5) |
We emphasize that LINERs are not considered bonafide AGN and hence removed using Eqns 4 and 5 and the environmental analysis of the LINERS subsample will be left for a future study. For the sake of internal consistency we also exclude ambiguous galaxies classified as one type of object in one BPT and another in the remaining two diagrams. Bearing this in mind, we obtain a sample of 4035 Seyfert 2. The discriminated samples and the selection criteria are shown in the three BPT diagrams of Fig. 1.
In addition, to test for contamination of Seyfert 1 on our selected sample we study the Full Width at Half Maxima () distribution of the emission lines. Hao et al. (2005) suggest that a provides suitable separation between narrow-line (Seyfert 2) and broad-line (Seyfert 1) AGN. Taking into account this criteria only a 5% of the selected AGN have values of . These AGN were removed from our sample to minimize the Seyfert 1 contamination.
3 Dependence of the host properties and the BH accretion efficiency
The BH growth rate (in mass) depends on AGN activity. In the local universe BHs with the highest growth rates are found at the centres of late-type galaxies that are presently undergoing important internal/external accretion. In comparison more massive BHs have growth rates that are times less efficient since they have already accreted a significant fraction of their masses at higher redshifts during major mergers (Goulding et al., 2010). We set out to extend on previous results and explore other factors that might influence BH growth rates in the local universe. In particular with our SDSS DR7 sample we examine if host galaxy properties and associated environmental parameters might correlate with BH growth rates at different scales.
To estimate the BH accretion rate () we use the standard correlation between the BH mass () and the bulge velocity dispersion () (Tremaine et al., 2002) of Eqn 6.
| (6) |
The velocity dispersion values were taken directly from the MPA/JHU catalogues444http://www.mpa-garching.mpg.de/SDSS/DR7/rawdata.html. We note that the analysis is restricted to Seyfert 2 hosts with 70 km given that the instrumental resolution of the SDSS spectra is 60 to 70 km . This restriction places a lower limit of black hole mass of .
Some of the dispersion in the relation may result from different galaxy morphological types as suggested by Gadotti & Kauffmann (2009); Greene et al. (2010). The intrinsic scatter in relation of early-type galaxies is smaller than that for late-type galaxies (Graham, 2008; Gültekin et al., 2009). Previous results (Kauffmann et al., 2003; Heckman et al., 2004) found that the AGN, of all luminosities, reside mainly in galaxies with prominent bulges such as those of early type galaxies. So, we expect a negligible impact of this estimation in our analysis.
The AGN parameter can be determined following Heckman et al. (2004), using the dust-corrected [OIII] luminosity (see Sec. 2.1) as a tracer of the AGN activity (see for instance, Kauffmann et al., 2003; Heckman et al., 2005).
The values due to AGN activity could be overestimated because of contamination by star-forming regions, in particular for low luminosity AGN. Heckman et al. (2004) compute the average AGN contribution to values for a sample of composite galaxies, located above the Kauffmann et al. (2003) line but below the Kewley et al. (2001) line in the BPT diagram, and then compared these values to those for AGN-dominated galaxies, above the Kewley et al. (2001) line with SDSS data. The results of their work indicate that the values of composite galaxies from AGN activity contribute between 50% to 90% of the total , while for AGN-dominated galaxies more than 90% of the is due to the AGN. Their results agree with that reported by Kauffmann & Heckman (2009).
For the Seyfert 2 selection we have used the conservative boundary of Kewley et al. (2001) and, in addition, have excluded LINER galaxies from the sample by minimizing any contamination by low luminosity AGNs and/or composite galaxies. Therefore, we do not expect any significant contribution by star-forming regions on our values for our Seyfert 2 sample.
The AGN parameter is estimated by Eqn 7.
| (7) |
In Fig. 2 the distribution of the (inset box) and values for our Seyfert 2 is shown. With the aim to investigate the dependence of the accretion rate efficiency of Seyfert 2 with the environment we divide this sample into high (Seyfert-HR) and low (Seyfert-LR) systems, respectively, using the mean value of the distribution (dashed line Fig. 2) as our limit producing a final sample of 1784 Seyfert-HR and 1731 Seyfert-LR.

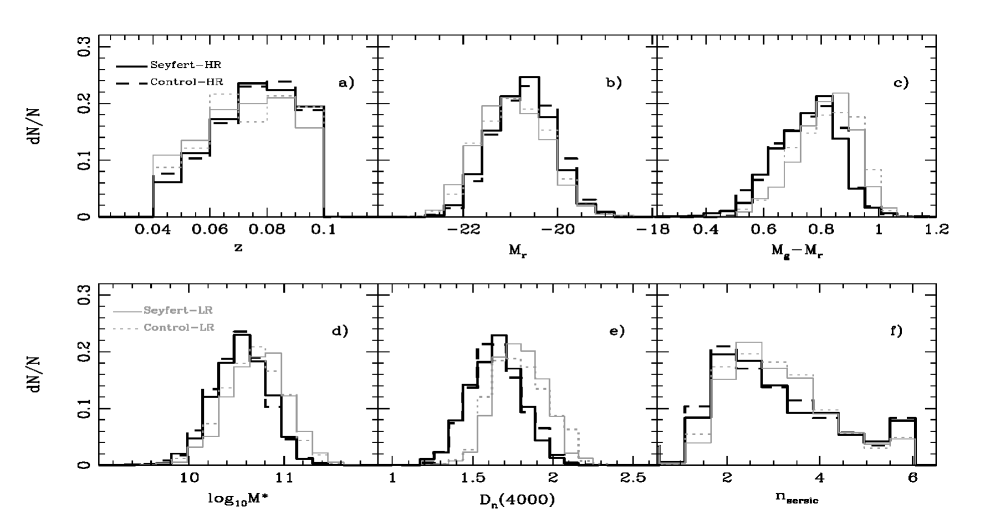
Figure 3 shows the distributions of host properties of our divided samples, in the panels labeled for: Redshift, Extinction and K-corrected (Blanton et al., 2003) absolute r-band magnitude (Petrosian), colour (), stellar mass, , previously determined by Kauffmann et al. (2003b) 555The method relies on spectral indicators relating to the stellar age and the fraction of stars formed in recent bursts., Break index, defined in Kauffmann & Haehnelt (2002) as a proxy for the mean age of the stellar population 666We note that the majority of star formation takes place preferentially in galaxies with low values., and Sérsic index (Sérsic, 1963).
The Sérsic Law, a generalization of the de Vaucouleurs and Freeman laws, relates the surface brightness variation with distance from the galaxy centre. The Sérsic law has the form , where is the intensity at . The Sérsic index , controls the degree of curvature of the profile. The best-fit value of correlates with galaxy size and luminosity such that bigger and brighter galaxies tend to be fit with larger values of (Caon, Capaccioli & D’Onofrio, 1993; Young & Currie, 1994). Most galaxies are fit by Sérsic profiles with indices in the range . Setting gives the de Vaucouleurs profile which is a good description of giant elliptical galaxies. Setting gives the Freeman exponential profile which is a good description of the light distribution of both disk galaxies and dwarf elliptical galaxies.
In Fig. 3 the Seyfert-HR and Seyfert-LR appear to belong to different galaxy populations, as reflected by the host galaxy properties. Host galaxies of Seyfert-HR tend to be bluer and younger than those of Seyfert-LR. This indicates that the is somewhat dependent on galaxy age as seen in the and colour distributions. The normalized numbers of Seyfert-HR and Seyfert-LR also change, more lightly, with host luminosity and such that at low luminosity and there is a larger relative number of Seyfert-HR compared to Seyfert-LR. Conversely at high luminosity and this tendency is reversed. Similarly, the relative fraction of disk host () with Seyfert-HR is higher than those containing Seyfert-LR for the same . These trends are consistent with the general idea that BH in disk galaxies are the fastest growing in the local universe (Goulding et al., 2010). We wish to note that both Seyfert samples have similar redshift distribution so we can be more confident of our results. These results imply that typically both the host and BH properties appear to co-evolve. When the host gas content is evolved or depleted the should also diminish. However cases may also exist in which either an appropriate environment may favor additional activity or an external event that may reactivates the accretion processes (Coldwell et al., 2009).
3.1 Galaxy control samples for Seyfert 2 hosts
There are noticeable differences (as shown) between the host properties of Seyfert-HR and Seyfert-LR and we might expect that characteristics of their environment may reflect these differences. As has been shown, environments of non-active galaxies may differ from those of AGN (Coldwell & Lambas, 2003, 2006). Hence, an appropriate study of the neighbouring galaxy properties to Seyfert-HR and Seyfert-LR is much needed.
In a series of papers Coldwell & Lambas (2003, 2006) and Coldwell et al. (2009), use control samples to understand the behavior of AGN with respect to non-active galaxies and explore their relations with the large and small-scale environment. In almost every case, barring when the AGN hosts are extremely blue, they find that the AGN neighbourhood is populated by bluer and more star-forming galaxies than for the control samples. However, when the AGN hosts are extremely blue, the non-active galaxy counterparts are similarly blue but with different morphology. Nevertheless the environments of both AGN and control samples are quite comparable in terms of number density and general surrounding galaxy properties. These previous results suggest that host morphology and environment, both play a role at triggering or sustaining nuclear activity.
The selection of an appropriate control sample is substantially important to obtain conclusions by direct comparison with galaxies without detected nuclear activity. We compare environmental properties of the Seyfert-HR and Seyfert-LR with the environments of two corresponding control samples of non-active galaxies. The control sample is constructed with galaxy properties matching those of both Seyfert 2 samples, respectively in redshift, luminosity, colour, stellar mass, mean stellar age, and morphology. The Seyfert-LR and Seyfert-HR control sample properties are shown in Fig. 3 (as dotted and dashed lines, respectively). These restrictions ensure that any environmental difference is most likely due to differences in nuclear activity. With these restrictions we have 3246 galaxies in the Control-HR sample, and 3165 galaxies corresponding to the Control-LR.
4 Properties of the surrounding galaxies
Galaxy colours provide an indirect constraint on the evolutionary history of galaxies since many galaxy parameters for example morphology, age, [Fe/H], environmental density all, affect galaxy colours. In high density regions, such as galaxy clusters, the large fraction of red galaxies indicates galaxies of an older stellar population with low star-formation. Whereas galaxies in poor groups and in the field in general have bluer colours with enhanced star-formation. This motivates us, as in previous studies, to use colours to study galaxy properties around AGN and control samples, as well as to constrain properties of their environments.
In order to quantify any excess of blue galaxies in the AGN environments, we calculate the fraction of galaxies bluer than as a function of the projected distance to the sample centres777This fiducial colour is chosen since it approximately corresponds to the mean colour for the spectroscopic survey at . The selected tracer galaxies have projected distances and radial velocity differences , relative to the target systems.
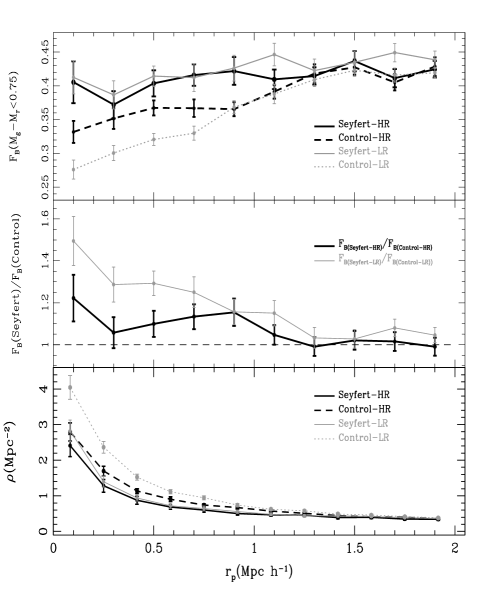
The fraction of blue neighbouring galaxies is shown in the top panel of Fig. 4. The error bars in this figure and in all figures were calculated by using bootstrap error resampling technique (Barrow, Bhavsar & Sonoda, 1984). Around 40 of Seyfert 2 neighbours are bluer than the fiducial mean irrespective of . However, a significant difference exists between the Seyfert 2 neighbourhoods and the respective neighbourhoods centered on their non-active counterparts whereby Seyfert 2 have typically bluer environments. This is evident up to and becomes more notorious at scales smaller than .
This effect is more clearly observed in the middle panel showing the ratios between the fraction of blue galaxies around Seyfert-HR and Seyfert-LR with their respective control samples. The rate between Seyfert-LR and Control-LR samples is approximately 30% higher as compared to the ratio between Seyfert-HR and Control-HR within and this effect extends up to . We note that this effect is notably diluted if we use a radial velocity difference criterion of . Thus, although both Seyfert 2 host galaxies and their matched non-active control sample have similar physical properties (morphology, luminosity, stellar mass and age), their environments do not reflect this fact. Therefore it seems plausible that within the approximate scale size of a galaxy group, co-evolution of the host galaxy and associated AGN activity is likely to depend on environment.
Thinking in terms of the available gas reservoir to the AGN host galaxy, if we assume the Seyfert-LR host is sufficiently evolved and massive, and the amount of gas is insufficient to enhance BH activity, one way to sustain gas accretion would be via gas-dynamical processes that are more frequent in environments populated by a larger numbers of blue, disk-type, star-forming galaxies (Coldwell et al., 2009). On the other hand if we assume the Seyfert-HR host is a less massive evolving galaxy, to sustain its enhanced AGN activity a smaller amount of gas would be required and this is reflected in the smaller difference between blue fractions of Seyfert-HR neighbouring galaxies and Control-HR neighbouring galaxies. Furthermore, the increasing of the blue neighboring fraction, from the centres up to of the control samples (more evident in the Control-LR) would suggest that the standard morphology-age-density relation is followed, since as is well known, mean colours of neighbouring galaxies correlate to differences in the environmental density of galaxies (Dressler, 1980; Domínguez, Muriel & Lambas, 2001). However this relation does not appear to be followed in the neighbourhood of Seyfert 2 hosts, as was studied by Coldwell & Lambas (2006); Coldwell et al. (2009).
We find significant differences in at scales smaller than that relates to AGN activity. Since we wish to examine the morphology-age-density relation further we calculate the galaxy number density around both Seyfert and Control samples within cylinders of projected radius and in depth. The total local number density of galaxies around every target is shown in the bottom panel of Fig. 4. The observed trends indicate that both control samples are located in higher density environments than their active counterparts at the smallest scales probed, a trend that is significantly more pronounced between the Seyfert-LR and Control-LR. This possibly occurs because AGN tend to avoid regions of higher density since in denser environments the AGN occurrence and accretion rate is suppressed. This is in agreement with results determined by Popesso & Biviano (2006) and by Coldwell et al. (2009). Instead, in low density environments, especially those with an excess of blue galaxies, a higher galaxy merger rate could play an important role in the AGN occurrence.
5 Galaxy densities and stellar mass profiles in AGN neighbourhoods
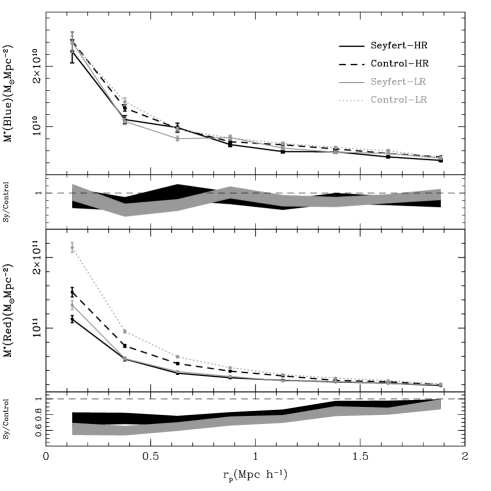
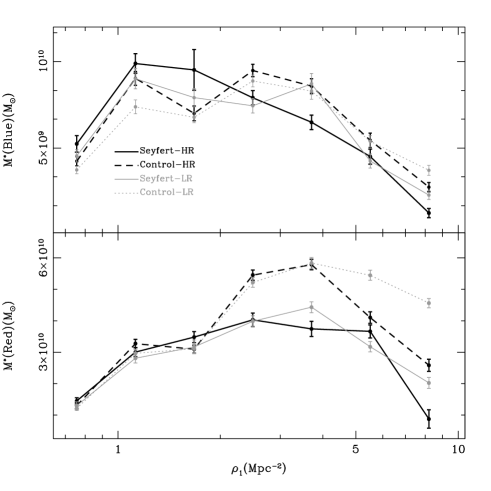
The particular characteristics of number density and blue fraction around Seyfert 2 and control environments as found in the previous section motivates us to explore any dependence in the stellar mass properties of galaxy neighbourhoods around Seyfert 2 and control samples. In Fig. 5 the differential mass profiles for blue (top panel) and red (bottom panel) galaxy neighbours are shown. As is expected the red galaxy neighbourhood is significantly more massive than the blue galaxy neighbourhood. In the blue neighbourhood little difference is observed in the stellar mass distributions between all sample neighbourhoods. This is more clearly exhibited in the respective sub-panel that shows the stellar mass ratio between the neighbourhood of Seyfert and control samples.
For the red neighbourhoods, the stellar mass profiles around Seyfert 2 and control galaxies are significantly different. Seyfert-LR to Control-LR ratios are on average smaller than Seyfert-HR to Control-HR ratios (as observed in the lower sub-panel.) Also worth mentioning is that the red Control-LR neighbourhood is considerably more massive than the red Control-HR neighbourhood, an effect more pronounced at .
We now examine if the stellar mass in galaxy neighbourhoods depends on the galaxy number density around Seyfert 2 galaxies. In Fig. 6 we show the total stellar mass within for blue (top panel) and red (bottom panel) galaxy neighbourhoods as a function of galaxy number density () for each target sample. As can be seen from this figure, at low densities () the total stellar mass of the blue galaxy neighbours is marginally higher for the Seyfert 2 samples than for the control samples. At higher densities a slight reversed tendency is observed with a lack of stellar mass.
Nevertheless, in the case of red galaxy neighbours, the stellar masses present increasing trends up to and are quite similar up to around every target sample. From a stronger distinction is observed between red neighbours of Seyfert and control samples where the difference between Seyfert-HR and Control-HR is approximately 2 sigma and between Seyfert-LR and Control-LR is around 6 sigmas at the highest density. The relatively small amounts of stellar mass in galaxy neighbours (mainly for the red ones) around Seyfert samples compared with that of control samples could suggest a needed condition for the BH feeding where a richer gas environment favors the AGN activity. This is more evident for red galaxy neighbourhood of Seyfert-LR hosts where special conditions could generate a larger gas reservoir and also provide gas transportation to the centre of the host galaxy.
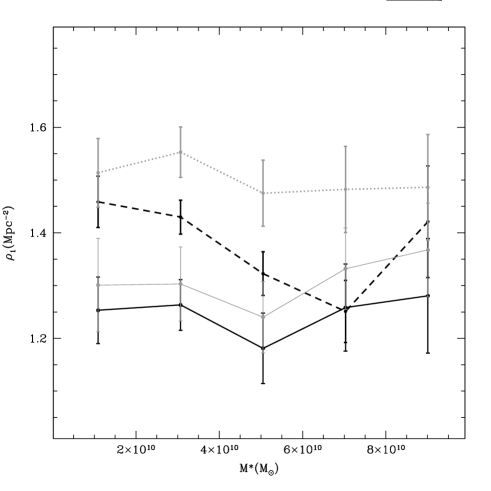
Finally we analysed the local number density of galaxies around the target samples within c as a function of its stellar mass in Fig. 7. A dip in the density for the control-HR galaxies of the order of the errorbars is observed in this figure. Given the large uncertainty for this bin we are unable to distinguish if it is a real effect or an artifact produced by the low number of objects resulting from the density calculation. The global observed tendencies of Fig. 7 show that despite the similar content of stellar mass of neighbouring galaxies, Seyfert 2 and control samples typically live in neighbourhoods of different density. The Seyfert 2 samples reside in lower density environments than do their nonactive counterparts as more clearly shown in Figure 4. This result is consistent with those from Montero-Dorta et al. (2009) who analyze a sample of red Seyfert from SDSS-DR4 and find a tendency where the AGN fraction decreases towards denser environments.
We emphasize that Seyfert-LR hosts typically live in slightly denser environments than Seyfert-HR galaxies. Furthermore, the local density in Seyfert environments does not appear sensitive to the stellar mass of the Seyfert host. On the other hand, the control samples show an excess in local density for almost all bins of stellar mass of the targets, being more significant in the Control-LR sample. This sample having the highest galaxy number density irrespective of target stellar mass.
6 Discussion
In this paper we investigate the environment of two samples of Seyfert 2 AGN, selected by the accretion rate parameter, . The more rapidly growing BHs have lower-masses and are found at the centres of younger and lower mass (stellar) galaxies than those BHs with slower growth rates in the local universe (Goulding et al., 2010). The chosen division in of the Seyfert 2 sample allowed us to examine if environment shows a distinctive feature or characteristic on accretion rate. This is accomplished by comparing our Seyfert-LR and Seyfert-HR neighbourhoods with those neighbourhoods of two control samples selected to match the distribution of redshift, luminosity, colour, stellar mass, age and Sersic index of the Seyfert hosts.
The main results can be summarized as follows:
1) Even though both Seyfert 2 samples produce a large energy output from BH accretion, both samples are found to be in different stages of evolution as can be inferred from their host properties. However, when the environmental properties are considered and compared to those of the control samples, environmental features are revealed that are likely to be related to selection.
2) Both Seyfert 2 samples have bluer environments than their respective control samples, where the fraction of blue galaxies with around Seyfert-HR and Seyfert-LR are similar and constant with projected distance to targets. However the difference of the blue galaxy fraction between Seyfert-LR and Control-LR samples is significantly higher than that between Seyfert-HR and Control-HR. In addition, the differential mass profiles of blue neighbouring galaxies around the target samples indicate that their stellar masses are indistinguishable. However, the stellar mass profiles of the red galaxy neighbours show that the stellar mass of red galaxies around Seyfert samples is lower that that around the control samples. This effect is stronger between Seyfert-LR and Control-LR at reaching an excess at the 5 level at smaller scales. This result suggests that the environment could compensate any gas deficiency of the host galaxies, while at the same time sustaining AGN activity. It should be noted that although AGN feedback processes can not be excluded, it is the environment of Seyfert-LR the most different with respect to that of the respective control sample, as it is evident from Fig. 4.
3) The previous results are reflected in the fact that Seyfert 2 galaxies reside in low density environments. There are several possibilities to explain these effects: (i) in low density environments gas is not likely to be lost due to stripping which can have an important impact in higher density regions (ii) The expected higher galaxy merger rate in low density environments allows fresh gas to be accreted; and (iii) galaxy instabilities are also more probable in less dense environments to provide material that feed BHs, (iv) instabilities may even be enhanced by tidal torques that occur in encounters with low mass galaxies.
4) The stellar mass of blue neighbours shows a small excess around Seyfert 2 samples with respect to control galaxies at low densities. The opposite is observed at higher densities of where Seyfert-HR have systematically blue neighbours with a lower stellar mass content. While for red neighbours at low densities the stellar mass of Seyfert 2 and control samples are indistinguishable, at the stellar mass around Seyferts is lower than for the control, reaching a difference at the 2 level (Seyfert-HR vs Control-HR), and at 6 (Seyfert-LR and Control-LR), at higher densities.
5) Finally, although the low galaxy density found around Seyfert 2 within is independent of the stellar mass of the host galaxies and slightly higher for Seyfert-LR, in the vicinity of galaxies of the control samples a significant difference between Control-HR and Control-LR is found. This would suggest than AGN do not follow the standard morphological-segregation relation expected for non-active galaxies. We suggest that AGN occurrence is higher in lower density regions due to the combination of a higher merger rate and a relative quiescent nature of the gas-dynamical processes in comparison to high density environments.
7 Acknowledgments
We would like to thanks to anonymous referee for the comments that helped to improve the paper. We thanks to Emilio Donoso for useful comments and discussion.
Funding for the SDSS and SDSS-II has been provided by the Alfred P. Sloan Foundation, the Participating Institutions, the National Science Foundation, the U.S. Department of Energy, the National Aeronautics and Space Administration, the Japanese Monbukagakusho, the Max Planck Society, and the Higher Education Funding Council for England. The SDSS Web Site is http://www.sdss.org/.
The SDSS is managed by the Astrophysical Research Consortium for the Participating Institutions. The Participating Institutions are the American Museum of Natural History, Astrophysical Institute Potsdam, University of Basel, University of Cambridge, Case Western Reserve University, University of Chicago, Drexel University, Fermilab, the Institute for Advanced Study, the Japan Participation Group, Johns Hopkins University, the Joint Institute for Nuclear Astrophysics, the Kavli Institute for Particle Astrophysics and Cosmology, the Korean Scientist Group, the Chinese Academy of Sciences (LAMOST), Los Alamos National Laboratory, the Max-Planck-Institute for Astronomy (MPIA), the Max-Planck-Institute for Astrophysics (MPA), New Mexico State University, Ohio State University, University of Pittsburgh, University of Portsmouth, Princeton University, the United States Naval Observatory, and the University of Washington.
References
- Abazajian et al. (2009) Abazajian K.N. et al. , 2009, ApJS, 182, 543.
- Antonucci (1993) Antonucci R., 1993, ARA&A, 31, 473.
- Baldwin, Phillips & Terlevich (1981) Baldwin J. A., Phillips M. M. & Terlevich R., 1981, PASP, 93, 5.
- Barrow, Bhavsar & Sonoda (1984) Barrow J.D., Bhavsar S.P. & Sonoda B.H., 1984, MNRAS, 210, 19.
- Begelman, Blandford & Rees (1980) Begelman M. C., Blandford R. D. & Rees M. J., 1980, Nature, 287, 307.
- Blanton et al. (2003) Blanton M. R., Hogg, D. W., Bahcall N. A. et al. , 2003, ApJ, 594, 186.
- Blanton et al. (2005) Blanton M.R., Eisenstein D., Hogg D.W., Schlegel D.J & Brinkmann J., 2005, ApJ, 629, 143.
- Brinchmann et al. (2004) Brinchmann J., Charlot S., White S. D. M., Tremonti C., Kauffmann G., Heckman T. & Brinkmann J., 2004, MNRAS, 351, 1151.
- Calzetti et al. (2000) Calzetti D., Armus L., Bohlin R.C., Kinney A.L., Koornneef J. & Storchi-Bergmann T., 2000, ApJ, 533, 682.
- Caon, Capaccioli & D’Onofrio (1993) Caon N., Capaccioli M. & D’Onofrio M, 1993, MNRAS, 265, 1013.
- Capetti & Baldi (2011) Capetti A. & Baldi R.D., 2011, A&A, 529, 126.
- Coldwell & Lambas (2003) Coldwell G. V. & Lambas D. G.,2003, MNRAS, 344, 156.
- Coldwell & Lambas (2006) Coldwell G. V. & Lambas D. G., 2006, MNRAS, 371, 786.
- Coldwell et al. (2009) Coldwell G.V., Lambas D.G., Söchting I.K. & Gurovich S., 2009, MNRAS, 399, 88.
- Connolly & Szalay (1999) Connolly A.J. & Szalay A.S., 1999, AJ, 117, 2052.
- Domínguez, Muriel & Lambas (2001) Domínguez M., Muriel H. & Lambas D.G., 2001, AJ, 121, 1266.
- Dressler (1980) Dressler A., 1980, ApJ, 236, 351.
- Dultzin-Hacyan et al. (1999) Dultzin-Hacyan D., Krongold Y., Fuentes-Guridi I. & Marziani, P., 1999, ApJ, 513, 111.
- Gadotti & Kauffmann (2009) Gadotti D.A.& Kauffmann G., 2009, MNRAS, 399, 621.
- Gaskell (1985) Gaskell C. M., 1985, Nature, 315, 386.
- González-Martín et al. (2009) González-Martín O., Masegosa J., Márquez I. & Guainazzi M., ApJ, 2009, 704, 1570.
- Goulding et al. (2010) Goulding A. D., Alexander D. M., Lehmer B. D., & Mullaney J.R., 2010, MNRAS, 406, 597.
- Graham (2008) Graham A.W., 2008, ApJ, 680, 143.
- Greene et al. (2010) Greene J.E., Peng C.Y., Kim M. et al. , 2010, ApJ, 721, 26.
- Gültekin et al. (2009) Gültekin K., Richstone D.O., Gebhardt K. et al. , 2009, ApJ, 698, 198.
- Heckman et al. (2004) Heckman T. M., Kauffmann G., Brinchmann J., Charlot S., Tremonti C., White S. D. M., 2004, ApJ, 613, 109.
- Heckman et al. (2005) Heckman T. M., Ptak A., Hornschemeier A., Kauffmann G., 2005, ApJ, 634, 161.
- Hernquist & Mihos (1995) Hernquist L. & Mihos J.C., 1995, ApJ, 448, 41.
- Hao et al. (2005) Hao L., Strauss M.A., Tremonty C.A. et al. , 2005,
- Kauffmann & Haehnelt (2002) Kauffmann G. & Haehnelt M. G., 2002, MNRAS, 332, 529.
- Kauffmann et al. (2003) Kauffmann G., Heckman T. M., Tremonti C. et al. , 2003, MNRAS, 346, 1055.
- Kauffmann et al. (2003b) Kauffmann G., Heckman T. M., White S. D. M. et al. , 2003, MNRAS, 341, 33.
- Kauffmann & Heckman (2009) Kauffmann G. & Heckman T.M., 2009, MNRAS, 397, 135.
- Kewley et al. (2001) Kewley L.J, Dopita M.A., Sutherland R.S., Heisler C.A. & Trevena J., 2001, ApJ, 556, 121.
- Kewley et al. (2006) Kewley L.J, Groves B., Kauffmann G. & Heckman T.M., 2006, MNRAS, 372, 961.
- Kollatschny, Reichstein & Zetzl (2012) Kollatschny W., Reichstein A. & Zetzl M., 2012, A&A, 548, 37.
- Lake, Katz & Moore (1998) Lake G., Katz N. & Moore B., 1998, ApJ, 495, 152.
- Li et al. (2006) Li C., Kauffmann G., Wang L., White S., Heckman T. & Jing Y., 2006, MNRAS, 373, 457.
- Lynden-Bell (1969) Lynden-Bell D., 1969, Nature, 223, 690.
- Lupton (1993) Lupton R. H., 1993, Statistics in Theory and Practice, Princeton Univ. Press.
- Makino & Hut (1997) Makino J. & Hut P., 1997, ApJ, 481, 83.
- Mamon (1992) Mamon G.A, 1992, ApJ, 401, 3.
- Marconi & Hunt (2003) Marconi A. & Hunt L., 2003 ApJ, 589, L21.
- Montero-Dorta et al. (2009) Montero-Dorta A.D, Crotton D.J, Yan R. et al. , 2009, MNRAS, 392, 125.
- Osterbrock & Miller (1989) Osterbrock D.E. & Miller J.S., 1989, Active Galactic Nuclei. Proc. IAU Symposium 134.
- Padilla, Lambas & González (2010) Padilla, N., Lambas, D.G., & González R., 2010, MNRAS, 409, 936.
- Petrosian (1976) Petrosian V., 1976, ApJ, 209, 1.
- Popesso & Biviano (2006) , 2006 A&A, 460, L23.
- Purcell et al. (2011) Purcell C.W., Bullock J.S., Tollerud E.J., Rocha M. & Chakrabarti S., 2011, Nature, 477, 301.
- Rees (1984) Rees M.J., 1984, ARA&A, 22, 471.
- Roos (1981) Roos N., 1981, A&A, 104, 218.
- Roos (1985) Roos N., 1985, A&A, 294, 479.
- Sanders, Soifer & Scoville (1988) Sanders D. B., Soifer B. T. & Scoville N. Z, 1988, Science, 239, 625.
- Sérsic (1963) Sérsic J. L., 1963, BAAA, 6, 41.
- Shlosman, Begelman & Frank (1990) Shlosman I., Begelman M.C. & Frank J., 1990, Nature, 345, 679.
- Smith, Boyle & Maddox (1995) Smith R. J., Boyle B. J. & Maddox S. J., 1995, MNRAS, 277, 270.
- Söchting, Clowes & Campusano (2002) Söchting I. K., Clowes R. G., & Campusano L. E. 2002, MNRAS, 331, 569.
- Söchting, Clowes & Campusano (2004) Söchting I. K., Clowes R. G., & Campusano L. E. 2004, MNRAS, 347, 1241.
- Sorrentino, Radovich & Rifatto (2006) Sorrentino G., Radovich M. & Rifatto A., 2006, A&A, 451, 809.
- Storchi-Bergmann et al. (2001) Storchi-Bergmann T., González Delgado R.M., Schmitt H.R., Cid Fernandes R. & Heckman T., 2001, ApJ, 559, 147.
- Strand, Brunner & Myers (2008) Strand N.E., Brunner R.J. & Myers A.D, 2008, ApJ688 180.
- Strauss et al. (2002) Strauss M., Weinberg D. H., Lupton, R. H.et al. , 2002, AJ, 124, 1810.
- Tremaine et al. (2002) Tremaine S., Gebhardt K., Bender R. et al. , 2002, ApJ, 574, 740.
- Tremonti et al. (2004) Tremonti C., Heckman T. M., Kauffmann, G. et al. , 2004, ApJ, 613, 898.
- Urry & Padovani (1995) Urry M.C. & Padovani P., 1995, PASP, 803, 107.
- Yan & Blanton (2012) Yan R. & Blanton M.R, 2012, ApJ, 747, 61.
- Young & Currie (1994) Young C. K. & Currie M. J., 1994,MNRAS, 268, 11.