CXOGBS J173620.2–293338: A Candidate Symbiotic X-ray Binary
Associated with a Bulge Carbon Star
Abstract
The Galactic Bulge Survey is a wide but shallow X-ray survey of regions above and below the Plane in the Galactic Bulge. It was performed using the Chandra X-ray Observatory’s ACIS camera. The survey is primarily designed to find and classify low luminosity X-ray binaries. The combination of the X-ray depth of the survey and the accessibility of optical and infrared counterparts makes this survey ideally suited to identification of new symbiotic X-ray binaries in the Bulge. We consider the specific case of the X-ray source CXOGBS J173620.2–293338. It is coincident to within 1 arcsec with a very red star, showing a carbon star spectrum and irregular variability in the Optical Gravitational Lensing Experiment data. We classify the star as a late C-R type carbon star based on its spectral features, photometric properties, and variability characteristics, although a low-luminosity C-N type cannot be ruled out. The brightness of the star implies it is located in the Bulge, and its photometric properties overall are consistent with the Bulge carbon star population. Given the rarity of carbon stars in the Bulge, we estimate the probability of such a close chance alignment of any Galactic Bulge Survey source with a carbon star to be suggesting that this is likely to be a real match. If the X-ray source is indeed associated with the carbon star, then the X-ray luminosity is around erg s-1. Its characteristics are consistent with a low luminosity symbiotic X-ray binary, or possibly a low accretion rate white dwarf symbiotic.
Subject headings:
binaries: symbiotic, stars: AGB and post-AGB, stars: carbon, X-rays: binaries, surveys — stars1. Introduction
In most cool stars, oxygen is more abundant than carbon, resulting in most carbon being bound in CO molecules and the residual oxygen forming compounds such as TiO. Among a minority, the carbon stars, carbon is more abundant reversing this pattern, and as a result spectra are dominated by carbon compounds such as C2, CN, and CH. The carbon stars form a heterogeneous population (Wallerstein & Knapp, 1998). The modern classification is based on that of Keenan (1993), and does not fully reflect the likely evolutionary status of the stars. Two broad categories of C-R and C-N stars are identified, based on the earlier R and N spectral types. C-N stars are the easiest to understand, being asymptotic giant branch (AGB) stars in which carbon is brought to the surface during the third dredge-up. Early C-R stars appear to be core helium burning red-clump stars (Zamora et al., 2009). It is speculated that the carbon excess is related to an anomalous helium flash, possibly involving a binary merger, although models do not yet reproduce this behavior. Zamora et al. (2009) show that late C-R stars are chemically indistinguishable from C-N stars, and so are also AGB stars. C-J stars show enhanced 12C and Li abundances and may also be a heterogeneous group; their nature remains unclear (Abia & Isern, 2000). These classes are likely all intrinsic carbon stars, responsible for their own carbon overabundance. There are also several classes of extrinsic carbon stars in which the excess carbon was accreted from an evolved companion. These include the barium stars and their population II counterparts, the C-H stars. Many of these are found to have white dwarf companions.
Symbiotic stars are interacting binaries in which a compact object, usually a white dwarf, accretes from a red giant star (e.g. Mikołajewska, 2007). In most symbiotics, the red giant appears to be a normal, oxygen-rich star, but of the 188 symbiotics in the catalog of Belczyński et al. (2000) about 6 % have carbon star companions. Half of these are in the Magellanic Clouds, leaving Galactic carbon star symbiotics quite rare. One of the defining characteristics of the symbiotic star population is that they usually show an emission line spectrum, though exceptions do exist (Munari & Zwitter, 2002) and may represent a sub-class of low accretion rate symbiotics.
There is also a small population of symbiotic X-ray binaries (SyXBs) which instead host a neutron star (Masetti et al., 2006). There are seven reasonably firm candidates (Masetti et al., 2012, and references therein), plus one tentative candidate that is identified with a carbon star (Masetti et al., 2011). The total Galactic population of SyXBs has recently been estimated at 100–1000 (Lü et al., 2012). The best studied SyXB is GX 1+4 (Chakrabarty & Roche, 1997), which has a high X-ray luminosity ( erg s-1) and an optical spectrum rich in emission lines. As more candidates have been discovered, these characteristics have been found to be the exception rather than the rule, and the other candidates have inferred X-ray luminosities of erg s-1. They typically show very hard and highly variable X-ray spectra. Presumably because of the low X-ray luminosity, and absence of a strong UV source to ionize the red giant wind, the optical spectra are usually lacking in emission lines making secure confirmation of a SyXB nature challenging.
In addition to these candidate SyXBs, van den Berg et al. (2006) identified 13 X-ray selected symbiotics in the Bulge. They found quite hard X-ray spectra and a paucity of emission lines, suggesting that this sample may well include some, or even a majority of SyXBs, or alternatively that X-ray selected white dwarf symbiotics define a different population from those previously identified optically. The objects found by van den Berg et al. (2006) suggest that looking for X-ray selected cool giants may be an efficient way to expand the symbiotic parameter space, including identifying more SyXBs, as cool giants are intrinsically very weak X-ray sources (Güdel, 2004; Ramstedt et al., 2012).
The Galactic Bulge Survey (GBS) is an 0.3–8.0 keV X-ray survey performed with Chandra’s ACIS-I camera (Jonker et al., 2011). It was specifically optimized to identify low-luminosity neutron star X-ray binaries in the Bulge, with a limiting X-ray sensitivity of erg cm-2 s-1 (for a , cm-2 power-law spectrum) which translates to a luminosity limit of erg s-1 at the Bulge distance. By observing at , the survey focuses on regions of reduced absorption relative to that of the Plane, so we can expect that most of the SyXBs in the survey area should be detected as X-ray sources. The modest extinction, coupled with the high optical and IR brightness of the companion stars in SyXBs means that we also can expect to detect the optical/IR counterparts and classify the systems. There is thus a reasonable prospect that the GBS can identify most of the SyXBs along its line of sight and thus provide a near-volume limited survey to test the population models.
Looking for Bulge symbiotics, SyXBs and white dwarf systems, is also potentially of interest if objects can be found with carbon star companions. Examining the distribution of objects in the Catalog of Galactic Carbon Stars (CGCS; Alksnis et al., 2001), it shows a pronounced deficit of objects in the vicinity of the Bulge, in spite of the high density of red giants there. The entire 12 square degree field of the GBS contains just 5 objects from the CGCS. Blanco & Terndrup (1989) found only 5 carbon stars among a sample of 2187 late M giants in the Bulge, implying a C-M ratio of just 0.0023. This can be compared to the Large and Small Magellanic Cloud C-M ratios of 0.8 and 13.8 respectively (Blanco & McCarthy, 1983), and a radial gradient from 0.2 to 0.7 in the disk of M33 (Rowe et al., 2005). Besides their rarity, the carbon stars found in the Bulge, for example the 34 objects of Azzopardi et al. (1991), are also markedly less luminous than those in the Magellanic Clouds. Indeed, Ng (1997) went so far as to suggest that there are no carbon stars in the Bulge, and that the objects found are actually more distant objects associated with the Sagittarius Dwarf Spheroidal galaxy seen through the Bulge. Whitelock et al. (1999) has challenged this, however, arguing that the photometric properties of the Bulge carbon stars are inconsistent with those of the carbon stars definitely associated with the Sagittarius Dwarf. Finding SyXBs associated with Bulge carbon stars can potentially then shed light on the evolutionary history of these objects, for example via modeling the spin history of their neutron stars (Lü et al., 2012).
Optical spectroscopy of counterparts to GBS X-ray sources is ongoing using a number of facilities. Here we report on the first candidate SyXB identified by the GBS with spectroscopic classification from Gemini-South and the Very Large Telescope, CXOGBS J173620.2–293338 (henceforth CX332 following the source numbering of Jonker et al. 2011). This X-ray source is coincident with a very red star, 2MASS J17362020–2933389, also identified as an Optical Gravitational Lensing Experiment (OGLE) irregular variable (OGLE IV BLG 654.20 36111; Udalski et al. 2012). This counterpart shares the characteristics of Bulge carbon stars.
2. Data Reduction
2.1. CTIO Blanco Mosaic-2 Imaging
The field of CX332 was observed using the Mosaic-2 camera on the 4 m Blanco telescope at the Cerro-Tololo Inter-American Observatory from 2010 July 12 to 18. We obtained 120 sec exposures in the SDSS filter several times per night as part of an extensive program to obtain photometry of GBS sources (Britt et al. in preparation). The images were reduced with the NOAO Mosaic Pipeline (Shaw, 2009) which added astrometric and (approximate) photometric calibrations using the USNO B1.0 catalog (Monet et al., 2003).
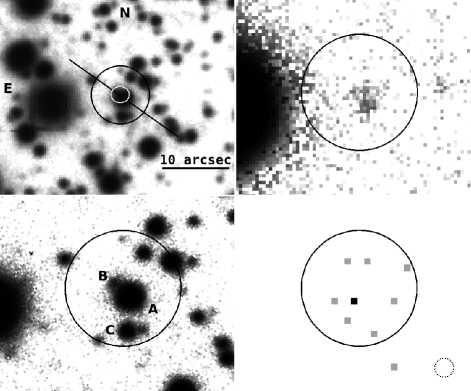
We combined the nine images with the best seeing to form an average shown in Fig. 1. We checked the astrometry against ten nearby objects matched with 2MASS objects. The agreement was excellent, with the Mosaic solution differing from 2MASS by arcsec in RA and Dec. respectively. We also overlay on Figure 1 the Chandra position. Two regions are indicated. The inner ellipse indicates 95 % confidence wavdetect uncertainties reported by Jonker et al. (2011) combined in quadrature with the Chandra aspect uncertainty. The outer circle is a more conservative 95 % confidence region based on the prescription of Hong et al. (2005). The latter explicitly accounts for the degradation of the point-spread function off-axis, and so may be more realistic for a source observed 7.85 arcmin off-axis. However, in Figure 1 we also show the Chandra image with individual events localized. Based on the event locations, the outer circle actually appears to be an over-estimate of the plausible uncertainty in the source position. We note that while the systematic Chandra aspect undertainty is taken account of, it is a negligible contribution to the current positional uncertainty (see Fig. 1). The Chandra observation was too shallow to allow correction of the aspect uncertainty by cross-correlation with other sources in the field.
The X-ray position is very close to a bright star (A) and a faint companion (B) to the north-east; the X-ray localization is not good enough to discriminate between these. We measure a brightness for star A of , with the uncertainty dominated by that of the USNO-based calibration. Several other stars cannot securely be ruled out at 95 % confidence, but are less likely counterparts since the source is most likely to be near the center of a 95 % confidence region. We label the next brightest credible candidate star C.
We also examined our Mosaic-2 images using the image subtraction technique (Alard & Lupton, 1998; Alard, 2000). Some variability from star A is detected in the variance images (Figure 1), but this is actually quite low amplitude and the variability of star A is much better sampled by OGLE observations (Udalski et al., 2012, Section 5). No signal is seen in the variance image from stars B or C.
2.2. Archival Photometry
Archival photometry is available for star A from a number of sources, principally in the IR. We make most use of the Two Micron All Sky Survey (2MASS) All-Sky Catalog (Cutri et al., 2003), corroborated by the Deep Near Infrared Survey of the Southern Sky (DENIS) (DENIS Consortium, 2005) in the near-IR. In the mid-IR we have Wide-Field Infrared Survey Explorer (WISE) All Sky Data Release (Cutri & et al., 2012) and the Galactic Legacy Infrared Mid-Plane Survey Extraordinaire (GLIMPSE) Source Catalog (Spitzer Science Center, 2009). In addition, Star A was included in the OGLE Galactic Bulge area as BLG 654.20, and a lightcurve is presented by Udalski et al. (2012). We include their band magnitude in our photometry database, and discuss their lightcurve in Section 5. We summarize the available archival photometry in Table 1
| Survey | Filter | Magnitude |
|---|---|---|
| Mosaic-2 | ||
| OGLE | 15.156 | |
| 2MASS | ||
| DENIS | ||
| GLIMPSE | [3.6] | |
| [4.5] | ||
| [5.8] | ||
| [8.0] | ||
| WISE | W1 | |
| W2 | ||
| W3 | ||
| W4 |
2.3. Gemini-S/GMOS Spectroscopy
Stars A and B were observed with the Gemini Multi-Object Spectrograph (GMOS) on the Gemini-South telescope as part of a spectroscopic survey of GBS counterparts. The acquisition image had a better image quality than the Mosaic-2 images and clearly resolves stars A and B, so we also show it in Figure 1.
Two 450 s exposures were obtained on 2010 March 18 using the R150 grating spanning the full accessible CCD spectrum at 17 Å resolution, spread over two CCDs. The slit was aligned to pass through both stars A and B (see Figure 1. The spectra were independently reduced using the Gemini iraf package, and using a manual reduction in iraf111IRAF is distributed by the National Optical Astronomy Observatories, which are operated by the Association of Universities for Research in Astronomy, Inc., under cooperative agreement with the National Science Foundation.. We retained the manual optimal extraction which was found to be somewhat cleaner. Flat-fielding used a single flat taken immediately after the object frames and wavelength calibration was performed relative to a daytime CuAr arc spectrum following standard GMOS procedures.
Extraction of the spectrum of star A proceeded normally using optimal extraction methods within iraf. The extraction region was chosen to exclude that contaminated by star B. To aid comparison with atlas spectra, we applied a crude flux calibration using the spectrophotometric standard LTT 7379 (Hamuy et al., 1994). This was not observed on the same night, and so does not provide a precise flux calibration, but suffices to remove most of the effects of the instrumental response, except at the longest wavelengths. The full extracted spectrum combining both CCDs in shown in Fig. 2. Star A is clearly a carbon star showing strong features of C2 at 5200 Å and 5600 Å, and multiple CN features from 5700–6600 Å.
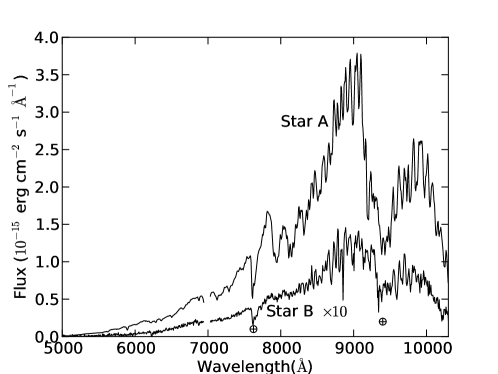
Star B was more challenging. We adapted the methods of Hynes (2002) to extract its spectrum. We could not use this approach exactly as there was not a co-aligned, isolated PSF template star to use. We began by subtracting a two-dimensional fit to the sky. To deal with the blending, we assumed that the profile of the star A should be spatially symmetric and so reflected the two-dimensional spectrum around the trace of star A. This did not work well in the core of the profile where the interpolation of the reflected profile was inadequate to describe the data, but did work well in the wings. In particular, the profile of star B was well defined, and isolated from the residuals to the fit in the core of star A. We then proceeded to follow Hynes (2002) and optimally extract the spectrum of the star B adding the subtracted light from the bright star to the effective sky image to ensure proper weighting of pixels across the profile. Once extracted, the spectrum was calibrated as for the star A, and is also shown in Figure 2. Compared to star A, the spectrum is relatively featureless, and dominated by the atmospheric A band at 7600 Å and the water feature at 9300 Å. No emission features are present.
2.4. VLT/VIMOS Data
Stars A and C were also observed with VIMOS (Le Fèvre et al., 2003), an imager and multi-object spectrograph mounted on the Nasmyth focus of the 8.2-m European Southern Observatory Unit 3 Very Large Telescope at Paranal, Chile. The medium resolution (MR) grism was used to yield a 2.5 Å/pixel dispersion and a wavelength coverage of Å. The use of 1.0 arcsec width slits provided a spectral resolution of Å FWHM. The spectroscopic observations of CX332 were obtained on 2011 July 3 in service mode under program 085.D-0441(A). They consisted of two spectroscopic integrations of 875 s, along with three flat-field exposures and a helium-argon lamp exposure for wavelength calibration. Standard data reduction was performed with the ESO-VIMOS pipeline (Izzo et al., 2004) which averaged the two spectra and automatically extracted the objects found on the slit. To handle saturation effects in the spectrum of CX332, we extracted interactively with the iraf kpnoslit package the reduced 2-D frame that contain both stellar and sky spectra (pipeline file with product code SSEM). We refer the reader to Torres et al. (in preparation) for further details on the VIMOS spectroscopy for GBS sources.
3. Identifying the Optical Counterpart to CX332
3.1. Alternative Counterparts
Star A, the carbon star, is clearly the brightest candidate counterpart, and is the only optical variable detected within the Chandra error circle, but star B is also close to the center of the error circle. As noted above, star B shows an unremarkable spectrum and no detected variability. No emission lines are seen, in particular at the location of H region. It is also quite red, comparable to the star A. These characteristics suggest a reddened star in the Bulge, possibly a K-type giant, as no molecular bands are present to signify an M spectral type.
To estimate the brightness of star B we extracted an average spatial sky-subtracted profile from the Gemini spectra for the spectral region 7289–8831 Å approximately corresponding to the band. Both stars show clean, marginally resolved profiles. We perform a joint fit to both profiles with two Voigt profiles, with the same Gaussian and Lorentzian widths and find a brightness ratio of 0.039, corresponding to a magnitude difference of 3.5 magnitudes. At the time of the Gemini observation, the OGLE magnitude of star A was about 15.2, so we estimate that star B is at . At the mean Bulge distance, and reddening (see Section 6), this corresponds to , too faint to be a giant at 8 kpc. It may be a giant on the far side of the Bulge, a Bulge sub-giant, or a foreground dwarf. If this were the X-ray counterpart, with an 8 photon detection ( erg cm-2 s-1; Jonker et al. 2011) then it is too X-ray bright for the expected RS CVn distribution (Fig. 3 of Jonker et al. 2011) and lacks the emission lines expected for a quiescent cataclysmic variable or intermediate polar.
We also obtained a VLT/VIMOS spectrum of star C with the same configuration as for star A. This is also unremarkable and shows no emission features. The absorption features detected are typical of G and early K stars. Like star B, it is not detected as an optical variable. We conclude that neither stars B nor C are likely to be the counterpart to the X-ray source, leaving star A, the carbon star, as the most probable counterpart.
3.2. Chance Coincidence Probability
A complementary approach is to assess the likelihood of a chance alignment of one of the GBS X-ray sources with a rare object such as a Bulge carbon star. The X-ray position reported by Jonker et al. (2011) is , where the Chandra aspect uncertainty of 0.6 arcsec (90 % confidence) has not been included. The best position for the carbon star is from 2MASS, and . The X-ray/IR positional offset is therefore arcsec, and arcsec. Adding the 1 aspect uncertainty in quadrature, the 1-d offset is ″. The X-ray source is clearly consistent with the carbon star.
We can estimate the probability of a chance coincidence based on the expected surface density of carbon stars. Masetti et al. (2011) attempted to estimate this for CGCS 5926 by assuming a total population of about 2000 carbon stars in the Galaxy, and an effective surface density of 0.5 per square degree. This estimate is based on known sources within the CGCS and is likely a severe underestimate. The CGCS contains 5 carbon stars within the 12 square area of the GBS, close to what Masetti et al. (2011) assumed. While it is true that carbon stars appear to be exceptionally rare in the Bulge, systematic surveys have found that there are more than this. We can make some more realistic estimates based on other studies of carbon stars in the Bulge. First, we can compare with the catalog of Azzopardi et al. (1991). 34 stars were identified in 9 fields (with some overlap). On average they find 4 carbon stars per 55 arcmin square field implying a density of 4.8 carbon stars per square degree, an order of magnitude higher than Masetti et al. (2011) assumed. Alternatively, we can note that Blanco & Terndrup (1989) found just 5 carbon stars among 2187 M5 or later type giants surveyed in the Bulge, corresponding to a C-M ratio of 0.0023. The Besancon Galactic Model (Robin et al., 2003) predicts a density of 7300 M5–9 giants per square degree in the vicinity of CX332. With the C-M ratio of Blanco & Terndrup (1989), we then expect around 17 carbon stars per square degree. This is a little higher than found by Azzopardi et al. (1991), but CX332 is closer to the Plane than their fields were. Considering 17 carbon stars per square degree to be the most optimistic prediction, we then expect a probability of that a carbon star will be found within 1 arcsec of CX332, or of a chance alignment within 1 arcsec of any of the 1640 GBS X-ray sources. This supports our conclusion that star A is most likely to be the true optical counterpart to CX332, and from here on this work focuses on the properties of this object.
4. Spectral Classification
We begin classification of star A by comparing the 5000–7000 Å spectrum to standard examples from Barnbaum et al. (1996). For each one, we convolve the template spectrum with a 10 Å Gaussian to provide a closer match to the instrumental resolution of the VLT spectrum, and scale the spectrum to match our count levels. Adjustments in this scaling were made between different wavelengths to correct for differences in the shape of the two spectra. The relative strength of features between the template and our target should thus be independent of uncertainties in calibration and dereddening of our spectrum.
The primary diagnostic that can be used to reject many of the atlas spectra is the strength of the C2 Swan bands at 5200 Å and 5600 Å. Both the overall strength of the bands, and the relative strength of the two, distinguish different classifications, although this primarily is a discriminant of the C2 index.
We find that fair matches are possible with either C-R types or C-N types. All of the C-J spectra included by Barnbaum et al. (1996) show much stronger C2 Swan bands (C2 indices of 5 or 5.5) than observed and can be discounted, as can the barium stars which show much weaker bands. The C-H stars are a closer match, but still notably inferior to C-R or C-N types, at least within the parameter ranges sampled by Barnbaum et al. (1996).
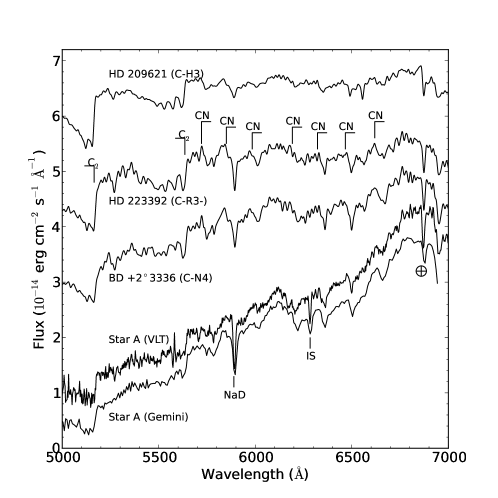
Among the C-R stars, the best fit was for HD 223392 (C-R3, C2 4), with a reasonable match also for HD 76846 (C-R2, C2 4). C-R stars with C2 indices of 1.5-3.0 substantially underpredict the carbon bands, those with C2 index of 5.5 strongly overpredict them. The best fitting C-N star was BD 3336 (C-N4, C2 3). The closest match we could find among the C-H stars was HD 209621 (C-H3, C2 4.5). This reproduces the C2 bands, but underpredicts the strength of CN. We show the spectra of star A dereddened with (see Section 7) together with the best spectral matches in Figure 3.
While we have examined all of the digitized spectrum from Barnbaum et al. (1996), we are limited in parameter space by the stars included, and since our primary diagnostic is the strength of the C2 bands, we mainly are sensitive to the C2 index, rather than the temperature. To check this classification we also examined the VLT band spectrum in the vicinity of the Ca ii triplet which is sensitive to temperature in carbon stars (Richer, 1971). We show this region in Figure 4. Richer (1971) classifies the near-IR spectra into a temperature sequence from C0–C7. This system does not exactly correspond to the system of Keenan (1993) which is the basis of the Barnbaum et al. (1996) atlas, but we can identify correspondences between the two systems where stars are present in both. In particular, Richer (1971) includes many C5 objects, the majority of which are also classified as C-N5 by Barnbaum et al. (1996).
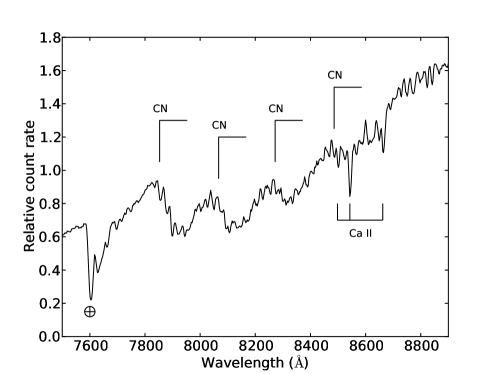
The first thing we note is the presence of multiple prominent CN bandheads. This rules out the C0–C2 classifications, in which these are virtually undetected; the first class in which they are prominent is C3. The relative strength of the Ca ii lines to the CN bands points to not much later than this, as the 8498 Å line should be overwhelmed by CN by C5. CN and Ca ii features thus point to a C3–C4 classification. The C0–C2 stars identified by Richer (1971) are mostly a mix of C-R and C-H stars with temperature indices of 1–3. Since these do not match our spectrum, we can rule out an early C-R classification, leaving the near-IR spectra favoring a C-R3–5 or C-N3–5, roughly consistent with the red classification. We conclude that star A is a late C-R or early C-N star. Both types are considered to be near the bottom of the AGB (Zamora et al., 2009).
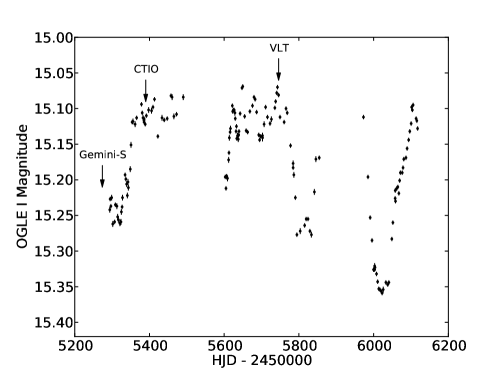
5. Variability
The optical counterpart to CX332 was identified as an irregular variable using OGLE data (Udalski et al., 2012), with magnitude listed as 15.156, and no detection. We reproduce the lightcurve in Figure 5 and indicate the times of our observations. The behavior seen is quite typical of carbon stars on the AGB, with the dips indicating periods of dust formation. This star would be classified as a slow irregular variable (Lb; Wallerstein & Knapp, 1998). The dips are relatively shallow compared to some carbon stars, and so the dust formation is modest and there is unlikely to be significant local extinction to be accounted for. The behavior does indicate that the star is an AGB star, as variability and dust formation is not seen in the red clump giants associated with early C-R stars (e.g. the tabulation of Barnbaum et al., 1996). The variability also is additional evidence against identifying star A as a barium or C-H star in which the carbon overabundance is a result of binary evolution; these are typically non-variable. We note that a few of the later C-H type stars listed by Barnbaum et al. (1996) are irregular or semi-regular variables. C-H stars appear to be population II counterparts to R stars (see e.g. Barnbaum et al., 1996) and so it is likely that they share the dichotomy between early and late C-R stars (Zamora et al., 2009) with some late C-H stars not being products of binary evolution. In any case, C-H stars provided a poorer match to the spectrum of star A than C-R or C-N stars. The variability then supports the identification of the counterpart as either a late C-R or C-N type AGB star. The low amplitude behavior is quite consistent with other late C-R stars in particular, for example the C-R4 stars listed by Barnbaum et al. (1996) are all semi-regular (SR) or irregular (Lb) variables. Of these, the C-R4 carbon star RV Sct is included in the All Sky Automated Survey Catalog of Variable Stars (Pojmanski, 2002). It shows irregular variability with an amplitude around 0.4 mags in , and timescales similar to star A.
6. Spectral Energy Distribution
We compile the photometry from Table 1 into a spectral energy distribution in Fig. 6. Effective wavelengths and zeropoints or AB offsets are taken from Frei & Gunn (1994), Fukugita et al. (1995), Tokunaga & Vacca (2005), Spitzer Science Center (2009), and Jarrett et al. (2011).
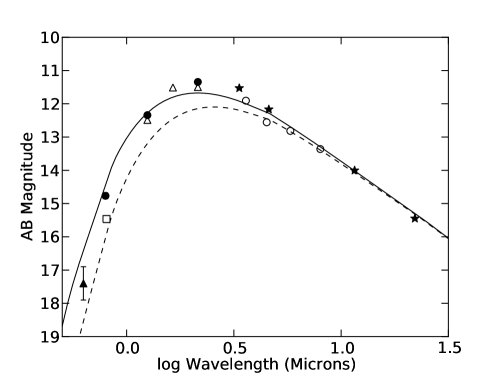
The line-of-sight extinction to our Bulge fields has been estimated by Gonzalez et al. (2011) and Gonzalez et al. (2012) based on red clump stars in VVV data. For CX332, we find . Wallerstein & Knapp (1998) compile effective temperature estimates for a number of C-N stars, and in particular for a sample of 11 C-N5 stars, the effective temperature is K. C-R stars appear to be systematically hotter. For three C-R3–5 stars, Dominy (1984) quote K.
We therefore overlay blackbody spectra at temperatures of 3050 K and 4430 K, both reddened by using coefficients from Cardelli et al. (1989) in the optical and near-IR and Bilir et al. (2011) for the WISE bandpasses. These should be representative of early C-N and late C-R stars respectively. In as much as the SED can be crudely characterized by a reddened blackbody the agreement is fair, so the SED is consistent with a terminally reddened Bulge late C-R or early C-N star, as inferred spectroscopically. The SED follows the blackbodies out to the W4 band (22 m) indicating little if any dust emission is significant. This is consistent with the quite modest dust production implied by the low-amplitude OGLE lightcurve.
7. Carbon Star Luminosity
We can best estimate the source luminosity using the band magnitudes, as these minimize the intrinsic variance in absolute magnitude among the AGB stars, and also greatly reduce the impact of extinction uncertainties. Wallerstein & Knapp (1998) estimated absolute magnitudes for a sample of nearby carbon stars using Hipparcos parallaxes. For the 9 Lb stars, they find , a value indistinguishable from the 12 SRb variables in their sample suggesting that variability type is not a discriminating factor. For the 16 stars classified as C-N, the mean is .
As discussed in Section 6, we adopt , and hence for a Cardelli et al. (1989) extinction curve. The spectral energy distribution supports this reddening, and in turn a location in the Bulge. If we then assume a distance of 8 kpc, we derive an absolute magnitude around . Allowing for a range in Bulge distances from 5–13 kpc results in an absolute magnitude range from to . These values are towards the bottom of the range of the sample of Wallerstein & Knapp (1998). At 8 kpc it would be more luminous than the carbon stars SZ Lep and RU Pup, so there is no actual inconsistency. The observed band brightness is thus consistent with a fairly low luminosity AGB type carbon star in the Bulge.
The inferred low luminosity is not unique to star A, but is a common characteristic of Bulge carbon stars (Azzopardi et al., 1991). We examine this systematically in Figure 7. We assume a distance of 8 kpc and extinction values from Gonzalez et al. (2012) to deduce unreddened colors and absolute band magnitudes of both star A and Azzopardi’s sample. For comparison, we also combine absolute magnitudes from Wallerstein & Knapp (1998) with 2MASS colors to add nearby C-N stars to the diagram. For the latter, the 2MASS photometry is saturated, and quoted magnitudes are deduced from fitting the wings of the profiles. This introduces larger uncertainties, but should be useful to crudely indicate the typical colors. Since these objects all lie within 1 kpc, we have assumed is negligible; for a typical local extinction of mags per kpc, we then expect , which is smaller than the uncertainty in the 2MASS color. These objects are not intended to define a complete sample of Galactic carbon stars; as noted by Wallerstein & Knapp (1998) there are a variety of systematic selection effects in the Hipparcos carbon star sample. Rather the intent is to indicate where the ‘classic’ C-N type AGB stars lie.
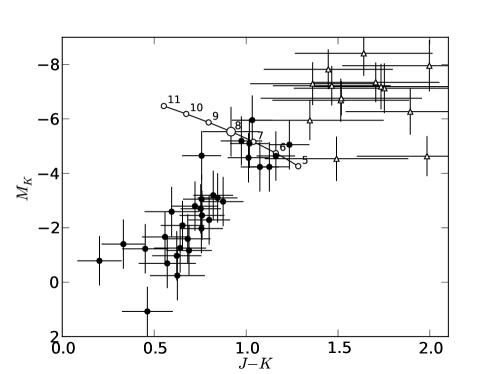
We see quite a striking separation in the diagram, with the Bulge carbon stars being systematically bluer than the local disk C-N stars, and a little less luminous. The equivalent comparison with carbon stars in the Sagittarius Dwarf galaxy was made in Figure 4 of Whitelock et al. (1999), where the difference in properties was used to argue against associating the Bulge carbon stars with that galaxy. Star A falls securely within the region occupied by the Azzopardi’s Bulge carbon stars, and does not overlap in color with the distribution of local C-N stars. This star therefore appears to be a bona fide member of the Bulge carbon star population.
Among the objects from Azzopardi et al. (1991), we note a division into two groups in the diagram, with star A lying among the more luminous objects. It is possible that the lower group represents the top of the Bulge carbon star red giant branch, with the upper group being the AGB. This is consistent with the classification of star A as a low luminosity AGB star, and the evidence for episodes of dust formation in its OGLE lightcurve.
We show the effect of assuming a distance range of 5–11 kpc in Figure 7 with a dashed line, assuming that extinction varies linearly with distance. The latter is a crude assumption, but it should be remembered that at the latitude of CX332, the line of sight is still only pc above the Plane at the distance of the Bulge, so has not completely left the disk extinction. Allowing a closer distance kpc would move star A into the middle of the upper clump of Bulge carbon stars. It may thus be on the near side of the Bulge.
8. X-ray Characteristics
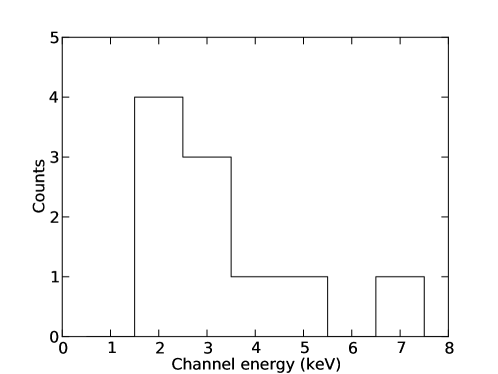
CX332 was only detected once by the GBS, in observation ID 8693, with 8 reported photons (Jonker et al., 2011). This is clearly insufficient for a rigorous spectral analysis, but we may still hope to recover some information about the hardness of the spectrum from the channel energies of individual photons. In order to ensure uniformity, Jonker et al. (2011) truncated observations longer than 2 ks to a 2 ks length. Observation 8693 had a livetime of 2.16 ks, and CX332 was 7.85 arcmin off-axis, so we re-extract events from the full exposure time with an aperture radius of 8.1 arcsec. We recover 10 events below 8 keV from the source region and expect about 1 from the background. We present a histogram of event channel energies in Fig. 8. The spectrum is clearly hard, with no events detected below 1.5 keV, and multiple events above 3.0 keV.
Muerset et al. (1997) surveyed ROSAT spectra of symbiotics. They classified them into three groups, , and . Luna et al. (2013) reexamined the classification scheme in the light of the harder coverage offered by a Swift survey. They added a fourth class and also identified a number of sources exhibiting both and components.
Class shows supersoft emission with negligible counts above 0.4 keV. This is believed to originate in quasi-steady nuclear burning on a white dwarf. Class shows harder emission characterized by a thermal spectrum around K, with most of the photons at energies below 2.4 keV. This may originate in the interaction of winds from the red giant and the white dwarf’s accretion disk. The class of Muerset et al. (1997) originally contained just two objects, the SyXB GX 1+4 and Hen 1591 which is suggested to also host a neutron star. Luna et al. (2013) generalize this to neutron star systems with hard spectra characterized by Comptonized emission with no emission lines. The new class also have hard, absorbed spectra, but with a thermal spectrum with strong emission lines. This is attributed to accretion powered boundary layer emission from a white dwarf surface.
CX332 is clearly not consistent with the class, and also has a harder spectrum than is typical of class sources. Our observed median event energy is around 2.8 keV, with only one event detected with a channel energy below 2.0 keV. It most likely fits into either the classification, as a neutron star SyXB, or the class as a white dwarf symbiotic lacking optical emission lines.
If we characterize the spectrum of CX332 with a power-law, then we find that a power-law subject to interstellar extinction does produce the observed median event channel energy. At the Galactic center distance, this would imply a luminosity erg s-1. This would be quite typical of an SyXB, but is higher than the erg s-1 typically seen in components from white dwarf symbiotics Luna et al. (2013).
A simple argument can test whether the ergs s-1 for CX332 is too high for the class of symbiotic stars. Kenyon & Webbink (1984) performed detailed simulations of the optical spectra of symbiotics with hot stars of different temperatures and luminosities, and found that an accretion rate of M⊙ yr-1 onto a 1 M⊙ white dwarf was the lower limit for detection of emission lines in the optical spectrum, converting to a bolometric luminosity of ergs/s. Muerset et al. (1991) calculate the bolometric luminosities of a large number of known symbiotic stars, and show that all but one have a luminosity of the hot component above 10 L⊙, corresponding to ergs s-1. Thus, if the observed X-ray emission is optically thin radiation from an accretion flow onto a white dwarf (as seen in low-accretion-rate cataclysmic variables (e.g. Patterson & Raymond, 1985), then the total accretion luminosity can be consistent with the lack of observed optical emission lines and this possibility cannot be rejected.
9. Discussion
We have identified star A, apparently a late C-R type carbon star near the base of the AGB as the most likely optical counterpart to CX332. There have been very limited X-ray detections of AGB stars. Kastner & Soker (2004) found Mira at a luminosity of erg s-1. Ramstedt et al. (2012) examined observations covering 13 AGB stars and found only two reasonably confident detections at likely luminosities erg s-1. All three of these AGB stars have quite soft X-ray spectra peaking around 1 keV, and in all three cases a binary companion could be the origin of the X-rays. The inferred X-ray luminosity and hardness of CX332 thus appear inconsistent with intrinsic emission from AGB stars and instead point to a symbiotic nature. This allows the possibility of either a white dwarf or neutron star companion, based on other known symbiotics. A black hole companion is also possible in principle, although would be unprecedented.
The X-ray hardness and luminosity of CX332, and the lack of optical emission lines of star A, are all very typical of the majority of known neutron star SyXBs, and CX332 would fit well within this class. Currently only one SyXB has been proposed with a carbon star companion, CGCS 5926 (Masetti et al., 2011), and it is not in the Bulge.
White dwarf symbiotics are typically characterized by soft X-ray spectra and optical emission lines. Chandra and Swift observations, however (e.g. Luna et al., 2013) are showing that some symbiotics do also have strong, hard components in their spectra, and some only have hard components. In a few cases, e.g. NQ Gem, these also lack emission lines in some observations (Munari & Zwitter, 2002), resulting in properties quite similar to CX332, although sources without at least H emission are still the exception rather than the rule. This may be a consequence of lower accretion rates onto the white dwarf leading to optically thinner harder X-ray spectra and lower UV luminosities with which to ionize the red giant wind. In searching for X-ray sources within the Bulge, Chandra will more effectively identify objects such as these than it will identify classic white dwarf symbiotics with softer X-ray spectra.
Hence we can expect that an X-ray selected symbiotic population will have different demographics than one selected optically. This is reflected in the sample of symbiotic candidates identified by van den Berg et al. (2006), which is dominated by sources with hard X-ray spectra and a deficit of optical emission lines. Disentangling the two populations of SyXBs and X-ray selected white dwarf symbiotics is then a challenging task observationally, but an essential one if we are to reliably determine the SyXB population of the Galaxy and test models such as that of Lü et al. (2012).
10. Conclusions
We have examined the closest optical counterpart candidates to the Galactic Bulge Survey (GBS) source CX332. The source lies close to an infrared-bright star that we identify as an AGB-type carbon star, most likely a late C-R star, or possibly early C-N. Carbon stars are extremely rare in the Bulge and so we estimate a probability of only 0.1 % of finding even one chance coincidence with a carbon star in the whole GBS. If the X-ray source is associated with the carbon star then we have argued that the X-ray luminosity and hardness, and lack of optical emission lines are more consistent with a symbiotic X-ray binary (SyXB) rather than with a white dwarf system, although the latter cannot be confidently ruled out. If this interpretation is correct it will be only the second proposed SyXB with a carbon star companion, and the first based on a secure X-ray detection.
References
- Abia & Isern (2000) Abia, C., & Isern, J. 2000, ApJ, 536, 438
- Alard & Lupton (1998) Alard, C., & Lupton, R. H. 1998, ApJ, 503, 325
- Alard (2000) Alard, C. 2000, A&AS, 144, 363
- Alksnis et al. (2001) Alksnis, A., Balklavs, A., Dzervitis, U., et al. 2001, Baltic Astronomy, 10, 1
- Azzopardi et al. (1991) Azzopardi, M., Rebeirot, E., Lequeux, J., & Westerlund, B. E. 1991, A&AS, 88, 265
- Barnbaum et al. (1996) Barnbaum, C., Stone, R. P. S., & Keenan, P. C. 1996, ApJS, 105, 419
- Belczyński et al. (2000) Belczyński, K., Mikołajewska, J., Munari, U., Ivison, R. J., & Friedjung, M. 2000, A&AS, 146, 407
- Bilir et al. (2011) Bilir, S., Karaali, S., Ak, S., et al. 2011, MNRAS, 417, 2230
- Blanco & McCarthy (1983) Blanco, V. M., & McCarthy, M. F. 1983, AJ, 88, 1442
- Blanco & Terndrup (1989) Blanco, V. M., & Terndrup, D. M. 1989, AJ, 98, 843
- Cardelli et al. (1989) Cardelli, J. A., Clayton, G. C., & Mathis, J. S. 1989, ApJ, 345, 245
- Chakrabarty & Roche (1997) Chakrabarty, D., & Roche, P. 1997, ApJ, 489, 254
- Cutri et al. (2003) Cutri, R. M., Skrutskie, M. F., van Dyk, S., et al. 2003, VizieR Online Data Catalog, II/246
- Cutri & et al. (2012) Cutri, R. M., & et al. 2012, VizieR Online Data Catalog, II/311
- DENIS Consortium (2005) DENIS Consortium 2005, VizieR Online Data Catalog, II/263
- Dominy (1984) Dominy, J. F. 1984, ApJS, 55, 27
- Frei & Gunn (1994) Frei, Z., & Gunn, J. E. 1994, AJ, 108, 1476
- Fukugita et al. (1995) Fukugita, M., Shimasaku, K., & Ichikawa, T. 1995, PASP, 107, 945
- Gonzalez et al. (2011) Gonzalez, O. A., Rejkuba, M., Zoccali, M., Valenti, E., & Minniti, D. 2011, A&A, 534, A3
- Gonzalez et al. (2012) Gonzalez, O. A., Rejkuba, M., Zoccali, M., et al. 2012, A&A, 543, A13
- Güdel (2004) Güdel, M. 2004, A&A Rev., 12, 71
- Hamuy et al. (1994) Hamuy, M., Suntzeff, N. B., Heathcote, S. R., et al. 1994, PASP, 106, 566
- Hong et al. (2005) Hong, J., van den Berg, M., Schlegel, E. M., et al. 2005, ApJ, 635, 907
- Hynes (2002) Hynes, R. I. 2002, A&A, 382, 752
- Izzo et al. (2004) Izzo, C., Kornweibel, N., McKay, D., et al. 2004, The Messenger, 117, 33
- Jarrett et al. (2011) Jarrett, T. H., Cohen, M., Masci, F., et al. 2011, ApJ, 735, 112
- Jonker et al. (2011) Jonker, P. G., Bassa, C. G., Nelemans, G., et al. 2011, ApJS, 194, 18
- Kastner & Soker (2004) Kastner, J. H., & Soker, N. 2004, ApJ, 616, 1188
- Keenan (1993) Keenan, P. C. 1993, PASP, 105, 905
- Kenyon & Webbink (1984) Kenyon, S. J., & Webbink, R. F. 1984, ApJ, 279, 252
- Le Fèvre et al. (2003) Le Fèvre, O., Saisse, M., Mancini, D., et al. 2003, Proc. SPIE, 4841, 1670
- Luna et al. (2013) Luna, G. J. M., Sokoloski, J. L., Mukai, K., & Nelson, T. 2013, A&A in press, arXiv:1211.6082
- Lü et al. (2012) Lü, G.-L., Zhu, C.-H., Postnov, K. A., et al. 2012, MNRAS, 424, 2265
- Masetti et al. (2006) Masetti, N., Orlandini, M., Palazzi, E., Amati, L., & Frontera, F. 2006, A&A, 453, 295
- Masetti et al. (2011) Masetti, N., Munari, U., Henden, A. A., et al. 2011, A&A, 534, A89
- Masetti et al. (2012) Masetti, N., Nucita, A. A., & Parisi, P. 2012, A&A, 544, A114
- Mikołajewska (2007) Mikołajewska, J. 2007, Baltic Astronomy, 16, 1
- Monet et al. (2003) Monet, D. G., Levine, S. E., Canzian, B., et al. 2003, AJ, 125, 984
- Muerset et al. (1991) Muerset, U., Nussbaumer, H., Schmid, H. M., & Vogel, M. 1991, A&A, 248, 458
- Muerset et al. (1997) Muerset, U., Wolff, B., & Jordan, S. 1997, A&A, 319, 201
- Munari & Zwitter (2002) Munari, U., & Zwitter, T. 2002, A&A, 383, 188
- Ng (1997) Ng, Y. K. 1997, A&A, 328, 211
- Patterson & Raymond (1985) Patterson, J., & Raymond, J. C. 1985, ApJ, 292, 535
- Pojmanski (2002) Pojmanski, G. 2002, Acta Astronomica, 52, 397
- Ramstedt et al. (2012) Ramstedt, S., Montez, R., Kastner, J., & Vlemmings, W. H. T. 2012, A&A, 543, A147
- Richer (1971) Richer, H. B. 1971, ApJ, 167, 521
- Robin et al. (2003) Robin, A. C., Reylé, C., Derrière, S., & Picaud, S. 2003, A&A, 409, 523
- Rowe et al. (2005) Rowe, J. F., Richer, H. B., Brewer, J. P., & Crabtree, D. R. 2005, AJ, 129, 729
- Shaw (2009) Shaw, R. A. (ed.) 2009, NOAO Data Handbook (Version 1.1; Tucson; National Optical Astronomical Observatory)
- Spitzer Science Center (2009) Spitzer Science Center 2009, VizieR Online Data Catalog, II/293
- Tokunaga & Vacca (2005) Tokunaga, A. T., & Vacca, W. D. 2005, PASP, 117, 1459
- Udalski et al. (2012) Udalski, A., Kowalczyk, K., Soszyński, I., et al. 2012, Acta Astronomica, 62, 133
- van den Berg et al. (2006) van den Berg, M., Grindlay, J., Laycock, S., et al. 2006, ApJ, 647, L135
- Wallace (1962) Wallace, L. 1962, ApJS, 7, 165
- Wallerstein & Knapp (1998) Wallerstein, G., & Knapp, G. R. 1998, ARA&A, 36, 369
- Whitelock et al. (1999) Whitelock, P., Menzies, J., Irwin, M., & Feast, M. 1999, in IAU Symp. 192: The Stellar Content of Local Group Galaxies, ed. P. Whitelock & R. Cannon (San Francisco, CA: ASP), 136
- Zamora et al. (2009) Zamora, O., Abia, C., Plez, B., Domínguez, I., & Cristallo, S. 2009, A&A, 508, 909