smith_joe
EDS’09
CMS results on soft diffraction
Abstract
We present measurements of soft single- and double-diffractive cross sections, as well as of forward rapidity gap cross sections at 7 TeV at the LHC, and compare the results to other measurements and to theoretical predictions implemented in various Monte Carlo simulations.
1 Introduction
Diffractive interactions are characterized by the presence of at least one non-exponentially suppressed large rapidity gap (lrg) in the final state, defined as a region in pseudorapidity devoid of particles. The origin of lrgs is attributed to a color-singlet exchange with vacuum quantum numbers, referred to as Pomeron () exchange.
Soft diffractive interactions (with no hard scale) cannot be calculated within perturbative qcd (pqcd), and traditionally have been described by models based on Regge theory. Model predictions generally differ when extrapolated from pre-lhc energies ( TeV) to 7 TeV at lhc. Thus, measurements of diffractive cross sections at the lhc provide a valuable input for understanding diffraction and improving the modeling of diffraction in current event generators.
The first cms measurements of single-diffractive (SD), double-diffractive (DD), and forward rapidity gap cross are presented. Results are based on 2010 data when the lhc was running in a low pile-up scenario, most suitable for event selection based on the lrg signature.
2 Inclusive diffractive cross sections
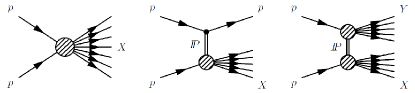
Diffractive cross sections have been measured [1] based on a minimum-bias sample at TeV. The sd and dd events (Fig. 1) were separated using the castor calorimeter, which covers the very forward region of the experiment, -6.6 -5.2. Minimum-bias events were selected by requiring a signal above noise level in any of the bsc (Beam Scintillator Counter) devices () and the presence of at least two energy deposits in the central detector (). No vertex requirement was imposed. Diffractive events were selected by requiring the presence of a forward rapidity gap reconstructed at the edge of the central detector or central gap. The forward gap on the positive (negative) side was reconstructed in terms of the variable () defined as the highest (lowest) of a particle reconstructed in the detector. The central gap was reconstructed as , with () defined as the closest-to-zero of a particle reconstructed on the positive (negative) -side of the central detector, with an additional requirement of activity on both sides of the detector. Figure 2 shows distributions of , and compared to predictions of pythia8-mbr [2, 3]. Diffractive events appear as a flattening of the exponentially falling distributions of non-diffractive (nd events with rapidity gaps due to random multiplicity fluctuations, and dominate the regions of low , high , or high .


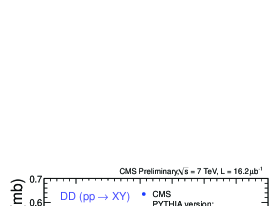
The event sample after the selection (Fig. 2, middle) was used to extract SD and DD cross sections. The sample consists of approximately equal numbers of SD and DD events for which one of the dissociated masses is low and escapes detection in the central detector. Subsamples enhanced in SD and DD events were selected by requiring an absence or a presence of an energy deposit (above threshold) in the castor calorimeter. The SD/DD separation with castor is presented in Fig. 3, showing the distribution of the variable calculated from all energy deposits in the detector. For SD events, approximates the incoming-proton momentum loss. These distributions were used to measure the differential SD cross section as a function of , and the differential DD cross section as a function of for (castor acceptance), after subtracting the background contribution to the signal (DD to SD and nd to DD). Results are compared to MC models in Figs. 4 (left) and (middle), respectively. The predictions of pythia8-mbr are shown for two values of the parameter of the Pomeron trajectory (), and . Both values describe the measured SD cross section within uncertainties, while the DD data favor the smaller value of . The predictions of pythia8-4c and pythia6 describe well the measured DD cross section, but fail to describe the falling behavior of the data (see details in [1]). The total SD cross cross section integrated over the region ( GeV) was measured to be mb (dissociation of either proton).
The event sample after the selection (Fig. 2, right) was used to extract the differential dd cross section as a function of the central-gap width, . The cross section for , M GeV and M GeV is presented in Fig. 3 (right). The total dd cross cross section integrated over this region was measured to be mb.

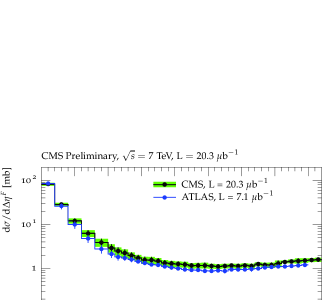
The inclusive differential cross section for events with a forward rapidity gap was measured, with defined as the larger of gaps within . A Bayesian-unfolded and fully corrected cross section for particles with MeV and was extracted and compared to pythia6-z2* [4], pythia8-4c, and pythia8-mbr ( and ) predictions. Figure 5 shows a comparison to the atlas measurement [5]. The cms measurement extends the atlas result by 0.4 units of gap width. The two results are in agreement within the uncertainties, which at cms are dominated by HF energy scale, hadronization, and diffraction model used.
References
- [1] cms collaboration, Measurement of diffraction dissociation cross sections at = 7 TeV at the LHC, CMS-FSQ-12-005 (2013).
- [2] R. Ciesielski, K. Goulianos, MBR Monte Carlo Simulation in PYTHIA8, arXiv:1205.1446 (2012).
- [3] K. Goulianos, Hadronic diffraction: where do we stand?, arXiv:hep-ph/0407035 (2004); K. Goulianos, Diffraction in QCD, arXiv:hep-ph/0203141 (2002); K. Goulianos, A New Statistical Description of Hadronic and Multiplicities, Phys. Lett. B193 151 (1987).
- [4] R. Field, Early LHC Underlying Event Data - Findings and Surprises, arXiv:1010.3558 (2010).
- [5] G. Aad et al. atlas collaboration, Eur. Phys. J. C72 1926 (2012), arXiv:1201.2808 (2012).